High-throughput absorption, distribution, metabolism, and excretion (ADME) screening for the properties of drug candidates have become an essential part of modern drug development. Such screening provides a basis for better information and, consequently, better decision-making in the drug discovery and development process.1 As part of these studies, incubating candidate compounds together with liver microsomes containing cytochrome CYP450 is relied upon extensively to determine compound metabolism, stability, and possible drug-drug interactions (DDI).
The use of CYP450 to determine drug-drug interactions is carried out through inhibition and induction studies and is of particular importance because as the number of prescribed drugs increases, the greater the probability that an adverse drug reaction could exist. Also, it has been stated that there could be up to a 40% probability of a DDI when a patient is administered ten drugs or more.2 In a standard CYP450 inhibition and induction assay, multiple test compounds are evaluated to determine their ability to alter or influence the metabolism of known CYP450 specific substrates.
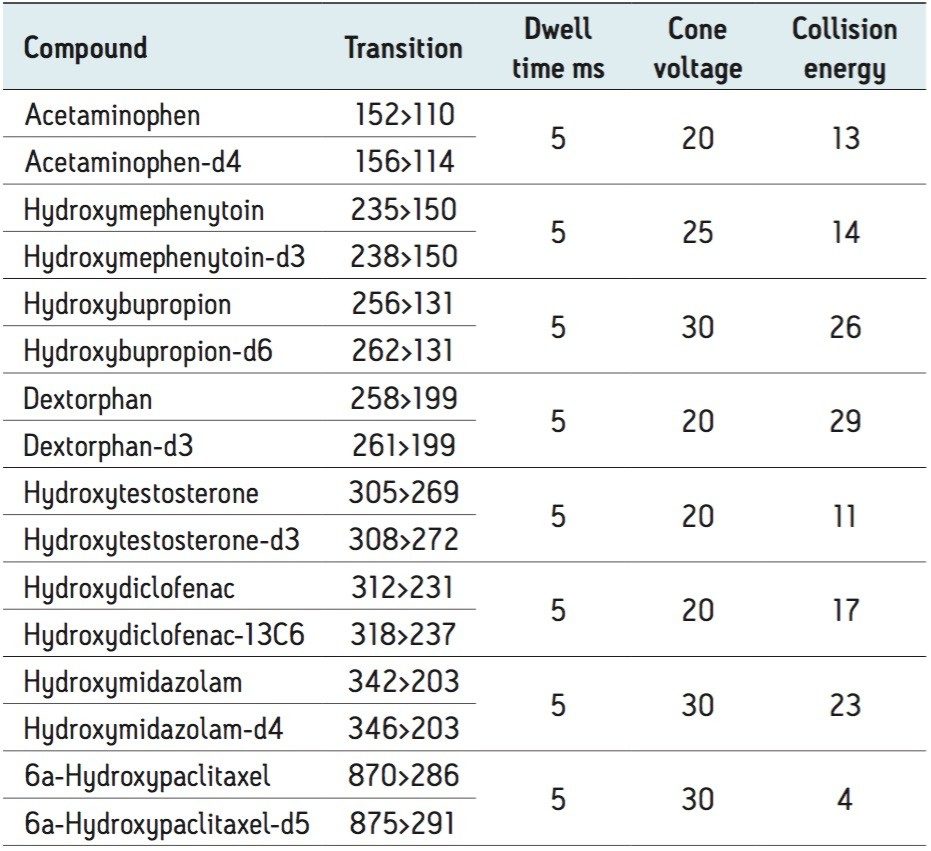
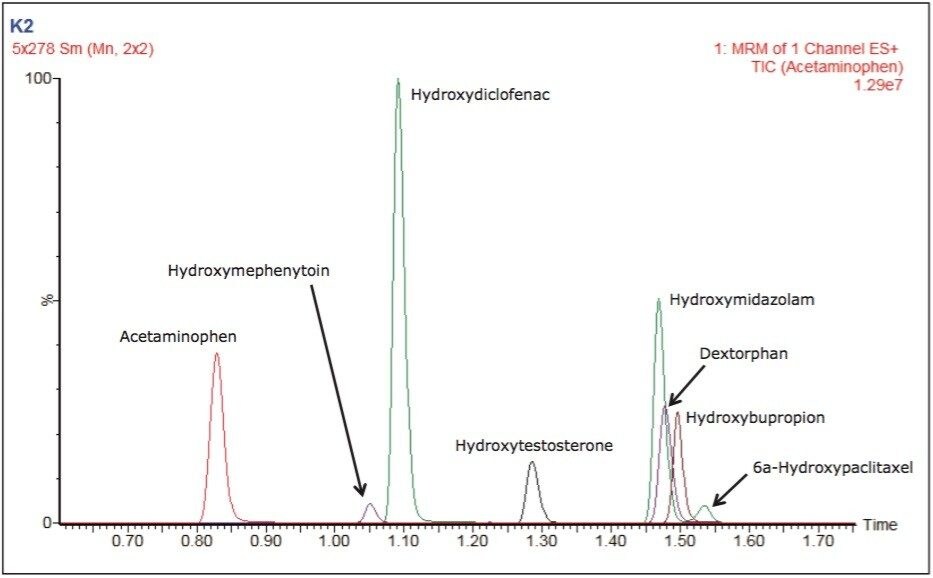
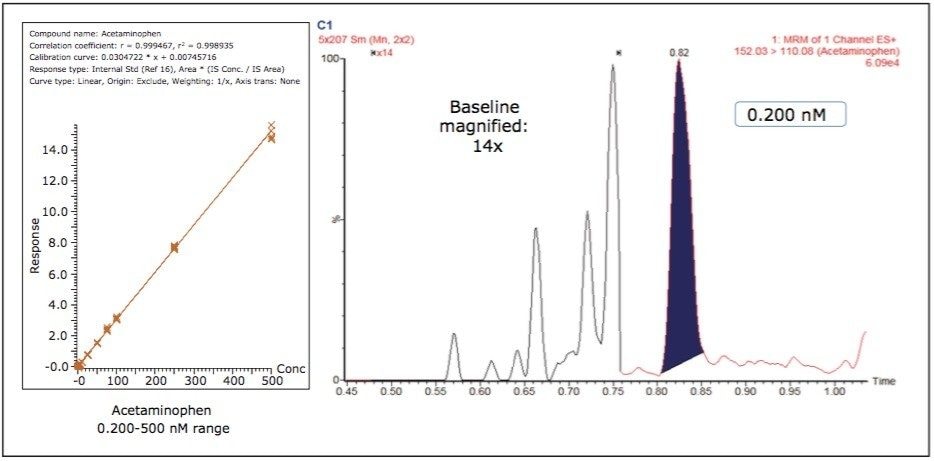
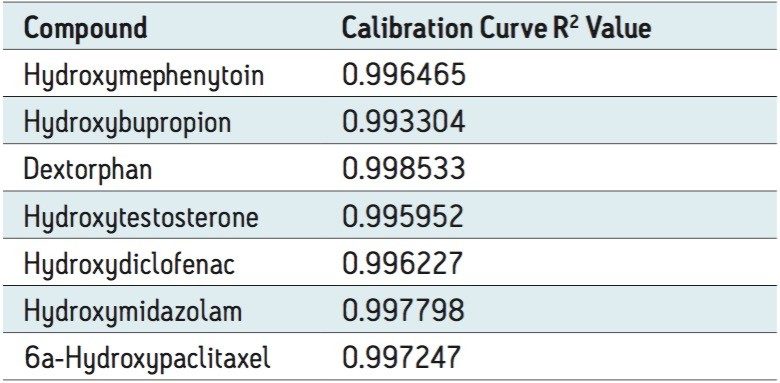
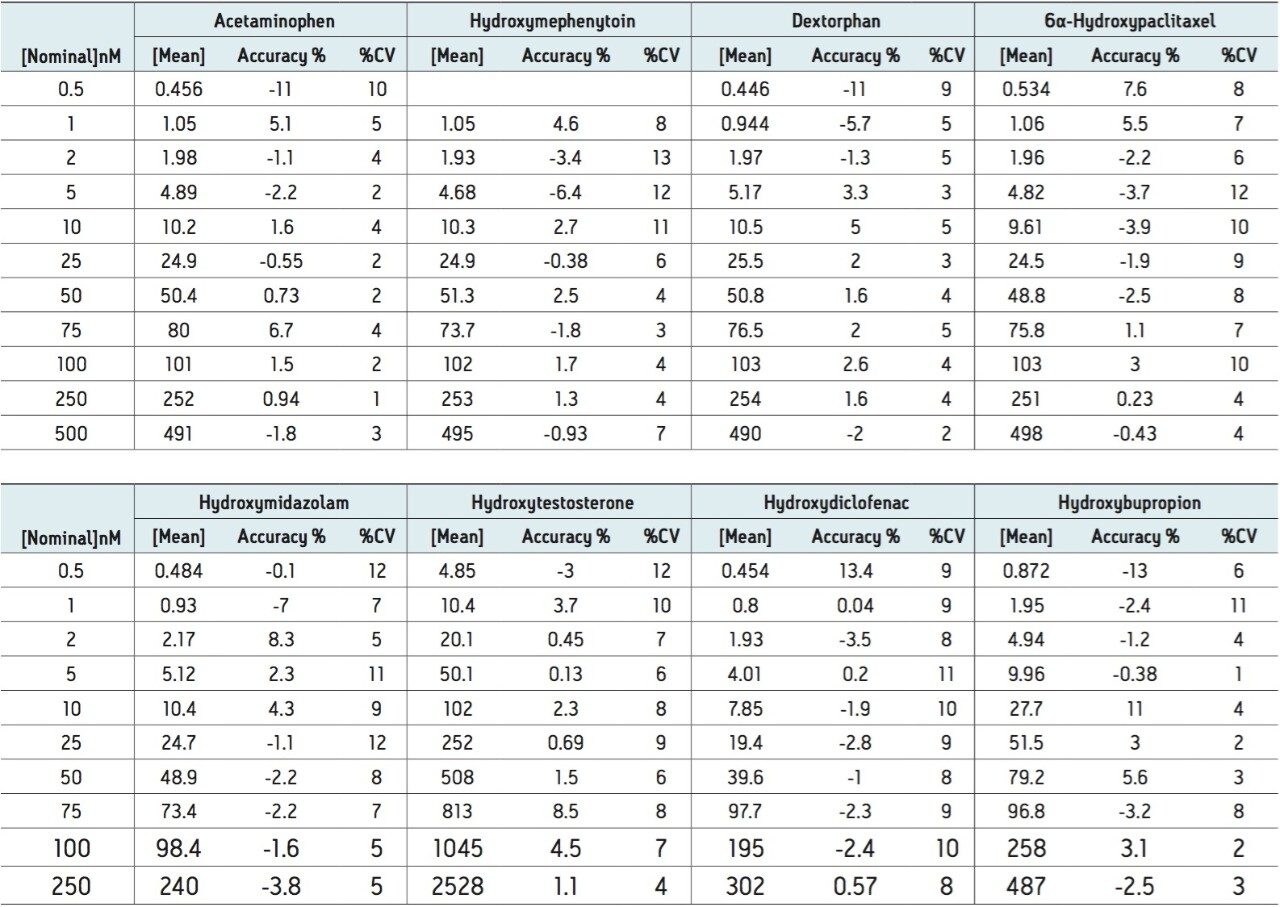
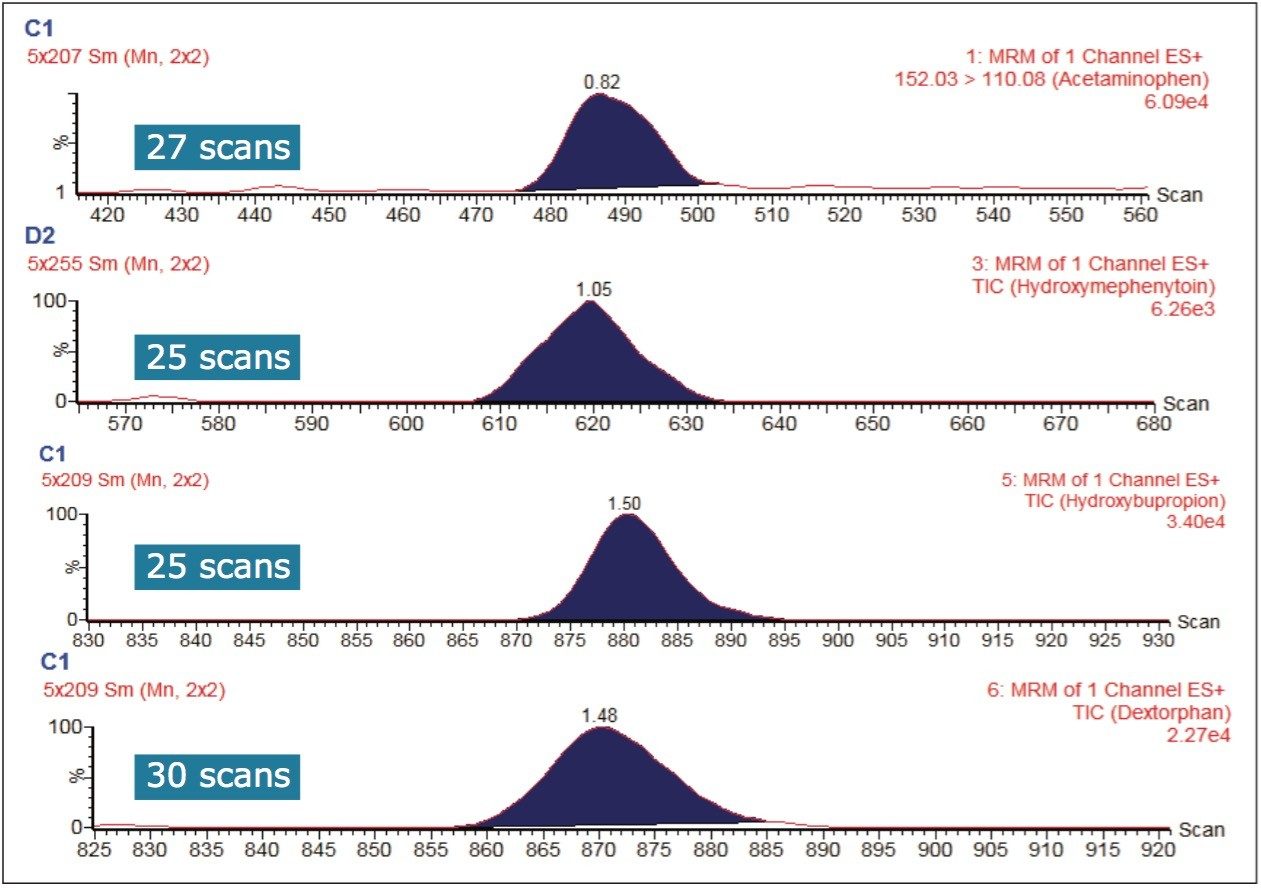
In the work presented here, we show the development and validation of a rapid and sensitive LC-MS method for the simultaneous detection and quantification of multiple, selected CYP450 substrates and metabolites.