• Application Note

Unparalleled Specificity Using HDMS Technology in a MALDI Imaging Experiment

Unparalleled Specificity Using HDMS Technology in a MALDI Imaging Experiment

  • Waters Corporation

This is an Application Brief and does not contain a detailed Experimental section.

Abstract

This application brief demonstrate the benefit of an orthogonal method of separation in a MALDI imaging experiment using the MALDI SYNAPT G2 HDMS combined with novel High Definition Imaging (HDI) MALDI Software and distinguish nominally isobaric molecules for accurate distributions within whole body tissue sections.

Benefits

Obtain the power of ion mobility separation (IMS) to distinguish and visualize MALDI ions from a tissue section where an m/z resolving power over 1.8 million is needed without the use of an orthogonal separation dimension

Introduction

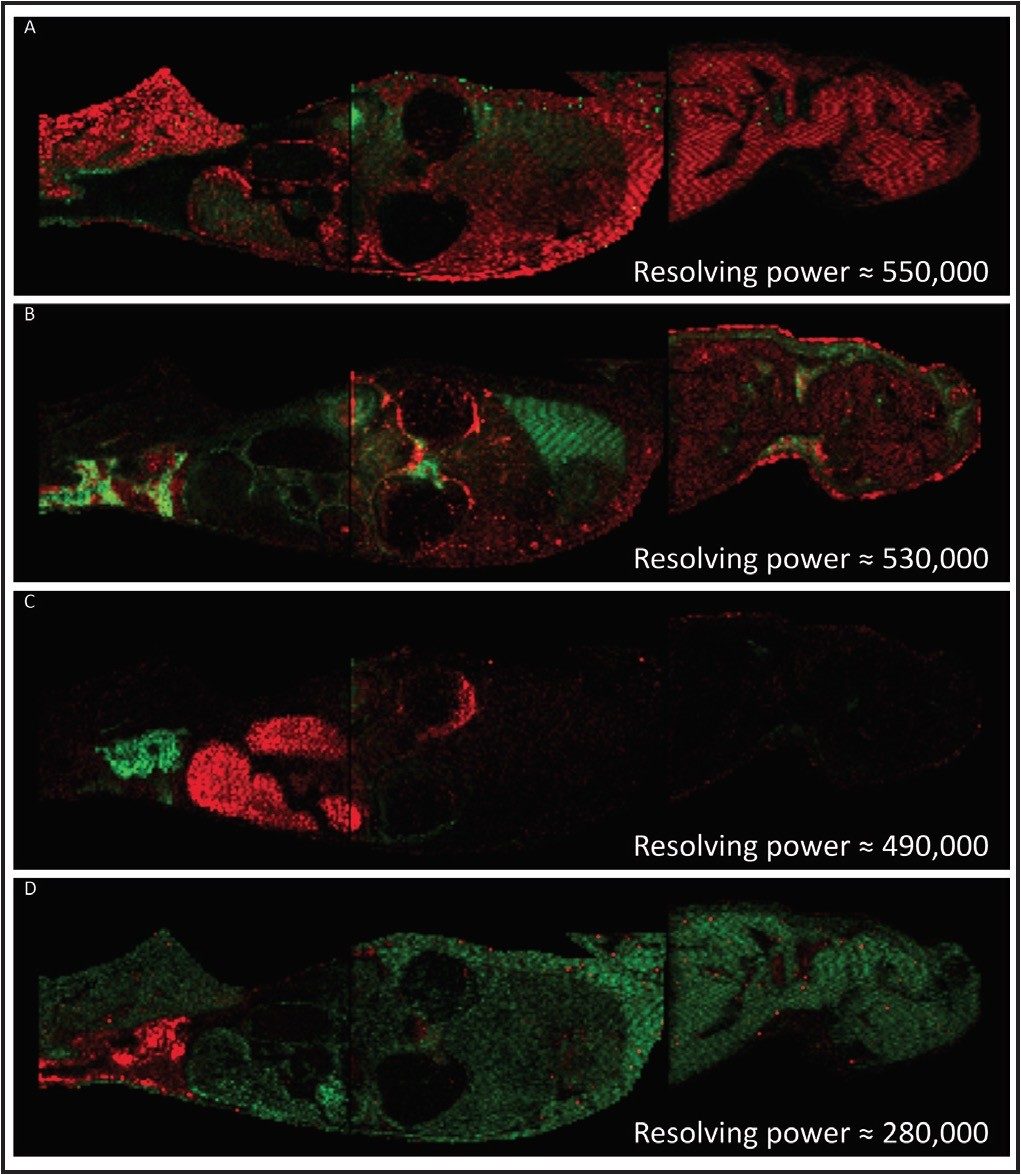
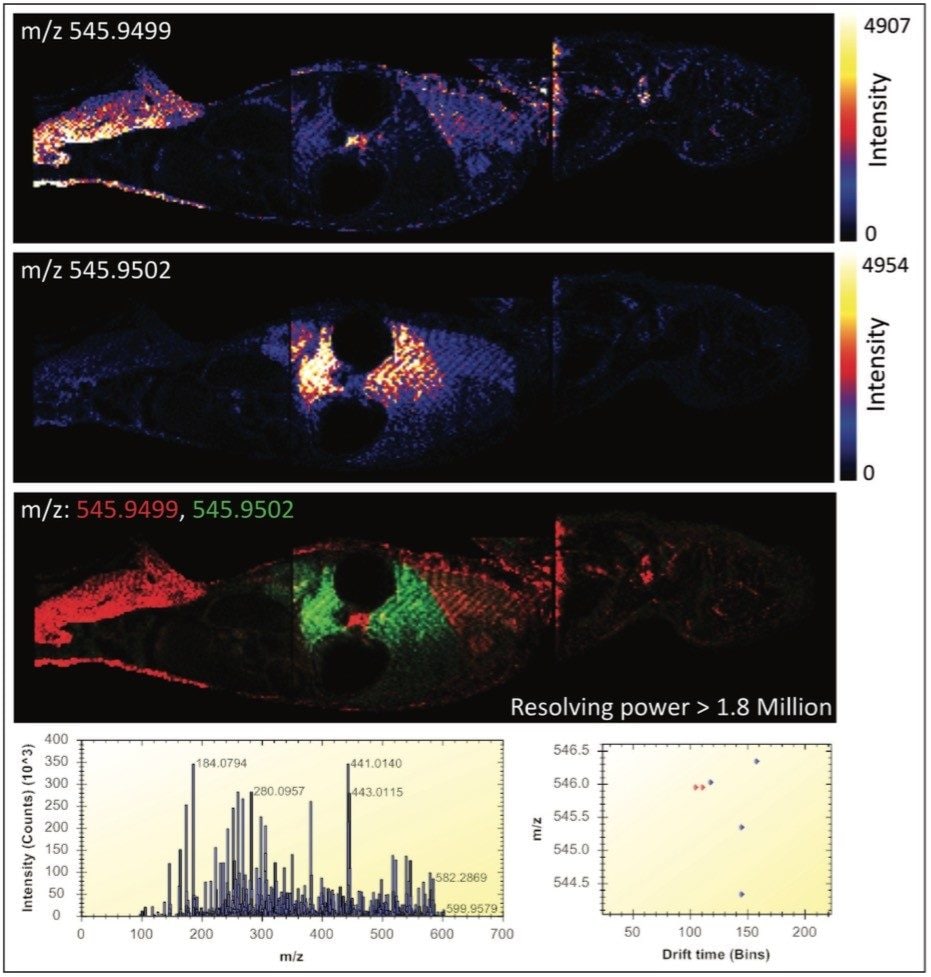
Mass spectrometry imaging (MSI), particularly MALDI imaging, is a technique that is gaining considerable momentum and is seen to be an extremely powerful tool for proteomics, lipidomics and metabolomics. Data sets produced from imaging experiments can be complex due to the high number of species, either endogenous or exogenous, present within the tissue section. However, one of the key problems faced in MSI is specificity, i.e. how to distinguish two or more molecular ions with very similar m/z, but with distinctly different distributions. Differentiation of some very close m/z values may be possible using a mass spectrometer with high mass resolving power; however, for many isobaric molecules, the resolving power required may exceed practical limits. In the case of pure isobaric molecules (with exactly the same m/z), no amount of m/z resolving power will separate the ions. An additional form of orthogonal separation to m/z measurement is required. Ion mobility separation (IMS) adds that crucial additional dimension of separation based on the size and shape of ions in the gas phase.

Waters has pioneered the use of IMS in MALDI imaging experiments and improved the workflow with the novel Waters proprietary High Definition Imaging (HDI) MALDI Software, allowing the full integration of ion mobility in the visualization of ion distributions directly from tissue sections.

Results and Discussion

A rat whole body tissue section, divided and mounted on three Waters target plates, was spray coated with α-cyanno hydroxycinnamic acid using an airbrush. The areas to be imaged were defined using Waters HDI MALDI Software. Data were acquired using a Waters MALDI SYNAPT G2 HDMS at a spatial resolution of 400 μm. The data were also processed and visualized using the HDI MALDI Software. Figure 1 shows a series of examples where pairs of isobaric ions have been distinguished, displayed as red and green overlayed ion images. The images illustrate the differential distribution of these ions across a whole body section of the rat. This degree of visualization would be a major challenge for most MALDI mass spectrometers due to their closeness in m/z. However, since the ions of interest have different shapes in the gas phase, they become separated by IMS, with an average of 5% difference in drift time.

 Overlays of molecular distributions of ions differentiated by m/z and ion mobility drift time
Figure 1. Overlays of molecular distributions of ions differentiated by m/z and ion mobility drift time. Each image displays the approximate resolving power required to differentiate the ions by m/z alone.
A: Red = m/z 331.1382, Green = m/z 331.1388;
B: Red = m/z 370.0500, Green = m/z 370.0507;
C: Red = m/z 296.1670, Green = m/z 296.1676;
D: Red = m/z 303.1087, Green = m/z 303.1098

Figure 2 illustrates the most powerful example. Here, the mass difference of the two Apex3D peaks detected at m/z 545.9 is 0.3 mDa, where a mass spectrometer with a resolving power in excess of 1.8 million would be required for only a partial differentiation of the two isobaric ions based on m/z alone. In this figure, the MS spectrum view is shown, along with the 2D-plot (drift time vs. m/z) in the HDI MALDI Software. The new HDI MALDI Software interface has been designed for maximum ease-of-use and by simply clicking on the dots (representing 3D Apex m/z peaks), ion images are generated. The combination of these new tools allowed the facile analysis of molecular distributions with an unparalleled level of confidence.

Visualization of the distributions of two ions requiring an m/z resolving power in excess of 1.8 million

Conclusion

  • Waters MALDI SYNAPT HDMS combined with HDI MALDI Software allows the differentiation of isobaric ions in rat whole body tissue section MALDI imaging experiments, achieving high confidence molecular distribution visualization.
  • Waters HDI MALDI Software allowed for an intuitive workflow from pattern definition through processing to data visualization.

Dr. Lars Bendahl from Lundbeck A/S (Danemark) is greatly acknowledged for providing the rat whole-body sections.

720004259, April 2012

Back To Top Back To Top