In this study, sensitive and selective methods for ethinylestradiol in human plasma were developed and partially validated.
Ethinylestradiol (EE) is a common synthetic estrogen used in birth control formulations, and is often combined with other semi-synthetic estrogens. Estrogens are involved in development and maintenance of the female phenotype, germ cell maturation, and pregnancy. Males also utilize estrogen-based steroids for growth processes, nervous system maturation, bone metabolism and remodeling, and endothelial responsiveness. [1] Due to the presence of estrogen and related steroids in biological matrices, full chromatographic resolution of EE from these endogenous constituents is challenging. To accurately quantify EE, these endogenous compounds need to be efficiently removed, reduced, or separated utilizing a combination of sample preparation and chromatography. All remaining interferences after sample preparation must also be chromatographically resolved from the estrogen-based active pharmaceutical ingredient (API).
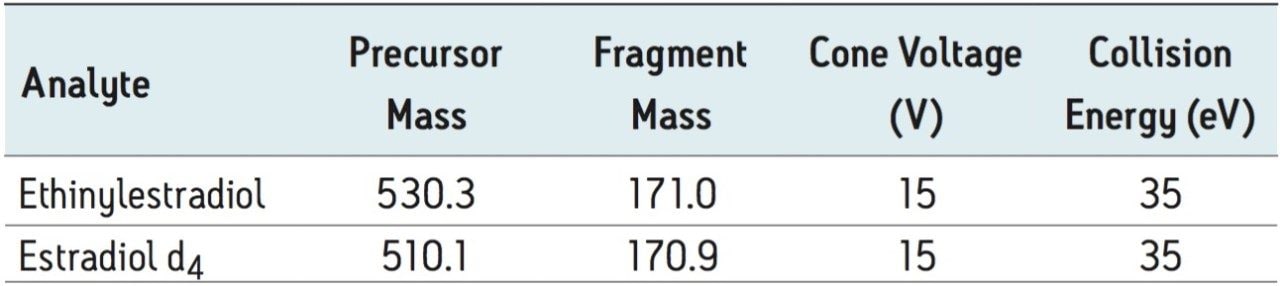
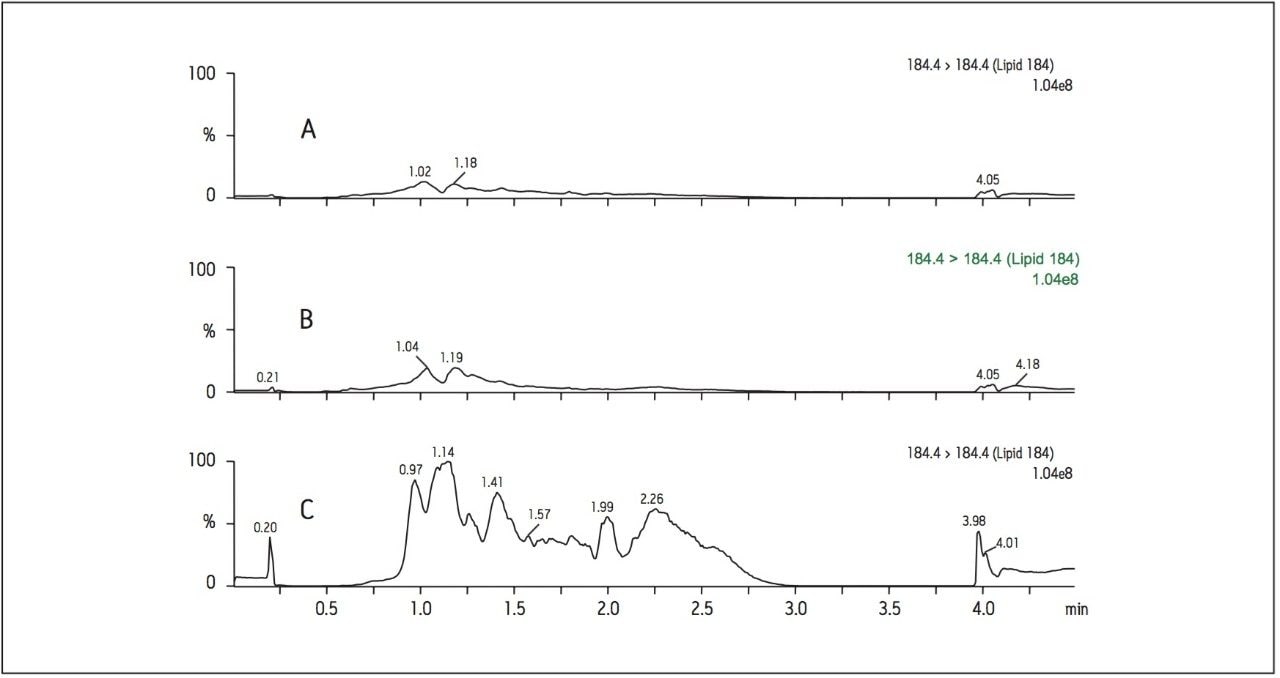
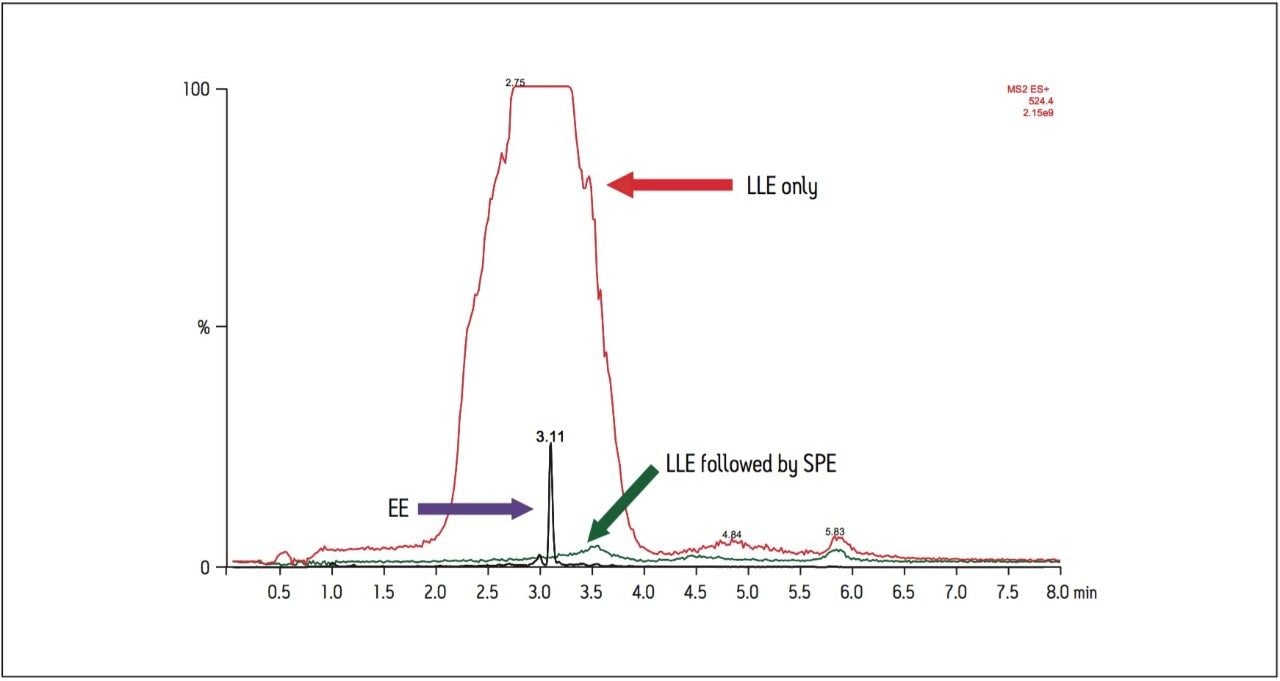
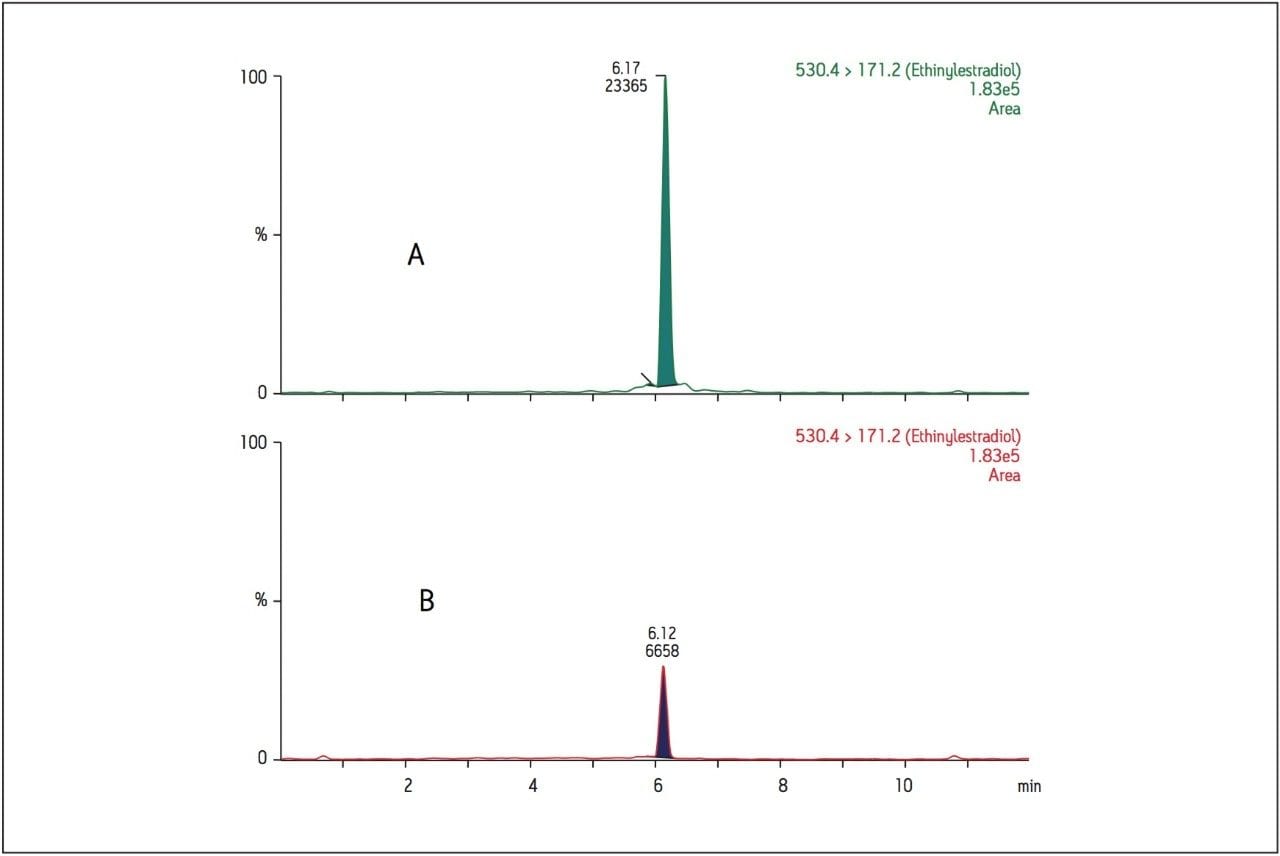
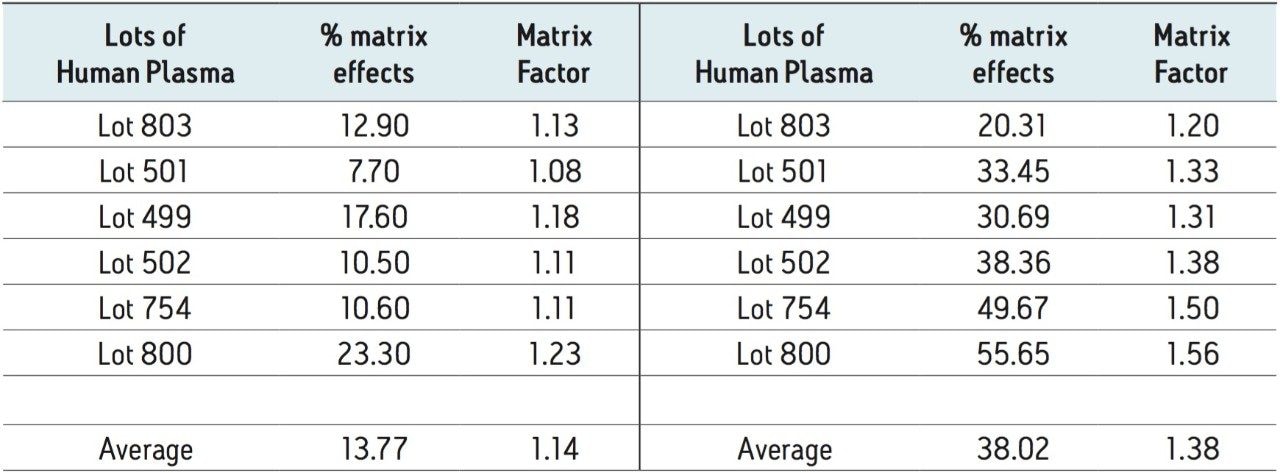
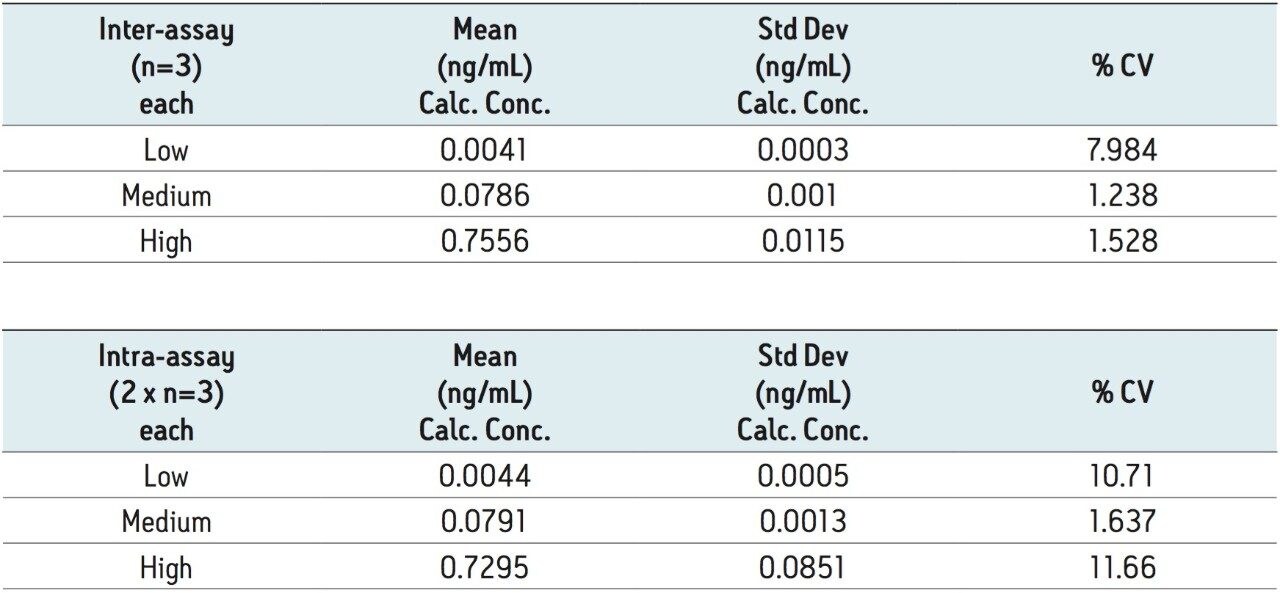
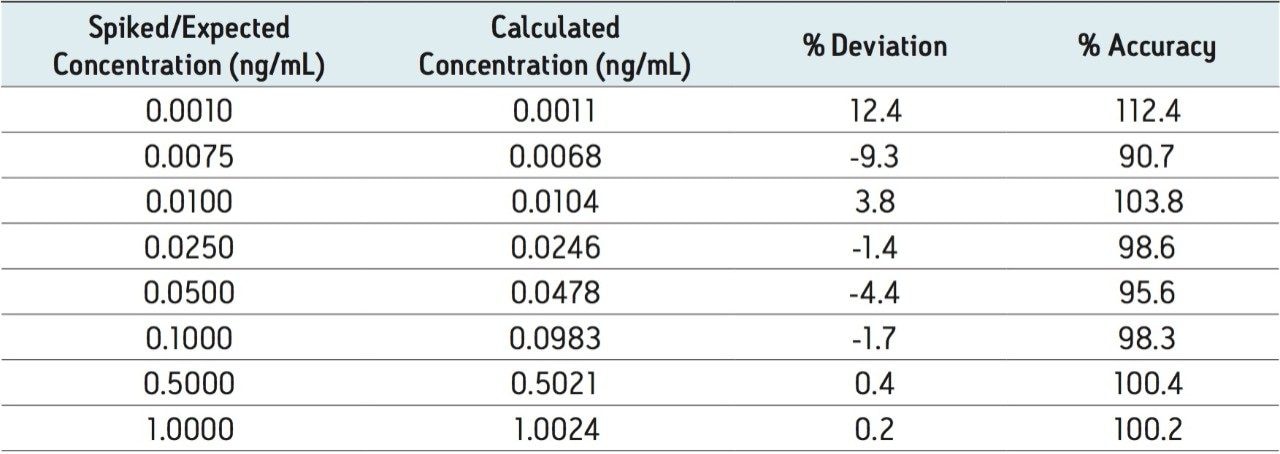
Recent published methods for EE utilize sample preparation consisting of liquidliquid extraction and derivatization. [1,2,3,4,5,6,7] These methods are capable of reaching detection limits of 0.01 ng/mL (10 pg/mL) in human plasma, a level that is no longer sufficient for low dose contraceptives. Current MS systems, although more sensitive for analyte detection, are also more sensitive to background, contamination, and overall cleanliness of samples and solvents. This makes routine achievement of even previously reported detection limits heavily reliant on additional sample preparation. Sample preparation methods must not only perform a clean-up of endogenous plasma interferences, but also concentrate samples to meet challenging limits of detection. For example, current birth control formulations require methods capable of achieving detection limits in the single pg/mL range. For this application, a limit of detection (LOD) of 1 pg/mL was required. For such challenging assays, each aspect of the method must be carefully optimized, including sample preparation, chromatographic separation, and spectrometric detection. In this study, sensitive and selective methods for ethinylestradiol (see Figure 1 for chemical structures) in human plasma were developed and partially validated.
Column: |
ACQUITY UPLC HSS C18 SB, 2.1 x 100 mm, 1.8 μm |
Part #: |
186004119 |
Mobile Phase A: |
0.1% HCOOH in H2O |
Mobile Phase B: |
0.1% HCOOH in 80/20 Acetonitrile/2-Propanol (v/v) |
Flow Rate: |
0.4 mL/min |
Injection Volume: |
35.0 μL |
Injection Mode: |
Partial Loop |
Column Temperature: |
35 °C |
Sample Temperature: |
15 °C |
Strong Needle Wash: |
60:30:10 ACN:IPA:DMSO (v/v/v) + 2% conc. HCOOH (1000 μL) |
Weak Needle Wash: |
50/50 mobile phase A/ mobile phase B (v/v) (600 μL) |
Vials: |
Maximum Recovery |
Part #: |
600000670CV |
Time(min) |
Profile |
Curve |
|
%A |
%B |
||
0.0 |
40 |
60 |
6 |
1.0 |
40 |
60 |
6 |
5.0 |
10 |
90 |
6 |
6.0 |
10 |
90 |
6 |
10.0 |
10 |
90 |
6 |
10.2 |
40 |
60 |
6 |
12.0 |
40 |
60 |
6 |
Capillary Voltage: |
1.0 kV |
Desolvation Temp: |
550 °C |
Cone Gas Flow: |
150 L/Hr |
Desolvation Gas Flow: |
1000 L/Hr |
Collision Cell Pressure: |
2.6 x 10(-3) mbar |
MRM transitions monitored, ESI+: |
See Table 1 |
500 μL of human plasma containing EE and internal standard, estradiol d4, were extracted with 2 mL of 75/25 hexane/ethyl acetate (v/v) in 15 mL centrifuge tubes. Samples were capped, vortexed for 1 minute, and centrifuged for 5 minutes at 4000 rpm. A fixed volume of 1.5 mL of the resultant supernatant was transferred to a new 15 mL centrifuge tube and dried under nitrogen gas.
100 μL of 100 mM sodium bicarbonate (pH 11) was added to the centrifuge tubes containing the dried down supernatant, followed by 100 μL of 1 mg/mL dansyl chloride (DNSC) dissolved in acetone and then vortexed for 30 seconds. The extracts were transferred to Waters Maximum Recovery vials before being placed in a 60°C heating block for 10 minutes.
The derivatized extract was diluted with 400 μL of 4% phosphoric acid in water and loaded onto an Oasis MCX μElution 96-well plate that had been conditioned and equilibrated with 200 μL each of methanol and water. The plate was washed with 200 μL of 2% HCOOH in water, 200 μL of methanol, and 200 μL of 5% NH4OH in 50/50 acetonitrile/water (v/v) under vacuum. Samples were eluted with 2 x 25 μL of 5% NH4OH in 90/10 acetonitrile/2-propanolol (IPA) (v/v) and diluted with 25 μL of water. 35 μL of the diluted eluate was directly injected onto the UPLC-MS/MS system.
The choice of liquid-liquid extraction (LLE) solvent was based on EE extraction efficiency and overall extract cleanliness, which was assessed by comparing the remaining levels of residual phospholipids (PLs) after extraction. Many solvents and solvent mixtures were screened with these two goals in mind including hexane, methyl tert-butyl ether (MTBE), dichloromethane, cyclohexane, isoamyl alcohol, etc. The solvent mixture containing 75/25 hexane/ethyl acetate (v/v) gave the highest recovery of EE from human plasma (93%). Figure 2 demonstrates that in addition to high recovery, the best PL clean-up was also achieved using the 75/25 hexane/ethyl acetate (v/v) extraction solvent.
Although PLs are significantly reduced by careful choice of LLE solvent (Figure 2), there are still significant levels of PLs as well as additional plasma components, such as proteins, salts, formulation agents, and mobile phase modifiers, that remain in extracts after LLE. Phospholipids, as well as these additional interferences, contribute to poor robustness, matrix effects, divergent standard curves, and poor repeat analysis reproducibility. Removal of these interferences can be accomplished by a second clean-up step. This not only cleans up matrix components but also removes derivatization reaction mixture constituents. It is necessary to remove the reaction mixture components since they can precipitate on the LC column or in the MS source.
To assess the overall sample cleanliness after different levels of sample preparation, MS full scan mode was utilized from m/z 100 to 1000. The MS scan data shown in Figure 3 demonstrates the differences in the endogenous background present in the sample after LLE only compared to LLE followed by SPE. This shows a significant reduction in MS background when the additional mixed-mode SPE clean-up is performed after LLE. In Figure 3, a very high, broad background peak in the LLE only extract not only saturates the detector, but also co-elutes with EE, potentially causing significant and variable suppression or enhancement, which negatively impacts reproducible quantification. This background peak is eliminated when the LLE extract is further cleaned up by mixed mode SPE. Without the utilization of mixed-mode SPE clean-up, the background noise levels are too high to achieve a lower limit of detection (LOD) of 1 pg/mL for EE in human plasma.
The generic method for Oasis MCX provided high recovery (>85%), however, additional optimization was required to further clean-up plasma samples following LLE and derivatization and to accommodate the high organic composition of the sample prior to SPE. After derivatization, samples contain approximately 50% organic. The sample pre-treatment was optimized from a 1:1 dilution of the sample with 4% phosphoric acid (H3PO4) in H2O to a 2:1 dilution of the sample with 4% H3PO4 to further dilute organic content and improved initial retention on the SPE plate.
Optimization was also performed to remove or reduce derivatization buffers and residual matrix components. An additional wash step was needed following the 100% methanol wash. The additional step, 5% NH4OH in 50/50 acetonitrile/water (v/v), provided the release of components bound by ion exchange and reversed phase but elute in 50% or less acetonitrile. Because EE is very hydrophobic, it was still retained on the sorbent while interferences were washed to waste.
The final optimization step involved fine tuning the elution composition to efficiently elute EE while retaining plasma interferences, such as phospholipids, on the SPE device. Although phospholipids are hydrophobic in nature, they are preferentially soluble in more protic solvents, such as methanol, or mixtures of protic and aprotic solvents.[1] After testing 100% acetonitrile containing 5% NH4OH as the final elution solvent, poor recovery of ethinylestradiol was observed. It was hypothesized that the use of a small percentage of a more protic solvent might be necessary to fully elute EE. The final elution solvent chosen was 5% NH4OH in 90/10 acetonitrile/IPA (v/v). This mixture resulted in the full elution of EE from the SPE sorbent while eluting less PLs and other interferences that are more soluble in higher percentages of more protic solvents.
While the final elution composition was critical to selectively elute EE, the final elution volume was equally important. The final elution volume of 50 μL, the standard elution volume for a reduced bed format 96-well SPE plate, resulted in a 10-fold concentration of the 500 μL sample. This facilitated the achievement of the 0.001 ng/mL detection limit in human plasma.
Solvent standards of derivatized EE were injected onto several columns with different chemistries to demonstrate differences in selectivity and sensitivity. All column chemistries screened were 2.1 x 50 mm. The HSS C18 SB (a low coverage unendcapped C18) and BEH C18 columns produced the best peak shape and highest signal intensity. Analysis of plasma samples on 50 mm columns, however, led to multiple co-elutions and poor resolution of EE from other endogenous steroids. Therefore, longer columns were evaluated. Solvent standards and extracted plasma samples were then injected onto 2.1 x 100 mm columns containing the HSS C18 SB and BEH C18 stationary phases (Figure 4). Analysis on the HSS C18 SB column shows a 3.5-fold increase in signal intensity compared to the BEH C18 column for extracted plasma samples. This column choice is unusual for bioanalytical assays where the most common choice is an endcapped C18 column. Additional experiments confirmed improved resolution from residual matrix components using the HSS column.
Using an analog internal standard (estradiol d4), matrix factors were assessed in six sources of human plasma. Using the calculation for matrix factor found in regulatory guidelines[9], the matrix factors for EE in six sources of matrix were 1.13, 1.08, 1.18, 1.11, 1.11, and 1.23. The % CV was 4.84 among the six sources, which is well within the criteria of ≤15% specified by regulatory guidelines.
To further reinforce the choice of 2.1 x 100 mm column dimensions for this method, matrix factors were also assessed in the same six sources of human plasma on the 2.1 x 50 mm column of the same chemistry. The matrix factors for EE in the same six sources of matrix were 1.20, 1.33, 1.31, 1.38, 1.50, and 1.56, respectively. The % CV was 9.54 among the six sources of human plasma. The absolute value of the matrix factors, the % matrix effects, and % CV were significantly higher using the 2.1 x 50 mm dimensions compared to the 2.1 x 100 mm column that was chosen for this method (Table 2).
To assess accuracy and precision, standard curves were prepared from 0.001–1 ng/mL. Quality control (QC) samples were prepared at low, medium, and high concentrations: 0.003, 0.075, and 0.75 ng/mL, respectively.
As ethinylestradiol is a semi-synthetic form of estrogen, which is found in high and varying concentrations in females, the potential for interferences from female plasma can be significant. To minimize these possible interferences, only male human plasma was used for the standard curves and QC samples. Low levels of estrogen and similar hormones are also found in male plasma. For this reason, it is not surprising that the blank extracted plasma sample contained a small chromatographic peak at the same retention time as ethinylestradiol. The lowest limit of detection (LOD), which is the lowest concentration that provides a signal that is 3 times the level in the blank matrix, is 0.001 ng/mL (Figure 5).
Regression analysis of the data produced standard curves with an r2 value of 0.999 using a 1/x weighting. Table 3 summarizes the resultant QC data. The average % accuracy for the points on the standard curves is 99%. The average % accuracy for the QC samples is 96%. Table 4 summarizes some of the statistics for a representative standard curve from 0.001–1.000 ng/mL in human plasma.
A highly sensitive and robust UPLC-MS/MS method capable of detecting down to 1 pg/mL of ethinylestradiol in human plasma was developed and partially validated. A critical component of the method was the optimization of the sample preparation procedure, which includes LLE, derivatization, and mixed-mode SPE. The method shows significant promise for applications which require quantitation of ultra-low levels of EE in plasma samples, including biomarker studies. The average percent accuracy for EE was 99 % for standard curve samples and 96% for QC samples. The matrix factors for six different lots of human plasma varied by less than 5% using the described method. These values meet the FDA regulatory criteria for accuracy, precision, and selectivity for a bioanalytical method.
720004295, June 2012