• Application Note

High-Throughput Chemical Library Integrity Assessment using Waters UPLC Open Architecture System

High-Throughput Chemical Library Integrity Assessment using Waters UPLC Open Architecture System

  • Marian Twohig
  • Darcy Shave
  • Robert S. Plumb
  • Waters Corporation
Waters lab

Abstract

This application note describes the analysis of a 1536-well plate over the course of 32 hours of analyses. Injection-to-injection cycle times are considered as well as data stability. The Waters UPLC Open Architecture System was used for the analysis. This system integrates the Waters 2777c High PressureSample Manager platform with existing UPLC Technology.

Benefits

The Waters UPLC Open Architecture System with the high-pressure 2777c Sample Manager and OpenLynx Open Access software enables laboratories to analyze large numbers of samples with a cycle-time of 1 minute 15 seconds.

Introduction

Drug discovery laboratories commonly use high-throughput screening of compound libraries to rank lead candidates. Pharmaceutical companies frequently maintain and manage large collections of small molecules to cover a broad range of biological targets.1 Library compounds can degrade over long term storage2-3 making quality assessment important to ensure data from high-throughput screening assays are accurate.

LC-MS is employed extensively in drug discovery to perform quality control of these compound libraries. Purity can be determined simultaneously by UV and/or evaporative light scattering (ELS) detection. This process can be very time consuming due to long analysis times, and can potentially delay the progression of a drug through the discovery process. Consequently, sample throughput is a critical issue in moving compounds from hit to lead status.

This application note describes the analysis of a 1536-well plate over the course of 32 hours of analyses. Injection-to-injection cycle times are considered as well as data stability. The Waters UPLC Open Architecture System was used for the analysis. This system integrates the Waters 2777c High-Pressure Sample Manager platform with existing UPLC Technology.

Experimental

LC conditions

Solvent delivery:

Waters ACQUITY UPLC Binary Solvent Manager

Sample delivery:

Waters 2777c High Pressure Sample Manager

Column:

ACQUITY UPLC BEH C18 2.1 x 30 mm, 1.7 μm

Column temp.:

55 °C

Sample temp.:

Ambient

Injection volume:

2 μL

Flow rate:

1000 μL/min

Mobile phase A:

0.05% Formic acid in water

Mobile phase B:

0.05% Formic acid in acetonitrile

Gradient:

10 to 98 %B/0.70 min

Sample diluent:

DMSO

MS conditions

MS system:

Waters SQ Detector

Ionization mode:

ESI positive/ESI negative

Capillary voltage:

3.0 KV

Cone voltage:

30 V

Desolvation temp.:

450 °C

Desolvation gas:

1000 L/Hr

Source temp.:

150 °C

Acquisition range:

135 to 1000 amu

Scan speed:

10,000 amu/sec

Note: A low volume micro-tee was used to split the flow to the ELSD and SQD.

ELS conditions

Gain:

500

N2 gas pressure:

50 psi

Drift tube temp.:

50 °C

Sampling rate:

20 points/sec

PDA conditions

Range:

210 to 400 nm

Sampling rate:

20 points/sec

Results and Discussion

Sample analysis

Samples were analyzed by reversed-phase gradient UPLC at a flow rate of 1000 μL/min. The chromatographic peaks in the MS trace ranged from 1.73 to 2.26 seconds wide (measured at 10% peak height).

When analyzing the narrow peaks generated by a UPLC-MS system, the data collection rate can compromise the number of points across the LC peak, which can result in poor definition of the eluting peak. The high sampling rate of the SQ Detector overcomes these potential problems as it can collect data at elevated scan speeds. The utilization of high data-rate collection allows more individual acquisition modes to be used in one run, while maintaining adequate peak characterization.

Analysis of the number of points obtained across the five chromatographic peaks showed that an average of 7.7 points were collected (when measured at 10% of the peak height), even when positive/ negative ESI switching was used. This saves time as it reduces the need for an individual injection for each polarity.

The total cycle time of the method was 1 minute 15 seconds using a gradient time of 0.70 min, facilitating increased sample throughput. This allows four 384-well plates or one 1536 plate to be analyzed in 32 hours.

LC/UV/ELS-MS

Chromatograms illustrating the use of LC/PDA/ELS-MS are shown in Figure 2. Chromatographic peak widths of the ELS detection increased by 15% to 25% when compared with the PDA trace. This is partly attributed to the use of a low volume micro-tee after the PDA.

UPLC/PDA/ELS data with positive/negative ESI MS
Figure 2. UPLC/PDA/ELS data with positive/negative ESI MS.

ELS detection can complement UV detection by making it possible to detect compounds that do not have a chromophore. ELS detection works by measuring the light scattered from the solid solute particles remaining after nebulization and evaporation of the mobile phase. The signal from an ELS detector has been known to give rise to similar responses for related compounds and so can give a tentative estimation on the relative quantities of the components present.4

Data stability

The stability of the system was studied using the MS and UV detector responses. It is possible to superimpose the chromatogram recorded at 1 minute onto the chromatogram obtained at 32 hours. Figures 3 and 4 show the PDA and MS chromatograms from 1 minute and 32 hours. The vertical axes have been linked in both cases.

The % RSDs calculated for the retention times were found to be less than 5% for the QC compounds over 1536 injections. The resolution for the most closely spaced peaks (3 and 4 in Figure 2, Rs = 1.97) was constant over the course of the plate.

Superimposed chromatograms of five-compound mix
Figure 3. Superimposed chromatograms of five-compound mix: PDA chromatogram @ 254 nm for injection at 1 min (green trace) and injection at 32 hours (red trace).
 Superimposed chromatograms of five-compound mix
Figure 4. Superimposed chromatograms of five-compound mix: MS TIC chromatogram for injection at 1 min (green trace) and injection at 32 hours (red trace).

Sample submission and OpenLynx processing

The open platform autosampler was configured with a sample tray that had four plate positions. Samples were logged in using MassLynx Software’s OpenLynx Open Access Application Manager. A series of methods, each including gradient and MS conditions and processing parameters, are initially set up by the system administrator. The software prompts the chemist to enter information pertaining to the sample. The user chooses an appropriate method with the aid of specific questions aimed at enhancing method selection. Sample lists are imported and finally the user can place his or her sample(s) in the position allocated by the software.

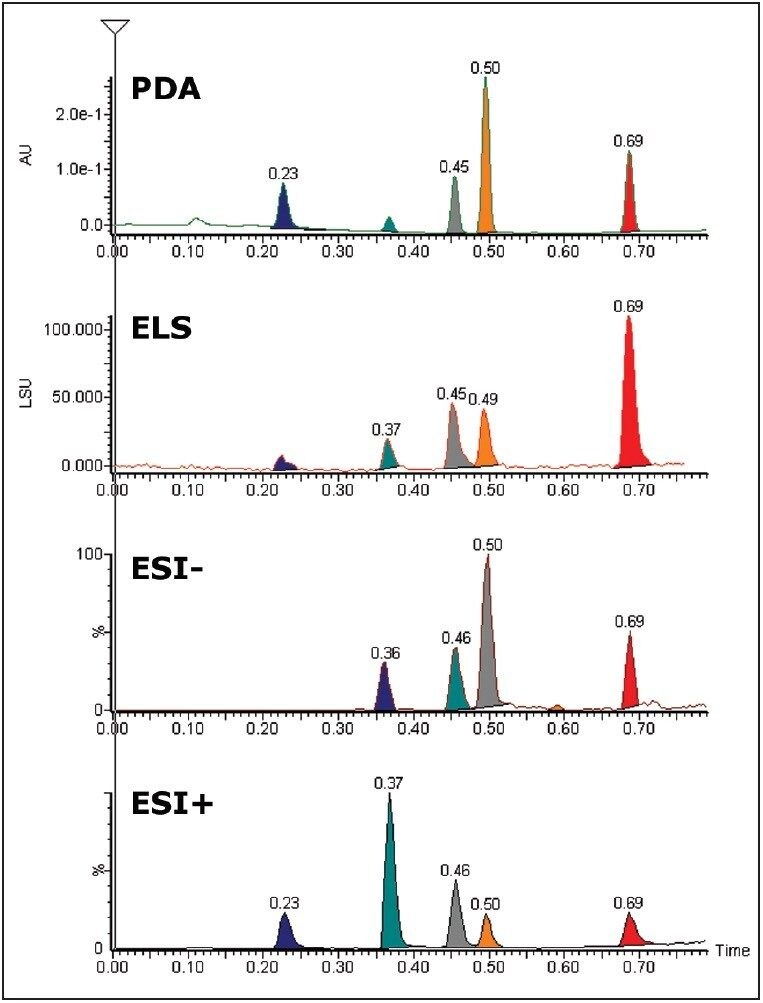
The desired sample analysis is then performed by the configured system, and data is automatically processed at the end of the batch. The software processes data from each MS function acquired as well as the auxiliary detectors. The report can be emailed, converted to PDF, or printed as desired.5,6

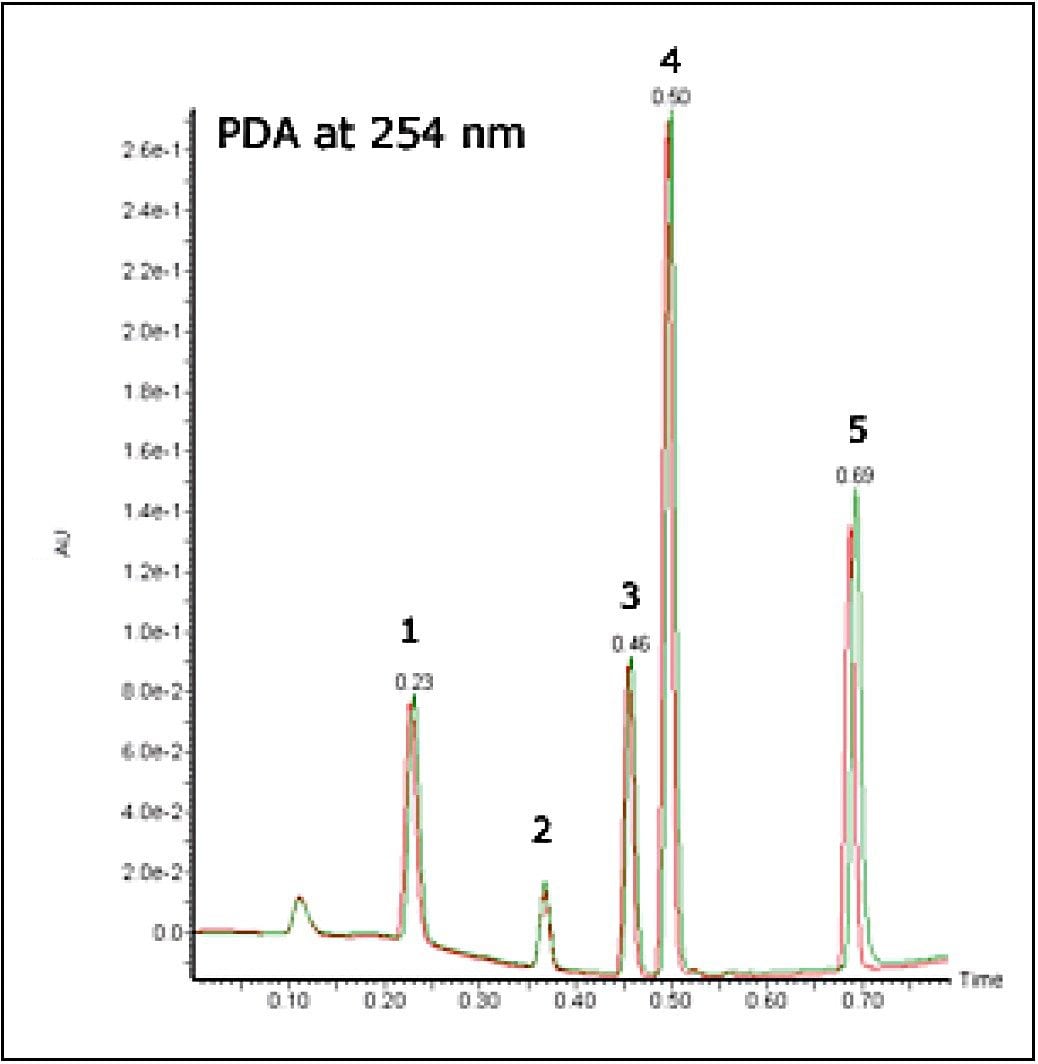
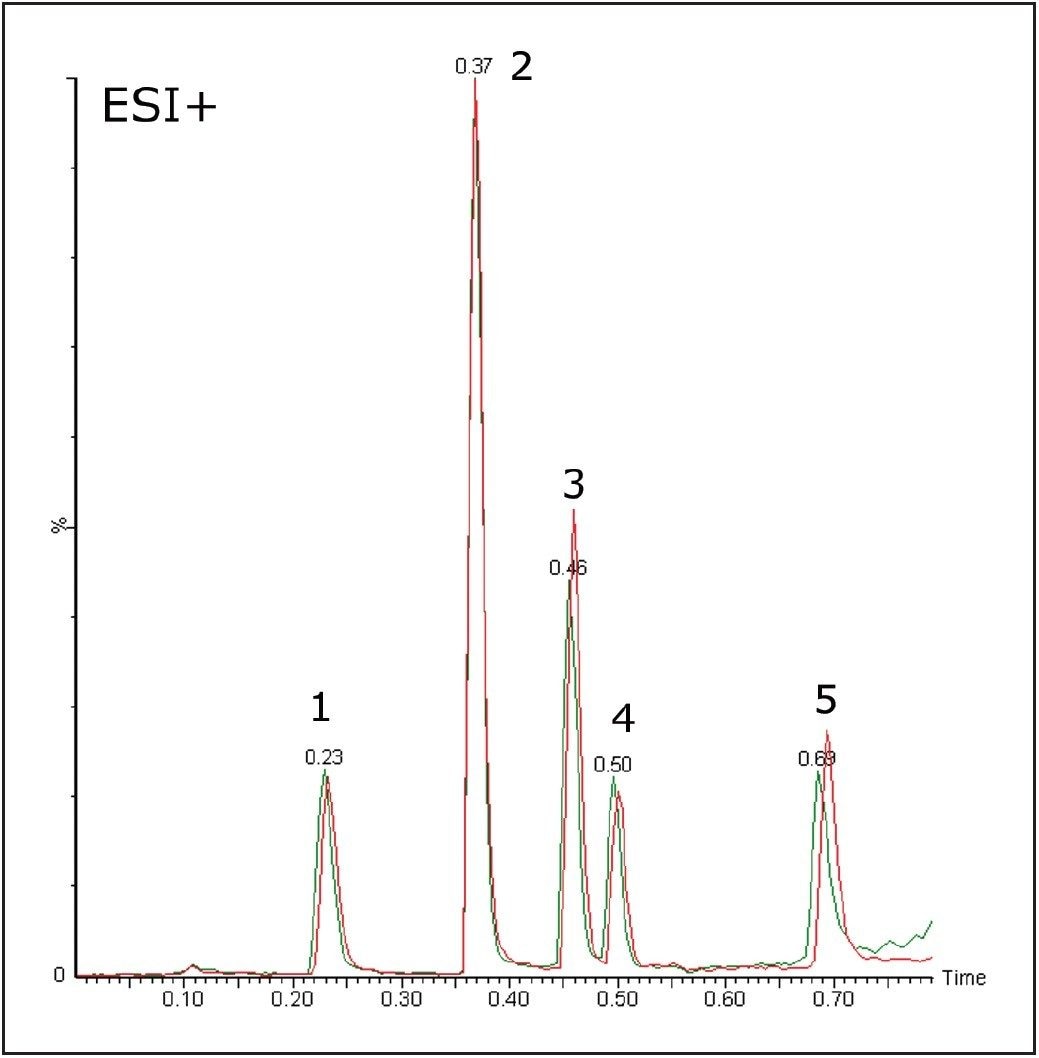
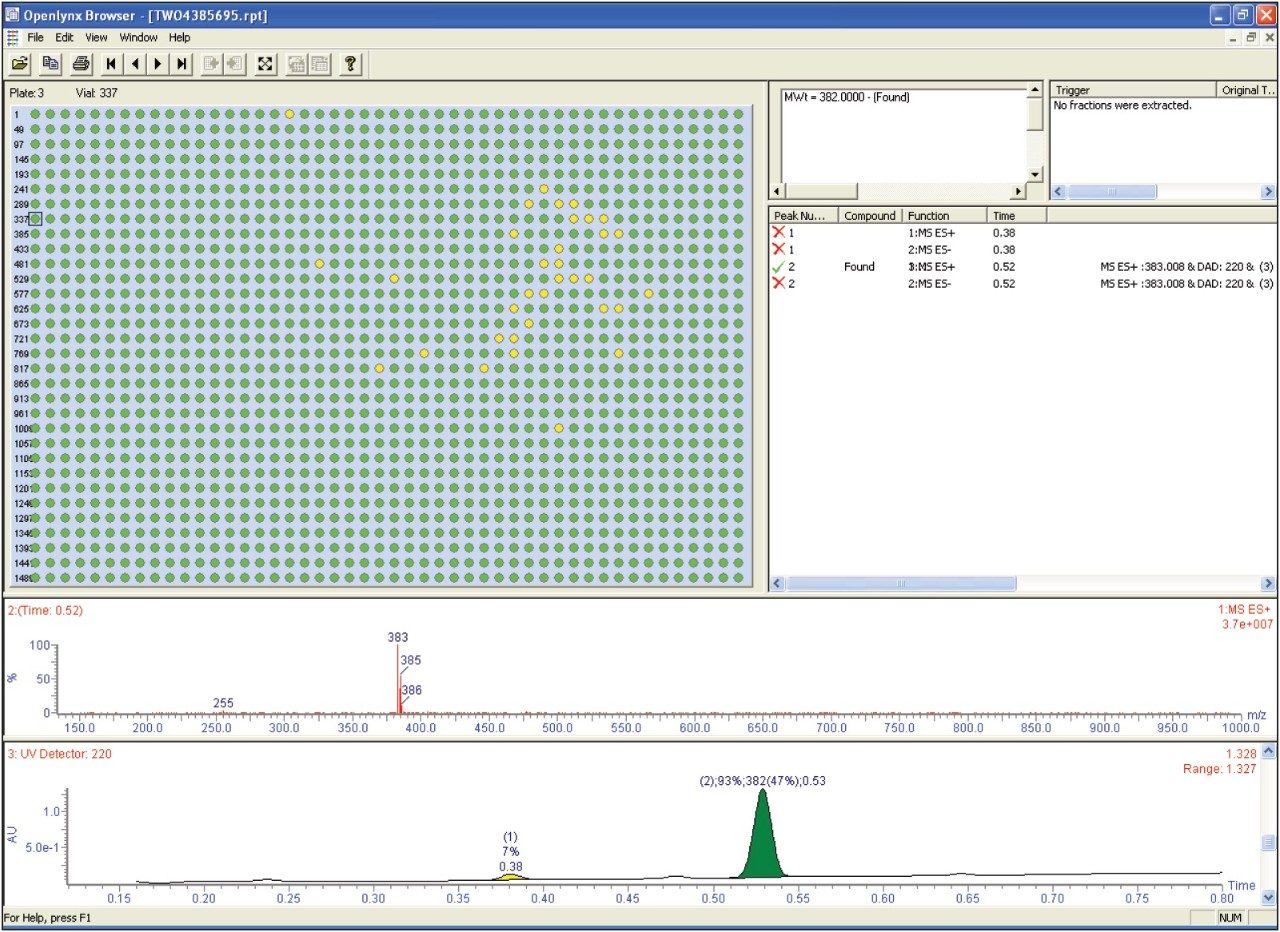
The browser presents a summary of the results as a color-coded (found/not found/tentative) map for clear interpretation of the results. Chromatograms, spectra, sample purity, peak height, peak area, retention time, and other information can easily be viewed by the browser. The OpenLynx browser shows the data from the 1536-well plate after it has been processed is shown in Figure 5. In the figure, green indicates found and yellow indicates tentative.

OpenLynx browser window after processing of the 1536-well plate
Figure 5. OpenLynx browser window after processing of the 1536-well plate.

Conclusion

In compound library quality control, the validity of high-throughput screening assays depends on the integrity of the compounds tested. Therefore, it is important to be able to rapidly obtain reliable data pertaining to the quality of the library compounds. The Waters UPLC Open Architecture System with the high-pressure 2777c Sample Manager and OpenLynx Open Access software enables laboratories to analyze large numbers of samples with a cycle-time of 1 minute 15 seconds.

The scan speed capabilities of the Waters ACQUITY SQD System with the SQ Detector make it possible to better characterize narrow chromatographic peaks. This has become a necessity since the advent of sub-2 μm column particle technology.

Multichannel LC-MS systems with multiplexed sources (MUX) have been used in many cases to improve sample throughput of assays requiring analysis by LC-MS. The increased resolution offered by columns packed with small particles, in addition to the pumps that are capable of functioning at higher operating pressures, make higher flow rates and shorter run times possible. This has allowed single-channel UPLC-MS systems with a single sprayer to provide throughput similar to that offered by MUX systems, with much less complexity in operation and maintenance – and better quality data.

The MS data provides valuable qualitative information relating to the compounds. Signals from auxiliary detectors such as PDA and ELS can be collected simultaneously. Together they can provide quantitative information relating to purity. Data can then be automatically processed and a summary report can be generated. Altogether, this enables compound library QC to be conducted with high confidence and high productivity.

References

  1. Lee MS. LC-MS Applications in Drug Development. Wiley-Interscience series on Mass Spectrometry. 2002; chapter 6: 96-106.
  2. Curr HK. The Significance of Effective Compound Management. Drug Discovery. 2003; 9: 9-10.
  3. Spencer PA. The Challenges of Managing a Compound Collection. Eur. Pharm. Rev. 2004; 9: 51-57.
  4. Kibbey, C.E. Mol. Diversity. 1995; I: 247-258.
  5. OpenLynx Application Manager: Quality Control Confidence for Open Access Systems. Waters Application Note. 2006; 720001464en.
  6. OpenLynx Toolkit for Open Access Systems. Waters Application Note. 2006; 720001469en.

720002902, January 2009

Back To Top Back To Top