Analysis of Subvisible and Visible Aggregation in Lentiviral Vectors with Aura GT System
Firstname Lastname1, Firstname Lastname2, Firstname Lastname3, Firstname Lastname3, Firstname Lastname4
Waters Corporation, United States
Published on June 09, 2026
This is an Application Brief and does not contain a detailed Experimental section.
Abstract
This application note demonstrates how Aura™ GT System requires as little as 5 µL of sample to quantitate and characterize visible and subvisible particles using backgrounded membrane imaging (BMI) and identify the biological and chemical nature of large lentiviral aggregates using fluorescence membrane microscopy (FMM).
Introduction
Third-generation lentiviral vectors (LVVs) are promising nucleic acid delivery vehicles for cell and gene therapies.1 Their low immunogenicity, large genetic payloads, ability to target dividing and non-dividing cells, and stable integration into the host cell genome make them an ideal gene delivery candidate.2–4 However, LVVs are more complex biomolecules compared to standard protein biologics. They are comprised of a lipid envelope, surface proteins, and nucleic acid material – all of which present challenges for physical and chemical stability. They are also harder and more expensive to manufacture compared to protein biologics. The scarcity of LVV material makes scale-up difficult and adds additional complexity when qualifying subvisible particles, the most indicative critical quality attribute for biologic stability. In addition to being biologically heterogeneous, the average size of the monomeric lipid envelope is approximately 100 nm, making it more difficult to analyze a single LVV because it is approximately 1000 times larger than a monomeric IgG peptide by volume.5
In this application note, it shows how Aura GT System requires as little as 5 µL of sample to quantitate and characterize visible and subvisible particles using BMI and to identify the biological and chemical nature of large lentiviral aggregates using FMM.
Experimental
Three different lentiviral vector drug product candidates were obtained from commercial sources and named Sample 1, 2, and 3 for the purposes of this application note. Samples were analyzed using Aura GT System where wells on a black membrane plate were first imaged to obtain a background image. 20 µL of Samples 1, 2, and 3 were subsequently loaded onto the plate before the plate was re-imaged using BMI. The collected images were processed with the Particle Vue™ Software, which utilizes Waters proprietary image analysis algorithm for accurate analysis. The samples were subsequently stained with both SYBR™ Gold (Thermo Fisher, S11494), a fluorescent label that specifically interacts with nucleic acid, and thioflavin-T (ThT) (Sigma-Aldrich, T3516), a fluorescent general protein stain, before the plate was re-imaged using FMM to differentiate between protein-containing aggregates and those which also contained nucleic acid.6,7 Learn more details about these fluorescent staining workflows and applications they support in Waters application notes, "Rapidly Distinguish Protein from Non-Protein Particles in Biologic Formulations".6,7 and "AAV Aggregate Quantitation and Identification with the Aura System".
Results and Discussion
Lentiviral Vector Product Stability Assessment
Images presented in Figure 1 for Samples 1, 2, and 3 were obtained using BMI imaging. From this data, this can qualitatively conclude that there are fewer subvisible particles in Sample 1, a larger number of bigger particles in Sample 2, and an intermediate distribution of smaller particles in Sample 3. This indicates that Sample 1 is the most stable LVV, Sample 3 is the next most stable LVV, and Sample 2 is the least stable of the three.
Particle Vue Software automatically characterizes and quantifies the particles observed in Figure 1. This provides detailed information on several morphological parameters, the most important of which is size, as larger particle sizes are predictive of product instability.
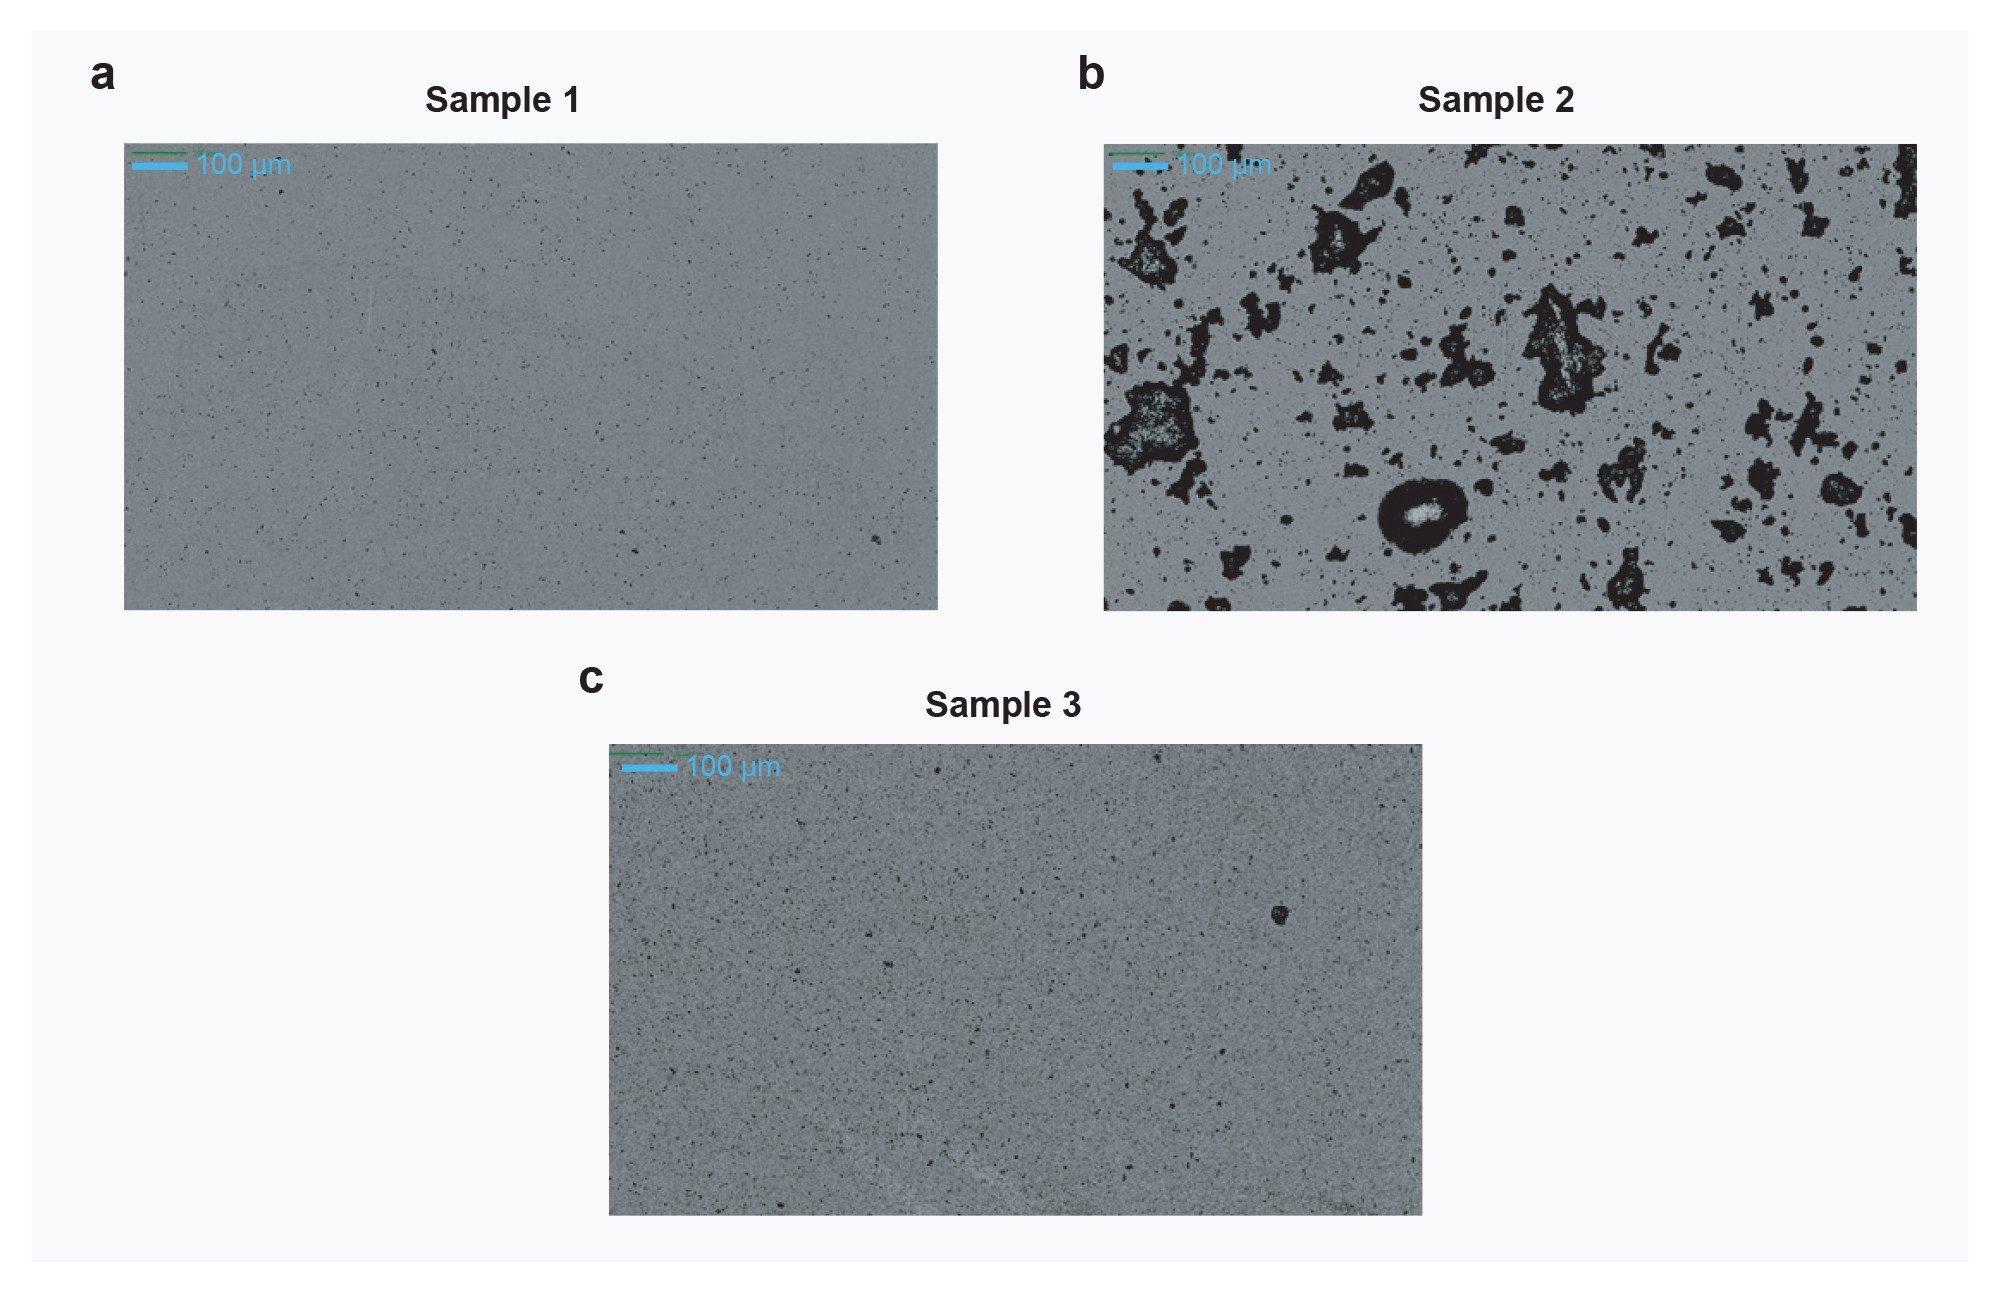
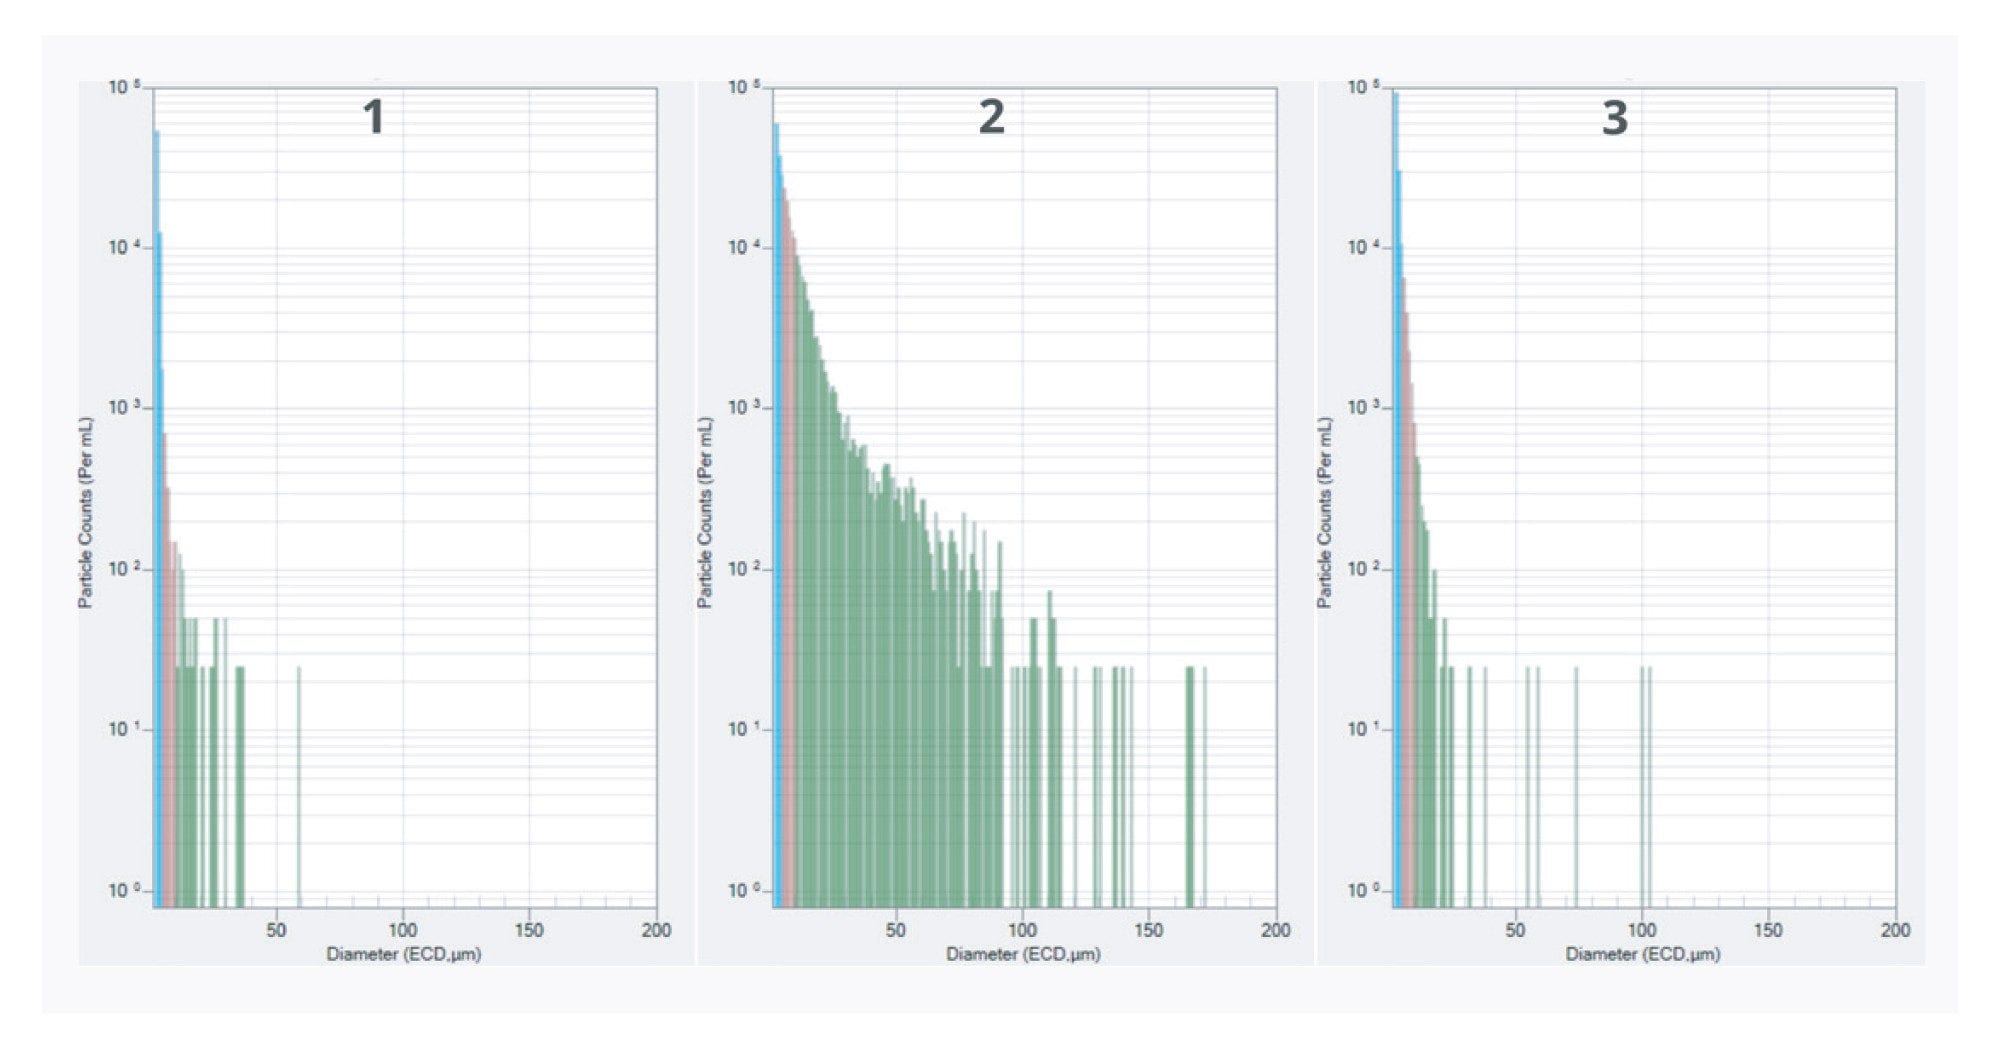
Figure 2 explores the particle size distributions for these LVV samples. There are no visible particles in Sample 1 (i.e., visible particles >100 µm in diameter), which is also the sample that displays the smallest size distribution of all three samples. Sample 3 mostly shows particles <20 µm in size, but with a few large particles. Sample 2 presents the most particles per mL and the largest particle size distribution, with hundreds of visible particles per mL, and thousands of particles per mL for every bin below 25 µm. In fact, Sample 2 has over 310,000 particles/mL larger than 10 µm in diameter. The presence of thousands of large subvisible and visible particles in a sample, as observed with Sample 2, is a red flag for product stability and a potential safety hazard for patients.
Root Cause Analysis for Lentiviral Vector Aggregation and Instability
Aura GT System allows users to easily delve deeper into understanding the nature of these large particles using FMM with commercially available dyes. As described in the methods, SYBR Gold was used to assess if the measured subvisible particles contain nucleic acid material. This identifies these large particles as lentiviral aggregates and not another source of aggregation, such as contamination from the vial itself in the form of large extrinsic glass or plastic particles.
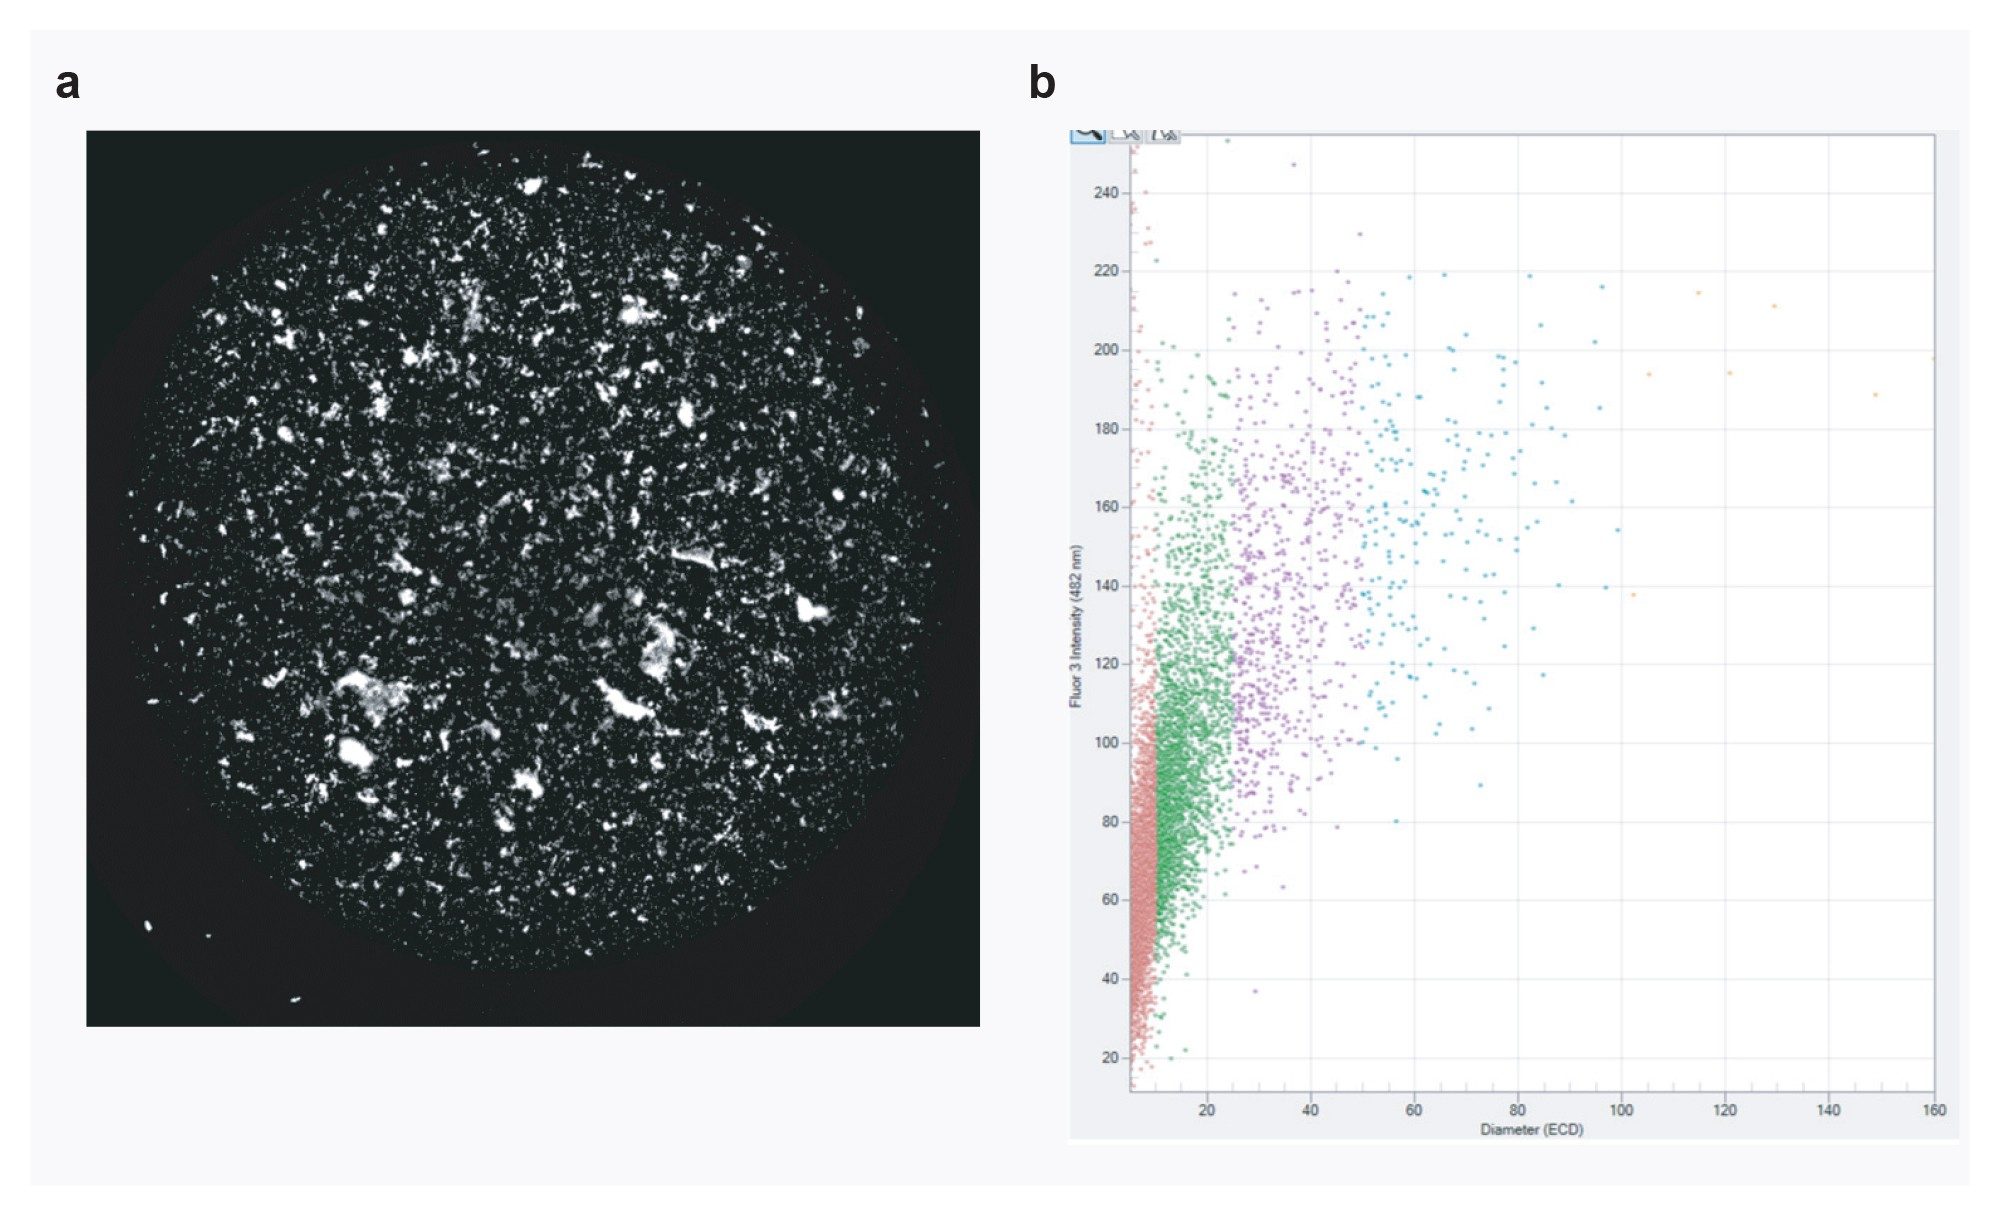
Figure 3a shows the whole well fluorescence image for Sample 2, displaying bright SYBR Gold fluorescence to specifically ID aggregation due to LVV instability. The data was then analyzed using Particle Vue Software to plot the SYBR Gold fluorescence intensity of each particle vs. the particle size, as shown in Figure 3b. The substantial number of particles that have a fluorescence signal indicates a significant presence of nucleic acid in the measured particles.
Conclusion
There were significant differences in the aggregation profiles between the three commercially sourced LVV drug products analyzed. Sample 1 did not display significant subvisible particle formation and is the most stable of the three. Sample 3 was the median but still showed the presence of some visible particle formation, significant enough that it may struggle to meet USP release criteria. Sample 2 showed hundreds of thousands of particles/mL >10 µm, which is far above the USP guidelines for release and therefore would require significant formulation efforts to stabilize. Further analysis of Sample 2 using FMM revealed that a large fraction of these aggregates are positive for SYBR Gold staining, denoting the presence of nucleic acid in these aggregates. This indicates an unstable LVV capsid that is leaking nucleic acid into the formulation creating a nucleation site for aggregation.
The formulation and process development of viral vectors are more challenging and not as well defined compared to protein biologics, due to a combination of their complex biological nature and because they are a novel therapeutic modality. LVVs are a nascent and less established technology. Thus, new developers and formulators are undergoing the same pitfalls that befell the protein therapeutic developers several decades ago. As with traditional protein biologics, some samples are easier to formulate than others, and proper particle control strategies need to be employed from the beginning of the process to ensure the development of safe, stable, and effective LVV therapeutics. Work previously done in the protein therapeutic space has established how critical it is to understand the stability and purity of a drug product throughout the entire development process. With Aura GT System, LVV formulation analysis can be achieved quickly and economically using only 5 µL of sample to obtain images, particle counts, size distributions, and identity, and only requires one minute to image each sample. This critical subvisible and visible particle information helps with the complete characterization of LVV stability. Whether LVV is used as starting material for cell therapies or directly as APIs, sample stability is maintained throughout the development pipeline.
References
- Gándara C; Affleck V; and Stoll EA. (2018). Manufacture of Third Generation Lentivirus for Preclinical Use, with Process Development Considerations for Translation to Good Manufacturing Practice. Hum Gene Ther Methods. 29(1):1–15.
- Milone MC; O’Doherty U. (2018). Clinical use of lentiviral vectors. Leukemia. 32(7):1529–1541.
- Stripecke R; et al. (2003). The use of lentiviral vectors in gene therapy of leukemia: combinatorial gene delivery of immunomodulators into leukemia cells by state-of-the-art vectors. Blood Cells Mol Dis. 31:28–37.
- Jarraya B; et al. (2009). Dopamine gene therapy for Parkinson’s disease in a nonhuman primate without associated dyskinesia. Sci Transl Med. 1(2):2ra4.
- Crespo-Barreda A; et al. (2016). Chapter 11 - Viral and Nonviral Vectors for In Vivo and Ex Vivo Gene Therapies. Translating Regenerative Medicine to the Clinic. 155–177.
- Rapidly Distinguish Protein from Non-Protein Particles in Biologic Formulations. (2025), Waters Application Note. 720009101.
- AAV Aggregate Quantitation and Identification with the Aura System. (2025), Waters Application Note. 720009095.
Featured Products
720009419, June 2026