• Application Note

Modernization and Troubleshooting of the USP Organic Impurity Method for Cetirizine Hydrochloride Tablets: Demonstration of XBridge HILIC Robustness Capabilities Across HPLC and UHPLC Instruments

Modernization and Troubleshooting of the USP Organic Impurity Method for Cetirizine Hydrochloride Tablets: Demonstration of XBridge HILIC Robustness Capabilities Across HPLC and UHPLC Instruments

  • Jyotsna Sehajpal
  • Jacob N. Fairchild
  • Waters Corporation

Abstract

A modernized version of the USP method for organic impurities in cetirizine HCl tablets has been demonstrated on four different LC systems from two different vendors. Similar results were obtained on the HPLC and UHPLC systems used. These experiments were all performed using the same XBridge HILIC Column, providing confidence that validated methods can be successfully transferred between different LC systems.

Benefits

  • Modernization of the USP method for analysis of organic impurities in cetirizine hydrochloride tablets
  • Utilizing an XBridge HILIC Column on instruments from different vendors, highlighting the robustness of the XBridge HILIC chemistry
  • Tips on how to troubleshoot distorted peak shapes

Introduction

Cetirizine is a second-generation antihistamine that is used in the treatment of hay fever, urticaria, angioedema, and allergies. The USP method for organic impurities in cetirizine hydrochloride tablets specifies the use of a 4.0 x 250 mm, 5 μm L3 column (porous silica particles, 1.5 μm–10 μm diameter, or a monolithic rod).1 Permissible alterations are given in USP General Chapter <621>, according to which, for isocratic methods, particle size (dp) and/or column length (L) can be changed as long as the ratio of column length to particle size (L/dp) remains constant or within the range -25% to +50% of the original column specified. Alternatively, other combinations of L and dp may be employed provided the number of theoretical plates (N) is within the range -25% to +50% of the original column specified in the method.2

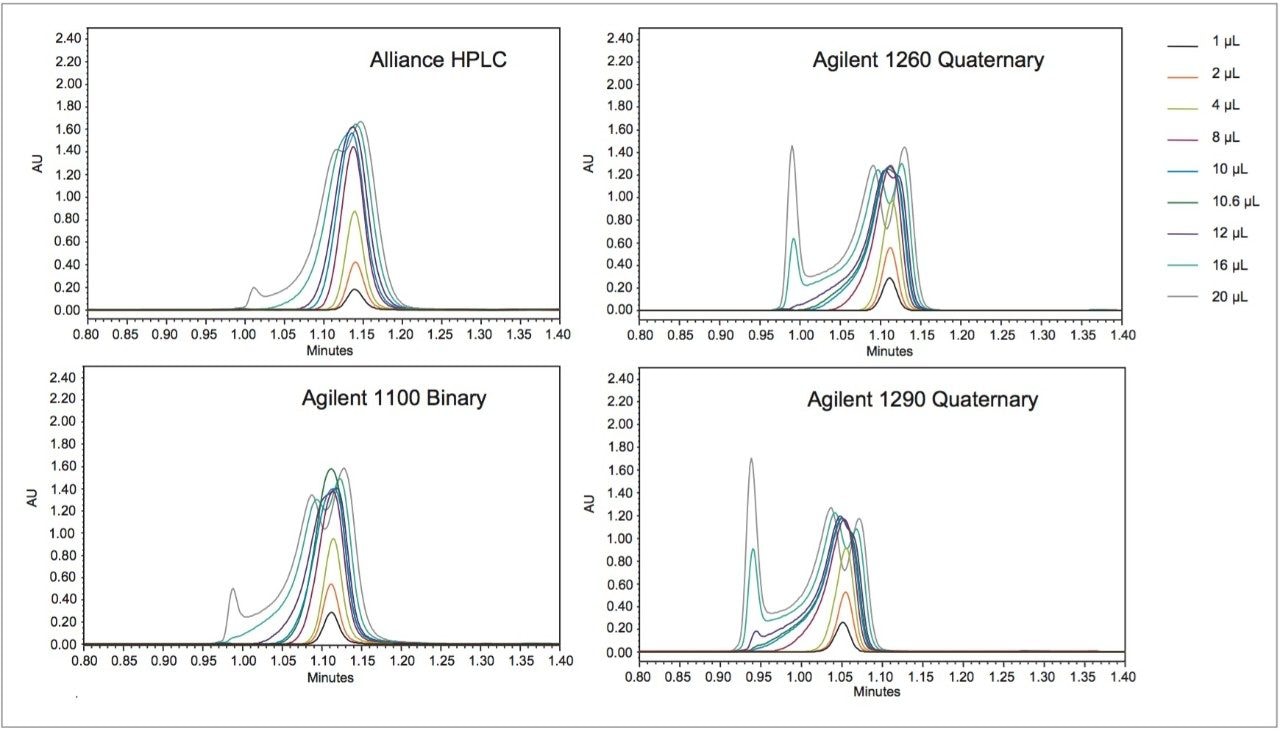
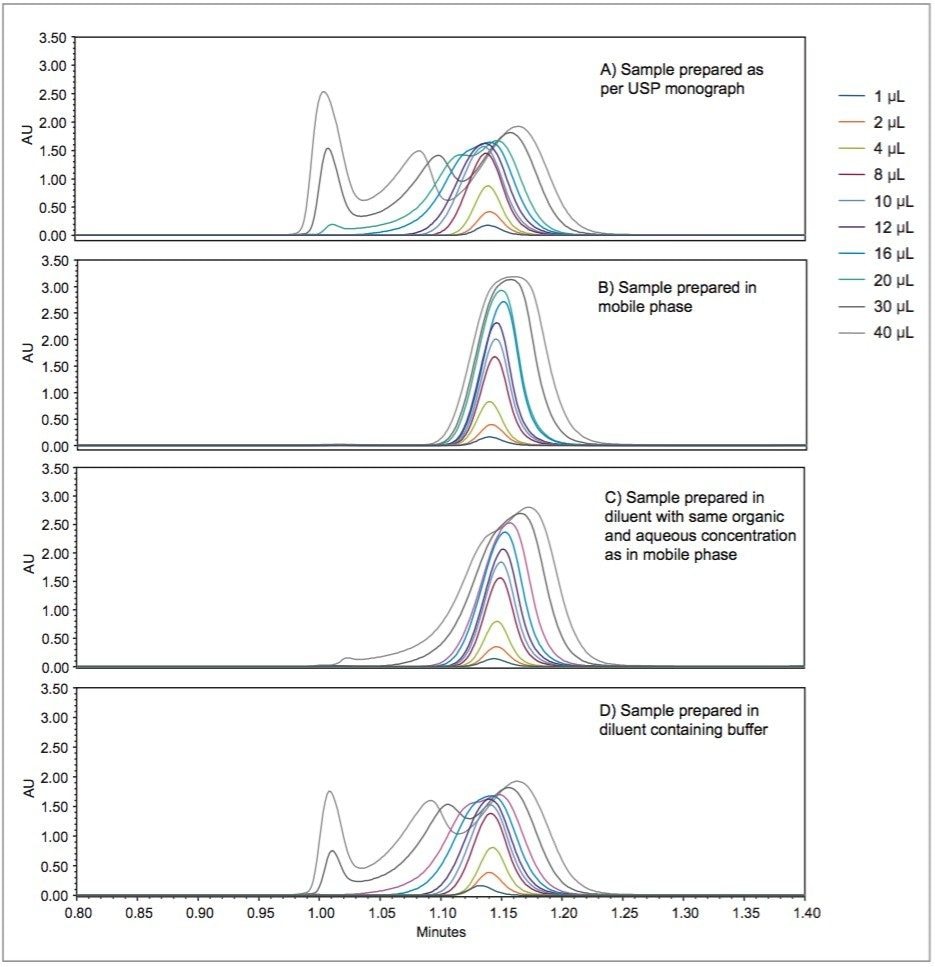
Hence, an existing USP method can be modernized by using newer column chemistries without the need to revalidate the method. Columns containing smaller particles substantially reduce analysis times without compromising the quality of the data, when the flow rate is scaled accordingly. The organic impurity method for cetirizine hydrochloride tablets has been updated by using an XBridge HILIC XP, 2.5 μm, 4.6 x 100 mm Column (p/n: 186006087).3 The USP allowable changes reduced the analysis time by a factor of 5 (from 15 minutes to 3 minutes) and improved the peak shape for cetirizine HCl. The peak shape improvement was due to injecting a scaled, smaller injection volume, which mitigated much of the peak distortion caused by the sample diluent. Further evidence of sample diluent induced peak distortion will be presented in this work.

Also Run On:
Agilent 1100 Binary System
Agilent 1260 Infinity Quaternary System
Agilent 1290 Infinity Quaternary System

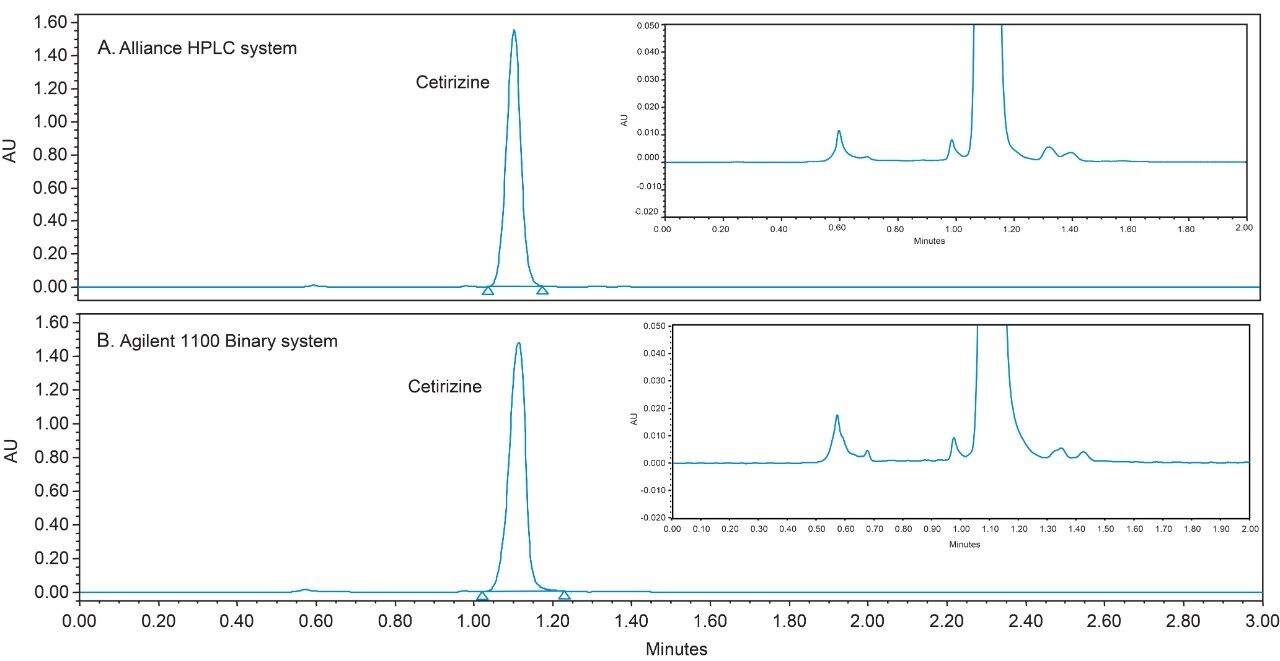
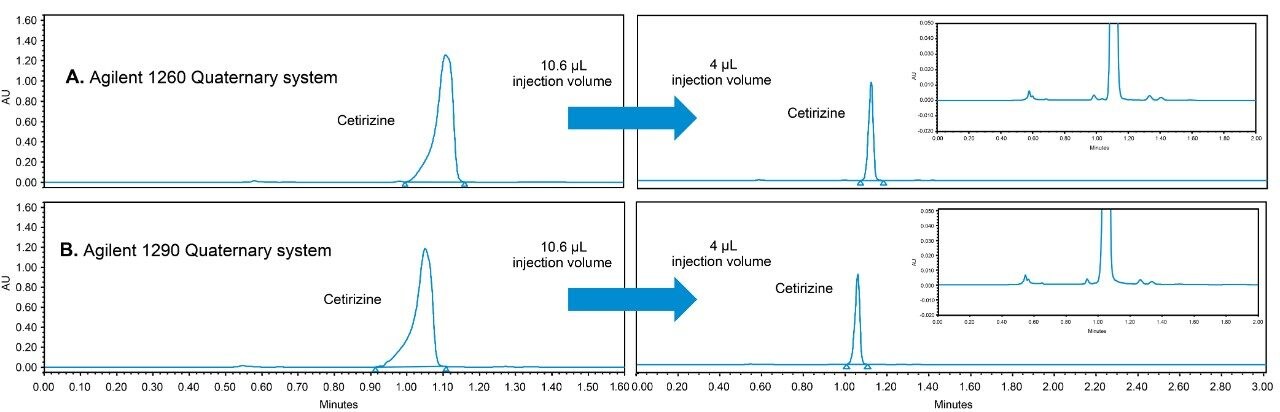
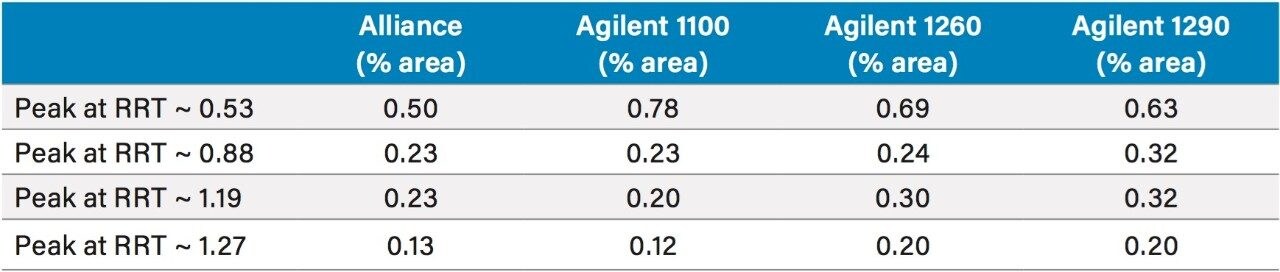
USP methods are validated and are generally accepted to work on any properly functioning LC system. However, few examples of successful HILIC transfers between systems from different vendors have been shown. The same HILIC method and column were tested on four different LC systems, from Waters (Alliance HPLC System) and Agilent (1100 Binary HPLC System, 1260 Infinity Quaternary UHPLC System and 1290 Infinity Quaternary UHPLC System), each controlled by Empower CDS. The particular method used required some investigation, in which a key obstacle was overcome to achieve undistorted peaks.

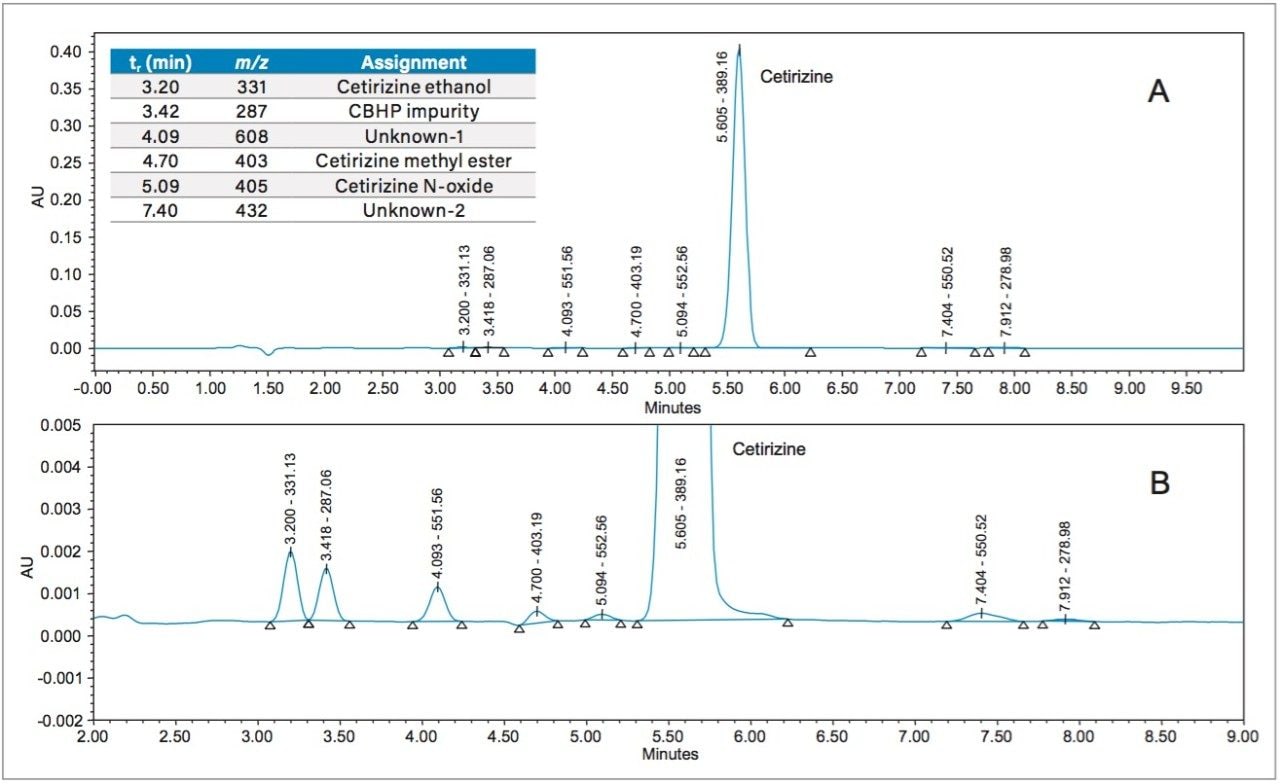
The method was then modified using a MS-compatible mobile phase to demonstrate the feasibility of further modernizing the method.

Experimental

Sample description and preparation (for modernization of the USP method)

Generic cetirizine tablets (10 mg) were used in this study and were prepared as per the USP cetirizine hydrochloride tablets organic impurity method. Five tablets were crushed and the powder was transferred to a 100 mL volumetric flask containing about 50 mL of diluent (910:27:63 acetonitrile: solution A [2:33 2 N sulfuric acid: water]: water), sonicated for about 20 minutes and diluted to the volume mark with diluent, to get a concentration of 0.5 mg/mL. The sample was filtered with a 0.45 μm GHP Acrodisc filter into LCMS Certified Vials.

Sample preparation (for troubleshooting the USP method)

To troubleshoot the poor peak shape observed when carrying out the USP method, the sample was prepared in three different diluents, listed below. Five cetirizine hydrochloride (10 mg) tablets were crushed and the powder was transferred to a 100 mL volumetric flask for each preparation. About 50 mL of diluent was added to each and the flask was sonicated for about 20 minutes. The solutions were diluted to the volume mark with diluent, to arrive at a concentration of 0.5 mg/mL, and mixed well. Before injecting in the LC system the sample was filtered with a 0.45 μm GHP Acrodisc filter into LCMS Certified Vials.

Samples were prepared in three different diluents as follows

  1. The prescribed mobile phase: The mobile phase specified in the USP method is 93:5:2 acetonitrile: solution A: buffer (tetrabutyl ammonium hydrogen sulfate solution), giving an organic to aqueous ratio of 93:7.
  2. Matching the mobile phase organic/aqueous content, absent the buffer: The prescribed diluent was modified to match the organic and aqueous concentrations of the mobile phase (93:7), but contained no buffer: 93:2.7:4.3 acetonitrile: solution A: water.
  3. The prescribed diluent with buffer instead of water: The buffer solution was added instead of water to the diluent to match the pH of the diluent to the mobile phase: 91:2.7:6.3 acetonitrile: solution A: buffer. This diluent has an organic to aqueous ratio of 91:9, which is the ratio specified in the USP method.

Sample preparation (for the MS method)

Five cetirizine hydrochloride tablets were crushed and the powder was transferred to a 100 mL volumetric flask. About 50 mL of mobile phase (93:7 acetonitrile: 200 mM ammonium formate buffer) was added and the flask was sonicated for about 20 minutes. The solution was diluted to volume with mobile phase to get a concentration of 0.5 mg/mL and mixed well. Before injecting the sample, the sample solution was filtered through a 0.45 μm GHP Acrodisc filter into LCMS Certified Vials.

LC conditions

LC systems:

Alliance HPLC System with 2489 UV/Visible Detector

Agilent 1100 Binary LC System with Agilent 1100 DAD Detector

Agilent 1260 Infinity Quaternary LC System with Agilent 1260 DAD Detector

Agilent 1290 Infinity Quaternary LC System with Agilent 1290 DAD Detector

Column:

XBridge HILIC XP, 2.5 μm, 4.6 x 100 mm

(p/n: 186006087)

Column temp.:

25 °C

Injection volume:

10.6 μL

Flow rate:

2.116 mL/min

Separation mode:

Isocratic

Solution A:

2:33 2 N sulfuric acid: water

Buffer solution:

3.4 g/L tetrabutyl ammonium hydrogen sulfate in water

Mobile phase:

93:5:2 acetonitrile: solution A: buffer solution

LC conditions (for the MS method)

LC system:

Alliance e2695 HPLC

Column temp.:

25 °C

Injection volume:

4 μL

Flow rate:

1.0 mL/min

Mobile phase:

93:7 acetonitrile: 200 mM ammonium formate buffer (pH 2.9, adjusted with formic acid)

Mass spectrometer:

ACQUITY QDa

Vials:

LCMS Certified – clear, preslit (p/n: 600000668CV)

Data management

Empower 3 CDS

Results and Discussion

Results obtained using different instruments

The USP organic impurities method for cetirizine hydrochloride was scaled down from a 4.0 x 250 mm, 5 μm to a 4.6 x 100 mm, 2.5 μm column using conditions obtained from the Waters’ column calculator and run on an Alliance e2695 HPLC System with a 2489 UV/Visible Detector. The USP system suitability criteria of tailing factor NMT 2.0 and relative standard deviation (RSD) NMT 10.0% were met. Average USP tailing for six replicate injections of cetirizine was 1.3 and % RSD was found to be 0.8% for peak area.

The same mobile phase, column, and sample were used on four different LC systems with various injection volumes. According to USP guidelines, the injection volume can be adjusted, provided all the required criteria are met. In this case, sufficient sensitivity of organic impurities is necessary.4 The results obtained were reproducible on the HPLC instruments as shown in Figure 1 and on the UHPLC instruments as shown in Figure 2. The smaller impurity peaks observed were also reproducible and the % areas were comparable on each instrument as shown in Table 1. As expected, the retention times are comparable, with some variation, likely due to system volume differences or other effects. For the scaled injection volume (10.6 μL injected; USP method calls for 20 μL), the peak shape for cetirizine is noticeably different on each system. The peak fronting is most noticeable on the Agilent 1260 and Agilent 1290 UHPLC systems, but improved peak shapes are observed at a lower injection volume (4 μL), as shown in Figure 2. This is because these two systems, as configured, have the lowest dispersion of the four systems tested. The relatively larger dispersion of the Agilent 1100 and Waters Alliance HPLC Systems mitigate some of the peak distortion by reducing the strong solvent effects, i.e. mixing the injected sample plug with the mobile phase before the column inlet. In fact, adding additional tubing volume between the injector and column inlet has been demonstrated as a tactic to mitigate strong solvent effects in liquid chromatography, but at the cost of apparent column efficiency.5 Increasing injection volumes are compared in Figure 3 for each LC system used. In all cases, the lowest injection volume, 1 μL, shows very good peak shape, which becomes distorted as the injection volume increases. As the injection volume is increased above 4 μL (for example 8, 10, 10.6, 12 μL…), the peak for cetirizine begins to front significantly and even split into two or three peaks. With the given method, adjusting the injection volume would be necessary to observe acceptable peak shape on each instrument, but success can be achieved nonetheless. 

Figure 1. Chromatograms obtained for a scaled USP method using an XBridge HILIC XP 2.5 μm, 4.6 x 100 mm Column on HPLC instruments from different vendors. These injections were done using the 10.6 μL injection volume. The inset chromatogram is zoomed in to show smaller impurity peaks.
Figure 2. Chromatograms obtained for a scaled USP method using a XBridge HILIC 2.5 μm, 4.6 x 100 mm Column on UHPLC instruments. The distorted peak shape for 10.6 μL injection volume is due to a combination of the lower dispersion of the UHPLC systems and an excessive injection volume, which is corrected by lowering the injection volume (from 10.6 μL to 4 μL), shown on the right-hand side of the figure. The inset chromatograms are zoomed in to show the smaller impurity peaks for the 4 μL injections.
Table 1. Peak area percentages for smaller peaks observed on each system. Alliance and Agilent 1100 HPLC systems with 10.6 μL injection volume and Agilent 1260, Agilent 1290 UHPLC systems with 4 μL injection volume. The RRT values are the retention times relative to cetirizine.
Figure 3. Chromatograms obtained using a series of injection volumes on different instruments demonstrating the change in peak shape as the injection volume increases.

Addressing The Sample Solvent Effect

To further investigate the peak distortion observed, the sample was prepared in the USP specified mobile phase, which consisted of 93% acetonitrile and 7% aqueous solution. The sample prepared using mobile phase as the solvent was injected at volumes of 1, 2, 4, 8, 10, 10.6, 12, 16, and 20, 30, and 40 μL. In all cases, dissolving cetirizine in the mobile phase produced ideal, Gaussian peak shapes, the peak height and width growing proportionally, even at the highest injection volumes, until the UV detector signal was saturated (demonstrated on Alliance HPLC System in Figure 4B). This led to the following two hypotheses for the cause of the observed peak distortion:

  1.  An imbalance of organic and aqueous concentration between the mobile phase and sample solvent (classic strong solvent effect).
  2. The presence of buffer (tetrabutyl ammonium sulfate) in the mobile phase, but not in the sample solvent, causing a pH mismatch.
To test the first hypothesis, the organic and aqueous concentrations of the sample solvent were matched to that of the mobile phase. The original solvent consisted of 91% acetonitrile and 9% acidified water. For this experiment, the acetonitrile content was increased to 93% and the acidified water content was decreased to 7%, matching the organic and aqueous concentrations in the mobile phase. The sample was prepared in this new solvent and injected in the range of injection volumes listed in the previous section. A significant improvement in peak symmetry was observed when the aqueous content was matched between sample diluent and mobile phase. Some very slight peak distortion was observed at 30 μL compared with that observed in the original method (Figure 4C), which may be due to the absence of buffer in the diluent. The extremely distorted peak profile in the highest injection volumes is rather unusual and is probably related to the propagation speed of strong solvent through the column.
 
To test the second hypothesis, the 6.7% water present in the original diluent was replaced by 6.7% buffer, as in the mobile phase. A sample was prepared in this new solvent and the series of injection volumes mentioned above was carried out. The peak distortion seen was similar to, but slightly better than, that observed in the original chromatograms (Figure 4D), the peak distorting significantly at an injection volume of 20 μL instead of 16 μL (as seen in the original method).
Figure 4. Chromatograms obtained for a series of injection volumes using a sample prepared as per USP monograph (9% water in diluent) with peak distortion starting at 16 μL (A), sample prepared in mobile phase with no peak distortion (B), sample prepared in diluent with same organic and aqueous (7% water in diluent) concentration as in the mobile phase where peak distortion starts at 30 μL (C), and sample prepared with diluent containing buffer (9% water in diluent) with peak distortion starting at 20 μL injection volume (D).

These experiments lead us to conclude that the distortions in peak shape observed are due mostly to the imbalance between the organic and aqueous concentrations in the mobile phase and sample solvent, causing an obviously strong solvent effect. The absence of buffer appears to have only a minor effect, slightly distorting the peak of cetirizine. Matching both the aqueous content and the buffer concentration in combination helps in obtaining a Gaussian peak at all injection volumes, hence the exceptional results when dissolving the sample in the mobile phase.

Adding Mass Detection to an LC-MS Method

Finally, some experimental proof was generated to transfer the USP method, which utilizes tetrabutyl ammonium hydrogen sulfate as buffer, to a MS compatible buffer, ammonium formate (pH 2.9, adjusted with formic acid). The use of MS detection can improve the quality of data collected (confirmation of cetirizine and impurities by mass and peak purity). The same XBridge HILIC XP, 2.5 μm, 4.6 x 100 mm Column (p/n: 186006087) used in the previous sections was used in these experiments. The flow rate was reduced from 2.116 mL/min to 1 mL/min to accommodate the ESI interface, which results in longer separation time. In some cases, it may be advantageous to redevelop an LC method using another mode of chromatography, such as reversed-phase; however, we elected to maintain a HILIC method to demonstrate transfer of the method to a MS-compatible mobile phase on the same chromatographic system without the need to change the column.

The sample was prepared in mobile phase, the best practice to achieve undistorted peaks, and an ACQUITY QDa Mass Detector was plumbed after the UV detector (Waters Alliance HPLC controlled by Empower 3 FR3). The chromatogram of a 4 μL injection of sample is shown in Figure 5. The change in buffer causes some selectivity changes, as expected, compared with the ion pairing buffer specified in the USP method. When integrating the peaks, the UV peaks are cross referenced with the most intense m/z at the same retention time (the retention volume offset must be accounted for to get proper alignment of the chromatograms). Of the two impurities identified in the USP monograph, only the cetirizine ethanol impurity was detected, while the cetirizine lactose ester impurity was not. Three other impurities, previously reported in cetirizine tablets,6,7 were tentatively identified based on the most intense m/z values. The proposed LC-MS method would meet the USP criteria for tailing factor and retention time reproducibility.

Figure 5. Cetirizine impurity method with a XBridge HILIC XP, 2.5 μm, 4.6 x 100 mm, Column on an ACQUITY QDa Detector (A). Zoomed in chromatogram showing the cetirizine impurity peaks. (B).
Figure 6. Cetirizine and impurities structures.

Conclusion

A modernized version of the USP method for organic impurities in cetirizine HCl tablets has been demonstrated on four different LC systems from two different vendors. Similar results were obtained on the HPLC and UHPLC systems used. These experiments were all performed using the same XBridge HILIC Column, providing confidence that validated methods can be successfully transferred between different LC systems. This USP method has been shown to have a significant issue caused by the difference between the sample solvent and the mobile phase. The work presented here shows that the largest contributor to the observed peak distortion is the higher percentage of strong eluent (water in the case of the prescribed HILIC method) in the sample solvent than in the mobile phase, 9% vs. 7%, respectively. While the offset in aqueous content may seem small, it causes severe distortion of the cetirizine peak at high injection volumes. It is hypothesized that the water injected from the sample solvent has a retention factor similar to that of cetirizine under these conditions. If the bands of water and cetirizine move through the column bed at approximately the same speed, the peak shape will be continually distorted until elution. Additional work to test this hypothesis is underway.

References

  1. Cetirizine Hydrochloride Tablets USP Monograph USP39-NF34, The United States Pharmacopeia Convention, official 2016.
  2. Chapter <621> CHROMATOGRAPHY United States Pharmacopeia and National Formulary (USP38-NF33 S1) Baltimore, MD: United Book Press, Inc.; 2015. p.424.
  3. J Sehajpal, JN Fairchild. Modernization of a HILIC USP Impurity Method for Cetirizine Hydrochloride Tablets. Technology Brief No. 720005825en, 2016.
  4. Summers M, Carlson G. “Future-proof Solutions for Regulated Laboratories in the Face of Changing USP <621> Guidelines”. Waters White Paper No. 720005153en.
  5. Fairchild JN, Hill JF, Iraneta PC. Influence of Sample Solvent Composition for SFC Separations. LC GC North America, 31:4 (2013), 326–333.
  6. Jaber AMY, Al Sherife HA, Al Omari MM, Badwan AA. Determination of cetirizine dihydrochloride, related impurities and preservatives in oral solution and tablet dosage forms using HPLC, J. Pharm. Biomed. Anal. 36 (2004), 341–350.
  7. Yu H, Cornett C, Larsen J, Hansen SH. Reaction between Drug Substances and Pharmaceutical Excipients: Formation of Esters between Cetirizine and Polyols. J. Pharm. Biomed. Anal. 53 (2010), 745–750.

720005870, February 2017

Back To Top Back To Top