• Application Note

Optimization of Chromatographic Conditions for the Analysis of Polar Metabolites in Aqueous Solutions by UPC2-MS

Optimization of Chromatographic Conditions for the Analysis of Polar Metabolites in Aqueous Solutions by UPC2-MS

  • Christopher Knappy
  • Norman W. Smith
  • Arundhuti Sen
  • Paul D. Rainville
  • Robert S. Plumb
  • Drug Control Centre, King’s College London
  • Waters Corporation
Blood plasma serum in woman's hand

For research use only. Not for use in diagnostic procedures.

Abstract

UPC2-MS shows significant promise as a platform for polar metabolomic profiling, and could allow for the analysis of aqueous biological matrices. Method development for analyzing polar metabolites by UPC2-MS requires the optimization of eluent composition; co-solvent composition, buffer concentration and acidity of the co-solvent. This application note evaluates the effects that the UPC2 method parameters, such as column chemistry, mobile phase gradient conditions, and eluent solvent composition have on the chromatographic analysis of biologically relevant polar analytes in aqueous based samples.

Benefits

  • Analysis of polar metabolites
  • Throughput
  • Aqueous sample compatibility
  • Resolution

    UltraPerformance Convergence Chromatography (UPC2) provides an attractive alternative to HILIC for the analysis of polar compounds in biological fluids. The addition of water at 5% (v/v) or acidified ammonium formate (Aq), into methanol co-solvent significantly improves the peak shape and analyte retention, providing high resolution, high throughput separations, with rapid re-equilibration times. These systems are highly suited to the task of polar metabolite analysis in urine and plasma extracts.

Introduction

Metabolic phenotyping along with other omics based approaches are the key analytical platforms for precision medicine, providing critical data on genetic susceptibility to disease, along with the effect of environment, life-style, and diet on health. Therefore, the ability to detect and quantify low molecular weight endogenous metabolites in biofluids such as urine and plasma is a critical analytical requirement in metabolic phenotyping.

Previous work illustrated that UPC2 has great potential for the rapid analysis of highly polar analytes in aqueous solutions, which are poorly retained by conventional reversed-phase chromatography.1 Here we evaluate the effects that the UPC2 method parameters, such as column chemistry, mobile phase gradient conditions, and eluent solvent composition have on the chromatographic analysis of biologically relevant polar analytes in aqueous based samples.

Experimental

Sample description

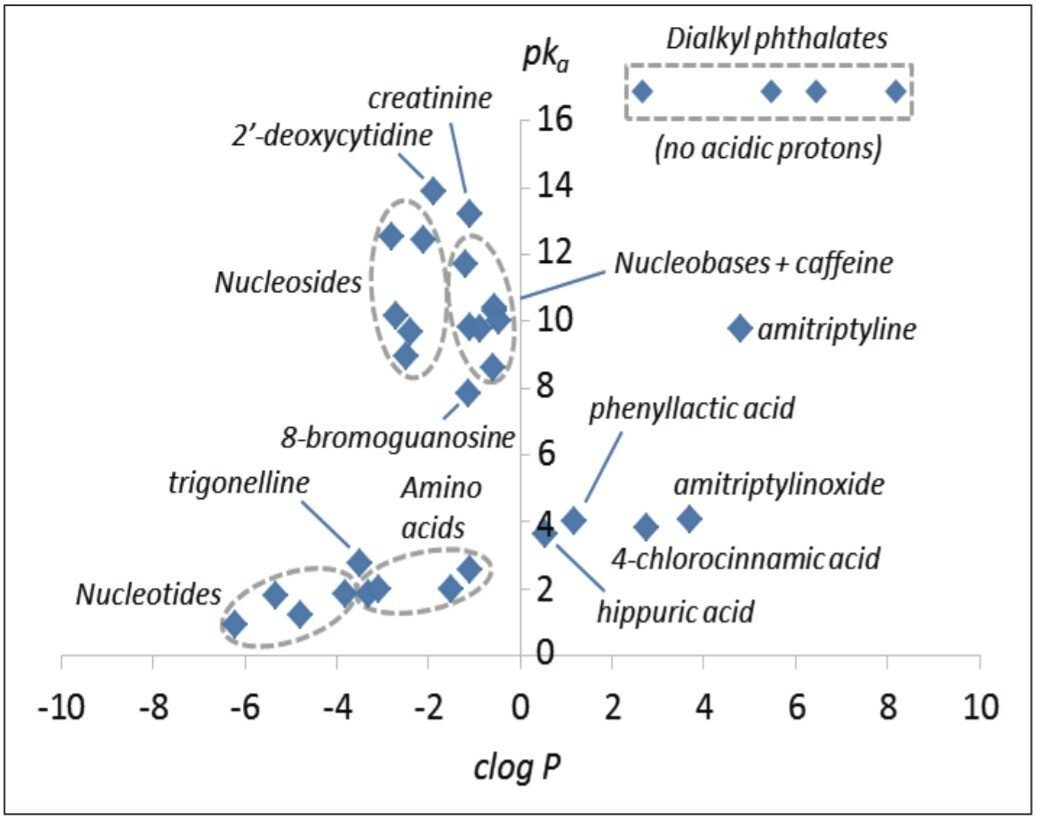
A mixture of polar analytes comprising of uracil, adenosine, creatinine, hippuric acid, cytosine, 2'-deoxycytidine, cytidine, trigonelline, caffeine, dihydrouracil, thymine, adenine, uridine, inosine, guanine, guanosine, diethyl phthalate, diamyl phthalate, dihexyl phthalate, dioctyl phthalate, amitriptyline, amitriptylinoxide, and 8-bromoguanosine was created at a concentration of 10 μg/mL-1 in water.

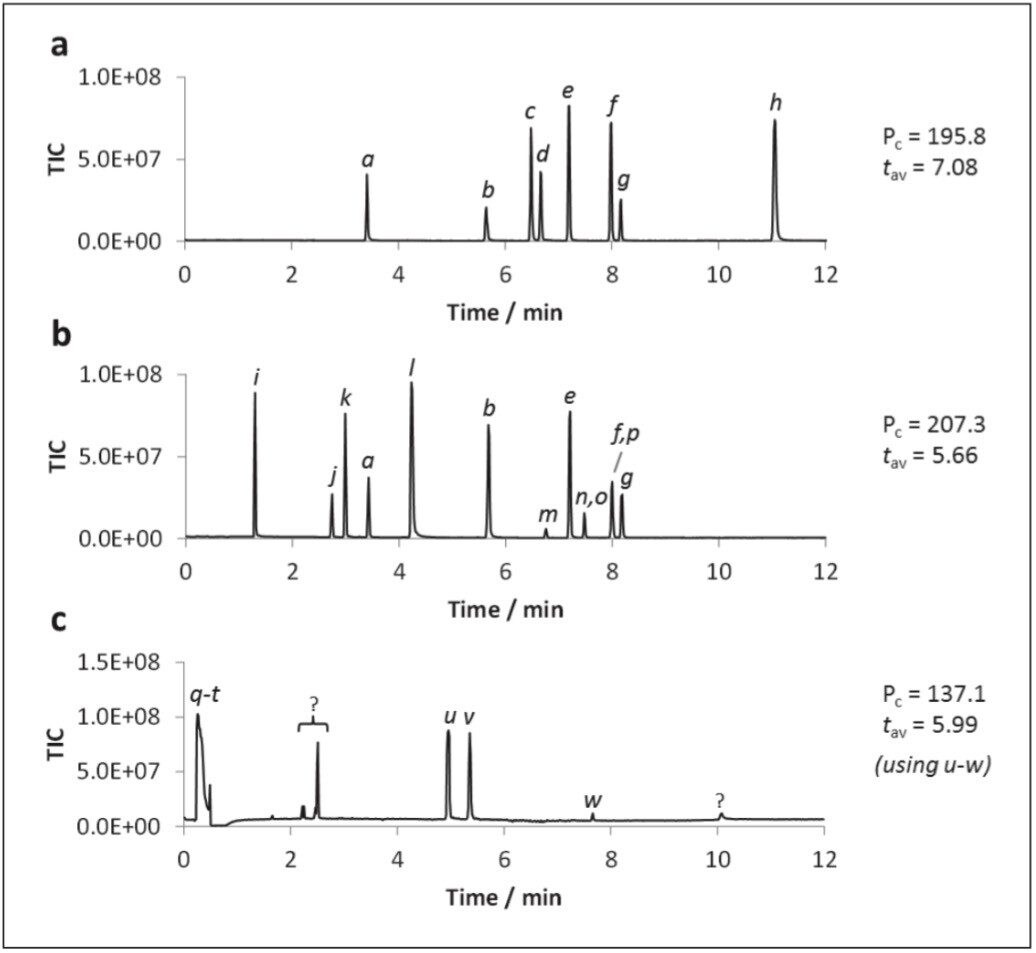
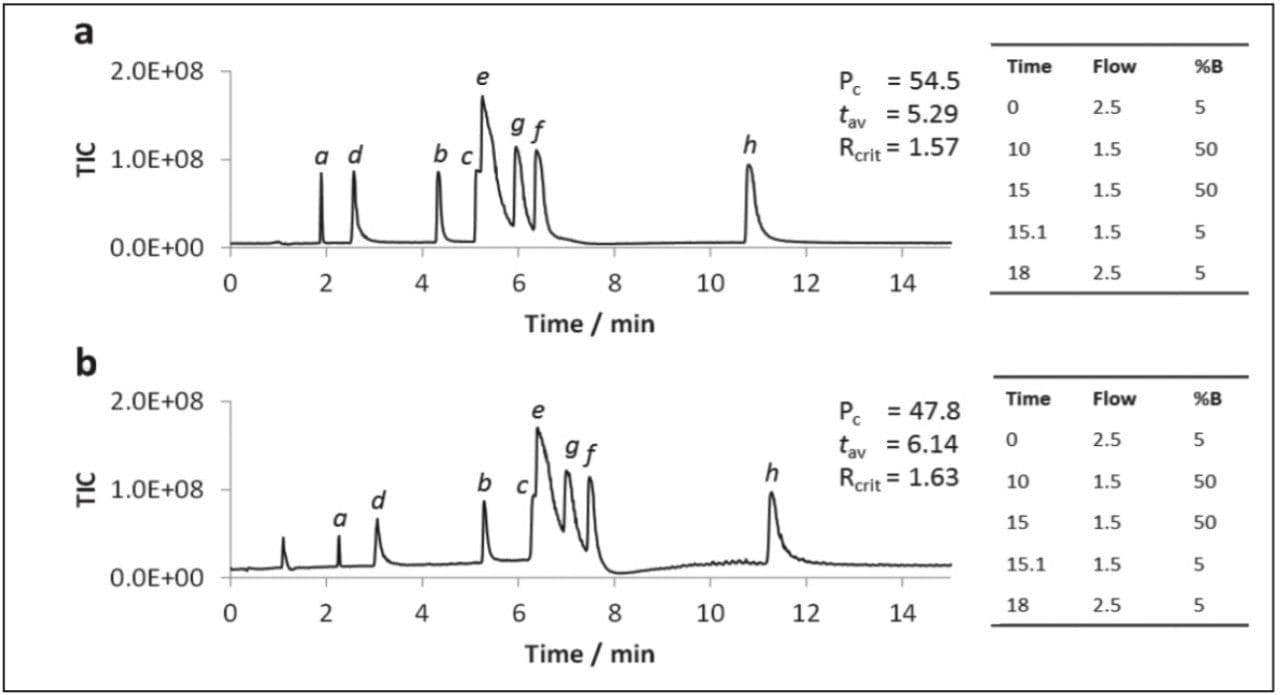
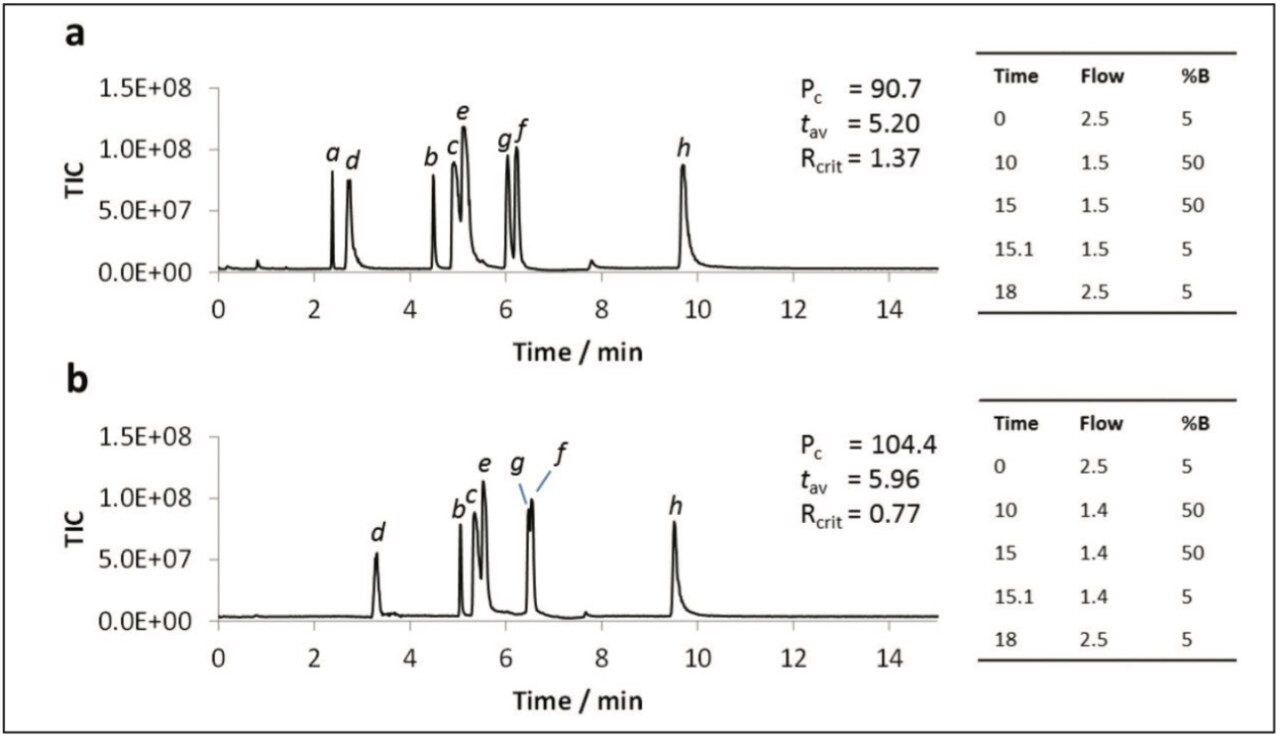
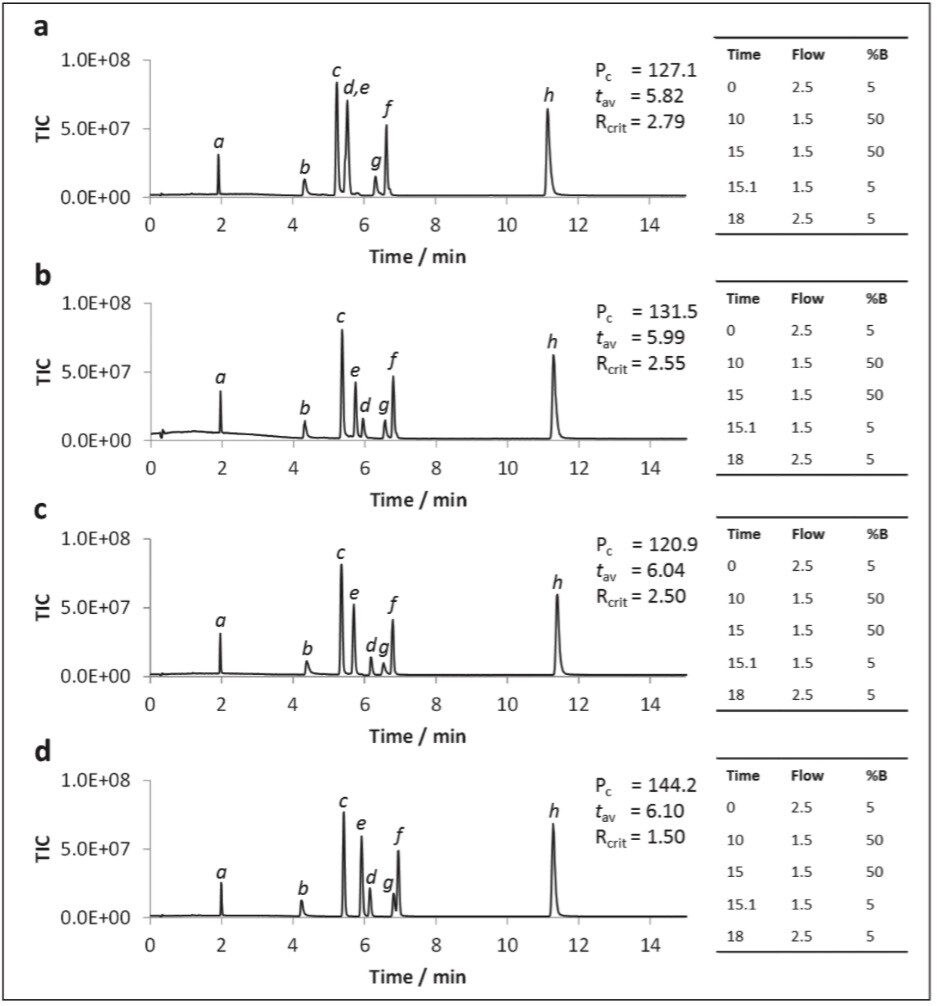
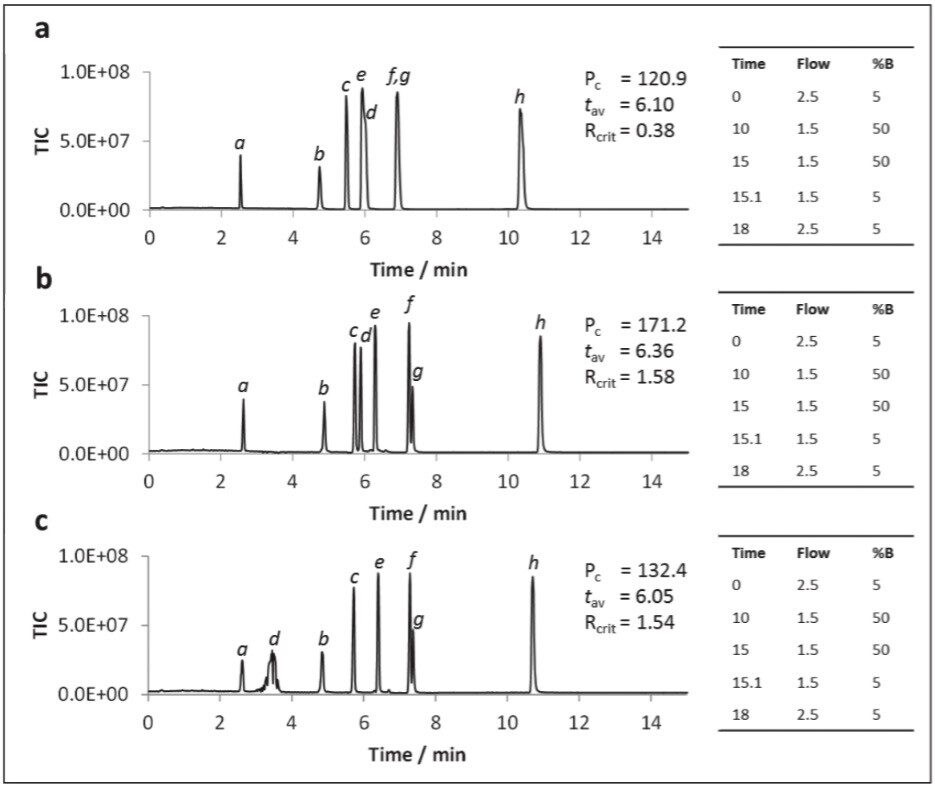
Chromatography was performed on an ACQUITY UPC2 System, comprising of an ACQUITY UPC2 Binary Solvent Manager, ACQUITY UPC2 Sample Manager, Automatic Back-Pressure Regulator (ABPR) and an ACQUITY Photodiode Array (PDA) Detector. The separation was performed on an ACQUITY UPC2 BEH Column (1.7 μm, 3.0 x 100 mm) and eluted under gradient mobile phase conditions as described in the LC conditions. Methanol was employed as the co-solvent with a starting concentration of 98:2 (v/v) CO2:MeOH, and the co-solvent concentration was then ramped up to a maximum of 60% over 12 minutes. The methanol co-solvent was modified with either water, ammonium formate buffer, or acidified buffer at various concentrations. The effluent flow rate was varied between 3 and 1.2 mL/min. The density of the subcritical fluid was regulated via a column temperature of 35 °C and ABPR pressure setting of 2000 psi. The column effluent was monitored by PDA at 273 nm or positive ion mass spectrometry.

Mass spectrometry was performed on a Waters tandem quadrupole mass spectrometer. A Waters 515 HPLC pump was employed for post column makeup flow via a splitter interface. The MS operating conditions employed for positive electrospray (ES+) of polar analytes are given in the MS conditions.

LC conditions

LC system:

ACQUITY UPC2

Detection:

273 nm or mass spectrometry

Column:

ACQUITY UPC2 BEH (1.7 μm, 3.0 x 100 mm)

Column temp.:

35 °C

Sample temp.:

Room temperature

Injection volume:

Various

Flow rate:

3–1.2 mL/min

Mobile phase A:

CO2

Mobile phase B:

MeOH

Gradient:

98:2 (v/v) CO2:MeOH, and the co-solvent concentration was then ramped up to a maximum of 60% over 12 minutes.

MS conditions

MS system:

Waters Quattro XE

Ionization mode:

ESI positive ion mode

Acquisition range:

100-800 m/z

Capillary voltage:

3.4 kV

Collision energy:

Full scan mode

Cone voltage:

30 V

Data management

MassLynx Software v4.1

Results and Discussion

The polar analytes, including nucleobases, nucleosides, organic acids, nucleobases, nucleosides, and nucleotides, and L-amino acids, were selected as test probes for method development. This mixture gave a near complete representation of a polar metabolic class typically encountered in metabolic phenotyping. A polar test mix containing dialkyl phthalates, basic pharmaceuticals, and other compounds was used as a reference test set. In total, 33 compounds were investigated with clog P values ranging from -6.21 to 8.18, and pKa values ranging from 0.9 to 13.9. The relative pKa and clog P values are shown in Figure 1.

Chemometric map of polar metabolites
Figure 1. Chemometric map of polar metabolites analyzed by UPC2-MS, calculated using ChemAxon software. Although dialkyl phthalates have pKa values which are much higher than 16, their clog P values are plotted for comparison.

Optimized UPC2-MS method for analysis of polar compounds

An optimized UPC2-MS method for generic screening of polar analytes in aqueous media was developed using a linear co-solvent gradient from 2–60% 40 mM ammonium formate in 94.8% methanol, 2% water, 0.2% formic acid over 12 minutes. The data shown in Figure 2 shows the LC-MS separations for the polar analytes, for convenience shown as three separate groups.

The acquired data showed narrow, reasonably symmetrical peaks for all analytes. This includes the relatively strong acids (trigonelline and hippuric acid, Figure 2a), mild bases (creatinine and cytidine, Figure 2a) and compounds renowned for severe peak tailing in UPLC (amitriptyline, Figure 2c). All components were chromatographically resolved, aside from inosine/guanine and 2’-deoxycytidine/guanosine which co-eluted.

The critical pair, cytidine and 2'-deoxycytidine, were well resolved (Rcrit = 4.76), Figure 2a. Of the compounds investigated, the most polar eluted compound was trigonelline (clog P = -3.50; t = 11.1 min). The peak capacity (Pc) value of 207.3 was determined using the greatest diversity of analytes, suggesting that, theoretically, 200+ components could be fully resolved during a single 12 minute UPC2-MS gradient separation. Peak asymmetry factors ranged from 0.6 (caffeine) to 1.9 (hippuric acid), with an average value of 1.1. The total run time for the method including reconditioning was 16 minutes.

UPC2-MS SIR chromatograms
Figure 2. UPC2-MS SIR chromatograms Polar Mix using the optimised screening method developed on an ACQUITY UPC2 BEH, 3 x 100mm, Column (a uracil, b adenosine, c creatinine, d hippuric acid, e cytosine, f 2'-deoxycytidine, g cytidine, h trigonelline, i caffeine, j dihydrouracil, k thymine, l adenine, m uridine, n inosine, o guanine, p guanosine, q diethyl phthalate, r diamyl phthalate, s dihexyl phthalate, t dioctyl phthalate, u amitriptyline, v amitriptylinoxide, and w 8-bromoguanosine).

Effect of organic co-solvent

Previous studies have suggested methanol to be superior to other organic solvents for UPC2 of polar analytes.2 However, the use of methanol as a co-solvent was not evaluated under gradient conditions, nor was MS compatibility investigated. A subset of the polar compounds were analyzed by gradient UPC2-MS using MeOH or 3:1 MeOH:ACN as co-solvent, the results obtained are displayed in Figure 3.

The data in Figure 3 shows that the polar analytes were retained longer when acetonitrile was included in the co-solvent, however, the peak capacity value was also lower.

UPC2-MS SIR chromatograms
Figure. 3. UPC2-MS SIR chromatograms on an ACQUITY UPC2 BEH, 3 x 100 mm, Column using a) MeOH and b) 3:1 MeOH:ACN as co-solvent (%B). Gradient programs are shown in each case (flow rate in mL/min-1; ABPR pressure 2000 psi, temperature 35 °C; 2 μL injection) (a uracil, b adenosine, c creatinine, d hippuric acid, e cytosine, f 2'-deoxycytidine, g cytidine, and h trigonelline).

Effect of co-solvent modification with water

The addition of water to the co-solvent has been shown to be beneficial for the UPC2 analysis of caffeine, and for the SFC analysis of a variety of other analytes,3,4 including nucleobases.5 Water was added to the co-solvent to determine if similar benefits were observed for the polar analytes used in this study. The data shown in Figure 4 illustrates that the peak shapes were dramatically improved for all analytes upon addition of 5% water to the co-solvent (Figure 4a). Further improvements were noted for most metabolites with 7.5% water in the co-solvent (Figure 4b). However, peaks for some of the earlier eluting compounds (i.e. uracil and dihydrouracil) either split or disappeared entirely with gradients starting at 95:5 CO2:co-solvent. The peaks could be re-instated by starting the gradient at 98:2 CO2:co-solvent.

UPC2-MS SIR chromatograms
Figure 4. UPC2-MS SIR chromatograms for Mix 1 (50 μg/mL-1) on an ACQUITY UPC2 BEH, 3 x 100 mm, Column using a) 95:5 MeOH:H2O and b) 92.5:7.5 MeOH:H2O as co-solvent (%B). Gradient programs are shown in each case (flow rate in mL/min-1; ABPR pressure 2000 psi, temperature 35 °C; 2 μL injection) (a uracil, b adenosine, c creatinine, d hippuric acid, e cytosine, f 2'-deoxycytidine, g cytidine, and h trigonelline).

Effect of modification of co-solvent with buffer

The addition of ammonium salts to the organic co-solvent is well-documented and results in improved SFC chromatographic performance.1,6 To investigate the influence of buffers on the UPC2 separation of polar metabolites, a subset of the test compounds was analyzed using ammonium formate (AmForm) and ammonium acetate (AmAc) as modifiers to the methanol co-solvent at various ionic strengths, and the resulting data is displayed in Figure 5.

From the observed data we can see that the addition of ammonium formate to the co-solvent led to changes in selectivity compared with methanol alone, most notably for hippuric acid (Figures 5a, b, and d). The peak capacity value markedly improved with increasing ionic strength from 0–20 mM, with ammonium formate giving a markedly higher peak capacity, thus being selected as the best modifier. The use of 40 mM ammonium formate resulted in the optimal peak shapes, provided that the gradient program was started at 98:2 CO2:co-solvent. No dramatic ion-suppresion was noted in the 5–40 mM range.

 UPC2-MS SIR chromatograms
Figure 5. UPC2-MS SIR chromatograms on an ACQUITY UPC2 BEH, 3 x 100 mm, Column, using methanol modified with a) 5 mM AmForm,(b) 10 mM AmForm, c) 10 mM AmAc, and d) 20 mM AmForm as co-solvent (%B). Gradient programs are shown in each case (flow rate in mL/min-1; ABPR pressure 2000 psi, temperature 35 °C; 2 μL injection) (a uracil, b adenosine, c creatinine, d hippuric acid, e cytosine, f 2'-deoxycytidine, g cytidine, and h trigonelline).

Effect of acid addition to the co-solvent

It has been well documented that supercritical CO2:MeOH mixes are thought to be mildly acidic (approx. pH 4–5) owing to the production of carbonic acid (Wen and Olesik, 2000). However, in order to protonate metabolites with pKa values less than 4, the co-solvent was acidified with formic acid (FA) either at a low (0.2%) or high (1%) concentration. When formic acid was added to the methanol only co-solvent system marginal improvement to peak shapes and earlier elution of hippuric acid (pka = 3.62) and trigonelline (pka = 2.78) was observed. This appeared to be directly related to acid concentration, however, the overall peak capacity values remained largely unchanged.

Acidification of aqueous methanol co-solvent containing 20 mM ammonium formate gave a more dramatic improvement in performance (Figure 6). At 0.2% formic acid (Figure 6b), peak shapes for the two acids significantly improved over those for the neutral co-solvent (Figure 6a), as was the peak capacity. However, when the acidic concentration was increased to 1% formic acid the hippuric acid peak was split (Figure 6c). The peak tailing observed for trigonelline under neutral conditions was rectified by the addition of 0.2% formic acid. Accordingly, 0.2% formic acid was selected as the optimal acid strength.

UPC2-MS SIR chromatograms
Figure 6. UPC2-MS SIR chromatograms on an ACQUITY UPC2 BEH, 3 x 100 mm, Column, using 20 mM ammonium formate in a) 95:5 MeOH:H2O, b) 94.8:5:0.2 MeOH:H2O:formic acid, and c) 94:5:1 MeOH:H2O:formic acid as co-solvent (%B). Gradient programs are shown in each case (flow rate in mL/min-1; ABPR pressure 2000 psi, temperature 35 °C; 2 μL injection) (a uracil, b adenosine, c creatinine, d hippuric acid, e cytosine, f 2’-deoxycytidine, g cytidine, and h trigonelline).

Conclusion

UPC2-MS shows significant promise as a platform for polar metabolomic profiling, and could allow for the analysis of aqueous biological matrices.

Method development for analyzing polar metabolites by UPC2-MS requires the optimization of eluent composition; co-solvent composition, buffer concentration and acidity of the co-solvent.

The addition of water at 5% (v/v) or acidified ammonium formate (Aq), into methanol co-solvent significantly improved the peak shape and analyte retention.

Peak shape and analyte retention improved with increasing buffer concentration, however, increasing the methanol concentration above 5% and the acid concentration above 0.2% resulted in deleterious chromatographic effects.

Total analysis times achieved with the ACQUITY UPC2 System were similar to previously reported using HILIC UPLC-MS methods.

References

  1. Pinkston JD, Stanton DT, Wen D. Elution and preliminary structure-retention modelling of polar and ionic substances in supercritical fluid chromatography using volatile ammonium salts as mobile phase additives. J Sep Sci. 2004;27:115–23.
  2. Ashraf-Khorassani M and Taylor LT. Subcritical fluid chromatography of water soluble nucleobases on various polar stationary phases facilitated with alcohol-modified CO2 and water as the polar additive. J Sep Sci. 2010;33:1682–91.
  3. Taylor LT. Packed column supercritical fluid chromatography of hydrophilic analytes via water-rich modifiers. J Pharm Biomed Anal. 2012;43:464–70.
  4. Liu Y, Li X, Yang C, Tai S, Zhang X, Liu G. UPLC-MS/MS Method for Simultaneous Determination of Caffeine, Tolbutamide, Metoprolol, and Dapsone in Rat Plasma and its Application to Cytochrome P450 Activity Study in Rats.
    J Chrom Sci. 2013;51:26–32.
  5. Ashraf-Khorassani M and Taylor LT. Subcritical fluid chromatography of water soluble nucleobases on various polar stationary phases facilitated with alcohol-modified CO2 and water as the polar additive. J Sep Sci. 2010;33:1682–91.
  6. Cazenave-Gassiot A, Boughtflower B, Caldwell J, Hitzel L, Holyoak C, Lane S, Oakley P, Pullen F, Richardson S, Langley GJ. Effect of increasing concentration of ammonium acetate as an additive in supercritical fluid chromatography using CO2–methanol mobile phase. J Chrom A. 2009;1216:6441–50.

720005503, September 2015

Back To Top Back To Top