For research use only. Not for use in diagnostic procedures.
In this study, we investigate use of the SYNAPT HDMS System for in vivo drug metabolite analysis. SYNAPT HDMS allows the user to operate the system in either time-of-flight (TOF) mode or HDMS mode. Apart from the orthogonal separation afforded by high-efficiency ion mobility, this configuration also has the ability to fragment ions in the Triwave region: pre-IMS, post-IMS, or both combined in parallel.
The powerful features of the SYNAPT HDMS System enable scientists to improve both their productivity and the amount of key information necessary to make quick decisions in a timely manner.
In vivo sample analysis for metabolite identification is extremely challenging due to the lack of radio labeled drugs in early discovery and the high level of endogenous biological non-drug-related interferences. As a result, there are no reference points for identifying xenobiotics a priori. Analysts rely heavily on personal experience and analytical strategies to detect and identify low-level metabolites.
In principle, some of these problems may be reduced by utilizing an additional stage of separation. This separation stage is orthogonal to LC and mass spectrometric separations and occurs on an intermediate timescale between the two separations. The Waters SYNAPT HDMS System provides this capability by combining high-efficiency ion mobility-based measurements and separations with tandem mass spectrometry.1
HDMS mode on the SYNAPT HDMS System employs ion mobilitybased separations (IMS) that separate ionic species as they drift through a gas under the influence of an electric field. The rate of the drift depends on the following factors: the mass of the ion, its charge state, and the interaction cross-section of the ion with the gas. Consequently, it is possible to separate ions with the same nominal m/z value if they have different charge states or sufficiently different interaction cross-sections.
In this study, we investigate use of the SYNAPT HDMS System for in vivo drug metabolite analysis. SYNAPT HDMS allows the user to operate the system in either time-of-flight (TOF) mode or HDMS mode. Apart from the orthogonal separation afforded by high-efficiency ion mobility, this configuration also has the ability to fragment ions in the Triwave region: pre-IMS, post-IMS, or both combined in parallel as shown in Figure 1.
The combination of pre- and post-IMS fragmentation, also referred to as time-aligned parallel (TAP) fragmentation, provides a highly informative fragmentation spectra that contains first- and secondgeneration fragment ions with none of the low-mass cutoffs that are observed in conventional ion traps.
For a given TAP experiment, ions of interest are selected in the quadrupole region. The ions are then fragmented in the Trap region using CID energy. These first-generation fragment ions are next separated in the ion mobility T-Wave. Each first-generation fragment ion has a different drift time depending on the factors described above.
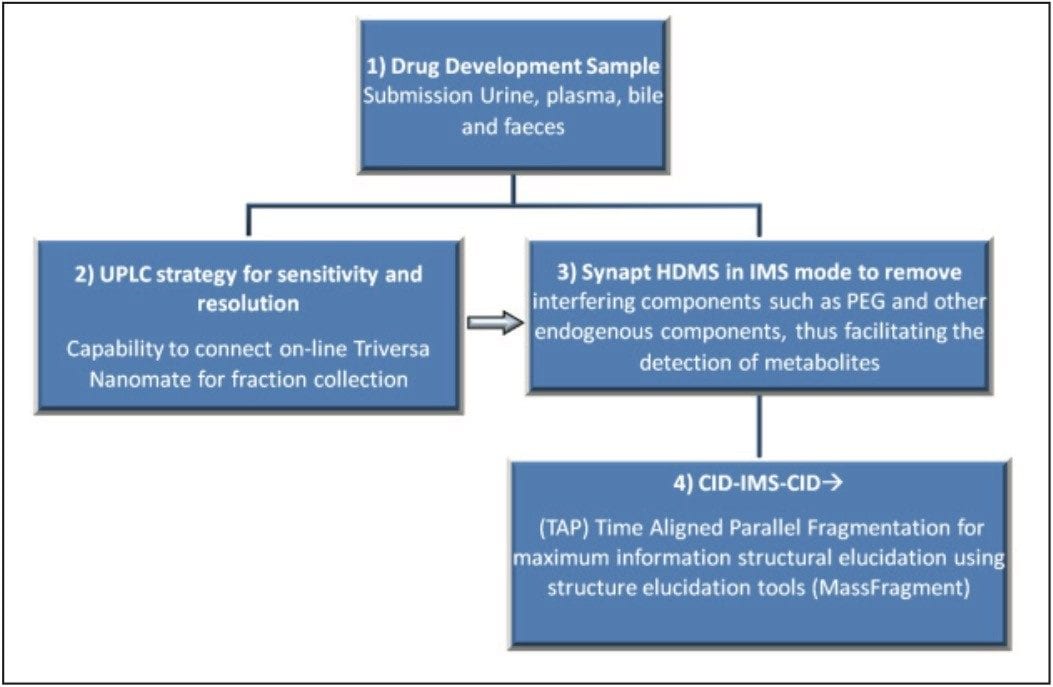
To facilitate the analysis of this data, Waters MassFragment Software, a structure elucidation tool, can be used to rationalize fragment ions quickly. This software enhances the entire HDMS analytical workflow (Figure 2) by reducing structure elucidation time, which is one of the major bottlenecks of in vivo metabolite identification. With this workflow-based approach to metabolite analysis using HDMS, a straightforward two-injection strategy is necessary for fraction collection, resulting in more valuable time spent analyzing and optimizing the sample analysis conditions for each fraction.
As these fragmented ions emerge from the ion mobility region, they are subjected to a further stage of fragmentation in the T-Wave Transfer region before entering the TOF region, generating second generation fragment ions. The drift time generated by each of the first-generation fragment ions is used to localize and align which fragment was responsible for producing the second-generation fragment ions.
At a time point of 4 hours, rat urine sample was collected from a 5 mg/kg (Verapamil) oral dose experiment. The sample was diluted 1/4 with water + 0.1 % formic acid and injected directed to the LC-MS.
LC system: |
ACQUITY UPLC System |
Column: |
ACQUITY UPLC HSS T3 Column 2.1 x 100 mm, 1.7 μm |
Column temp.: |
45 °C |
Flow Rate: |
600 μL/min |
Mobile Phase A: |
Water + 0.1% formic acid |
Mobile Phase B: |
Acetonitrile |
Gradient: |
0 to 50% B linear in 10 min, 50% B to 10% B linear in 1 min, hold at 10% B for 1 min, Re-equilibrate at 0% B for 3 min |
Run time: |
15 minutes |
System: |
Advion TriVersa NanoMate |
UPLC flow: |
600 μL/min |
Flow split: |
2000:1 |
Collection plate: |
96-well plate |
Collection time: |
7 s per well (70 μL collected per well) |
Trigger: |
Fraction collector was triggered by time |
MS system: |
Waters SYNAPT HDMS System |
Ionization mode: |
ESI positive |
Capillary voltage: |
3200 V |
Cone voltage: |
35 V |
Desolvation temp.: |
400 °C |
Desolvation gas: |
800 L/Hr |
Source temp: |
120 °C |
Acquisition range: |
50 to 1000 m/z |
HDMS gas: |
Helium |
Collision gas: |
Argon |
By way of sample comparison, the differences between the control (Figure 3A) and analyte (Figure 3B) can be easily visualized as highlighted in white circles. The DriftScope Software tool utilized for data interrogation allowed lassoing of the drift time regions of interest. Thus it was possible to obtain a clean extracted ion TIC only corresponding to the metabolites of interest.
The ability to select only the metabolites of interest in the extracted TIC is shown in Figure 4. Since the metabolites are above the chemical noise and background ions, the resulting TIC was very clean with zero baseline noise. This made detecting putative metabolites much easier.
Once the metabolites of interest were found, the fractions for the peaks of interests were collected by the use of the TriVersa NanoMate workstation (Advion, Ithaca, NY, U.S.). For each of the fractions collected, a time-aligned parallel (TAP) fragment experiment was carried out.
After carrying out TAP fragmentation on the parent drug (Figure 5), every drift time region was interrogated independently by creating fragmentation drift time trees. It was not necessary to pre-select precursor ions for the CID-IMS-CID experiments as all ions emerging from the ion mobility cell were fragmented in parallel.
The major fragment ions obtained were then submitted to MassFragment Software. This software tool enabled us to elucidate the structure of the parent compound, as shown in Figure 6.
Once the parent fragment ions were characterized, it was possible to localize the sites of chemical modification for some metabolites. For instance, the site of one of the O-desmethyl glucuronidated metabolites for Verapamil was identified by the use of TAP fragmentation (Figure 7).
720002448, January 2008