Enhanced Host Cell Protein Identification and Quantitation with Multi-Reflecting ToF LC-MS
Jonathan Fox, Malcolm Anderson, Ying Qing Yu, Scott J Berger, Nick Pittman, Laetitia Denbigh
Waters Corporation, United States
Published on August 07, 2025
Abstract
Host cell proteins (HCPs) are impurities commonly found in biotherapeutic drug products as a combined result of upstream and downstream manufacturing processes. These low-level endogenous proteins originate from the host organism and can be challenging to purify away or detect. Despite their low levels in a commercial product (total typically < 100 ppm), HCPs can impact the therapeutic activity and stability of biotherapeutics. Therefore, characterizing HCPs is crucial in biopharmaceutical process development, and demonstrating their clearance is critical in manufacturing and product release to ensure the safety, efficacy, and quality of therapeutic products.
This application brief details the implementation of a novel multi-reflecting time-of-flight (MRT) Q-ToF mass spectrometer for comprehensive host cell protein liquid chromatography mass spectrometry (HCP LCMSE) discovery and Hi3-based quantitation workflows for a sample of the NIST monoclonal antibody reference material (NIST mAb, RM 8671). This analysis revealed the confident detection of 101 HCPs across a wide dynamic range from 128 ppm down to 12 ppb.
Benefits
- Confident identification and quantification of individual HCPs allows for product and process understanding, targeted purification strategies, and improved risk assessment outcomes.
- Wide dynamic range and high sensitivity for early identification of ppb level HCPs that can persist through purification processes, facilitating efficient process optimization and validation.
- Consistent sub-ppm mass errors enabling confident assignments of precursor and fragment ions, supporting unique peptide and protein assignments for robust detection of host cell protein impurities.
- Orthogonal method to enzyme-linked immunosorbent assay (ELISA): High-resolution mass spectrometry (HRMS) does not rely on immunoreagents, offering reduced development time of HCP assays and enabling a broader analysis of HCPs without immunoreagent-specific limitations. HRMS validates the selectivity and quantitative capacity of ELISA assays by providing data on individual HCPs.
Introduction
HCP analysis is a vital component of biopharmaceutical process development to ensure the safety and purity of therapeutic products. Traditionally, the industry has relied on ELISA and immunoassays to measure total HCP concentrations expressed in ppm (ng HCP/mg biopharmaceutical). ELISA and immunoassays provide high sensitivity and throughput, but 1) exhibit limited dynamic range; 2) are limited by their reliance on immunoreagents which may not recognize all HCPs present in a sample or have sufficient antibodies to quantitatively measure specific HCPs; 3) provide total HCP content but cannot typically quantify individual proteins. In contrast, mass spectrometry (MS)-based HCP analysis has emerged as a powerful alternative, offering proteome-wide coverage and the ability to identify and quantify individual HCPs with high specificity and sensitivity. This approach enables more detailed risk assessments, faster process optimization, and compliance with evolving regulatory requirements as specific HCP classes are revealed as offering outsized risks.
MS using the peptide digest of a biotherapeutic protein sample is a powerful analytical method used throughout the development lifecycle of biotherapeutics to monitor and quantify HCPs. As the biotherapeutic pipeline expands, deploying higher-confidence automated methods that can accurately and consistently characterize lower-level HCPs becomes increasingly important for efficient product and process development decision-making. This requires robust, easy-to-use analytical platforms that can be readily deployed in laboratories across an organization.
Over recent decades, technological improvements in LC-MS have enabled HCP discovery and quantitation to be performed more conveniently with greater confidence, enhanced sensitivity, and reduced sample analysis time, making this approach increasingly commonplace in biopharmaceutical manufacturing. In previous studies, complex methods utilizing nano-flow rates and multiple LC dimensions were essential to achieving the highest sensitivity required for identifying low-level host cell proteins.1 These methods were challenging to execute and limited in throughput, requiring days of experienced analyst time to track HCPs across purification steps or multiple drug batches. The shift to high-throughput analytical scale LC-MS analysis has made the approach more usable, but has added greater requirements for MS detection capabilities.
The NIST mAb, RM 8671 was selected for analysis due to its acceptance as a widely recognized historical benchmark reference material for HCP analysis, enabling direct comparison of method performance and results across analytical platforms and workflows. This comparability is critical for demonstrating improvements in HCP detection, such as increased coverage, lower detection limits, and robust quantitation, while ensuring that results are meaningful within the broader context of biopharmaceutical process development and regulatory expectations.2,3
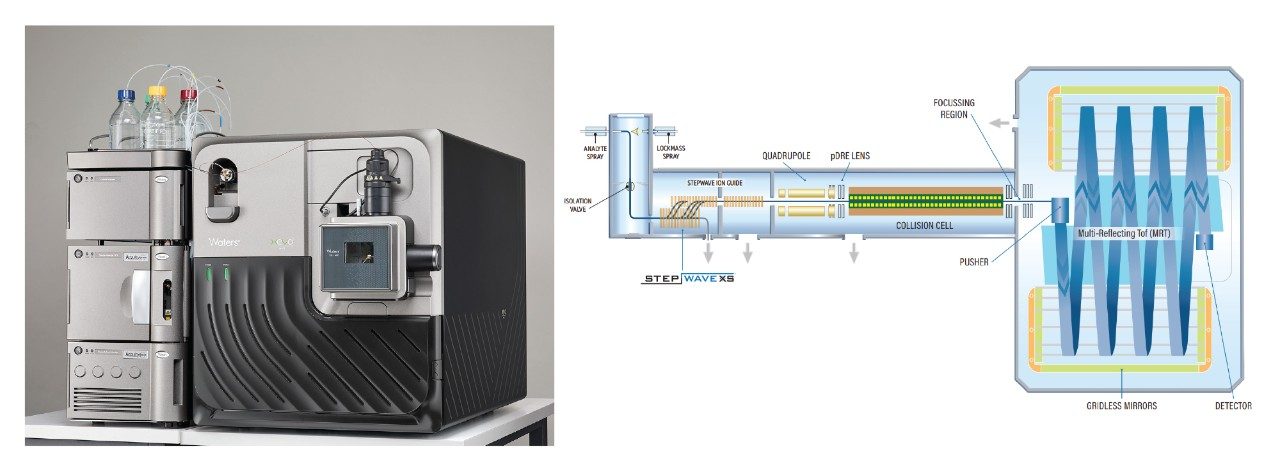
In this study, it is shown how the Xevo™ MRT’s intuitive LC-MSE data-independent acquisition (DIA) mode4 delivers exceptional sensitivity, broad dynamic range, and sub-ppm mass accuracy for confident identification of HCPs. Quantification is performed within the same data using Hi3 quantification, an internally calibrated, label-free, intensity-based method that estimates protein abundance by averaging the MS1 signal intensities of the three most intense tryptic peptides, enabling accurate and reproducible quantification across complex biological samples.
Overall, the Waters™ Xevo MRT Mass Spectrometer System under control of waters_connect™ informatics and data processing using ProteinLynx Global Server provided a comprehensive solution for HCP mass spectrometry discovery and quantification, supporting the development of safer biotherapeutics through high-confidence, automated methods that enhance product and process development.
Experimental
An optimized non-denaturing digestion protocol previously described by Huang et al.2 was utilized for the sample preparation. mAb digestion under non-denaturing conditions provides a simple and robust sample preparation method that preferentially digests HCPs and depletes the highly abundant therapeutic mAb proteins. This approach enables enrichment and facilitates identification of lower-abundance HCPs through analytical scale LC-MS analysis.
The trypsin digested NIST mAb sample (using referenced Lilly approach) was analyzed using the Xevo MRT Mass Spectrometer and LC-MSE (DIA) acquisition mode. Data were processed in PLGS 3.0.3.
Non-Denaturing Monoclonal Antibody (mAb) Digestion Protocol:
Reagents and Materials:
- NISTmAb Humanized IgG1k Monoclonal Antibody standard NIST® SRM® 8671 was purchased from Merck consisting of one cryovial containing 800 µL of 10 mg/mL NIST IgG1κ monoclonal antibody (NISTmAb) (8 mg total).
- RapiZyme™: 40 µL (0.5 µg/µL)
- Tris/CaCl₂ buffer (100 mM/10mM): 80 µL
- Dithiothreitol (DTT): 350 mM
- Waters Mass Prep Standards: Phosphorylase B (p/n: 186002326), BSA (p/n: 186002329), ADH (p/n: 186002328) and Enolase (p/n: 186002325)
- Formic acid: 10% solution
Procedure:
1. Digestion Setup:
- Combine 800 µL of mAb (8 mg) with 40 µL of Rapizyme (0.5 µg/µL) and 80 µL of 100 mM Tris/CaCl₂ buffer in Waters QuanRecovery™ with MaxPeak™ HPS vials.
- Incubate the mixture at 37 °C for 16 hours at a 400:1 substrate-to-enzyme ratio.
2. Reduction:
- Add 15.7 µL of 350 mM DTT to the digest.
- Vortex and incubate at 90 °C for 15 minutes. A cloudy suspension may form.
3. Centrifugation:
- Centrifuge the mixture at 12,000 × g for 5 minutes using soft acceleration and deceleration settings.
- Carefully collect the supernatant (~800 µL).
4. Mass Prep Standard Spiking:
- Spike the supernatant with the following standards:
- BSA: 28.96 µL of 1 pmol/µL (final concentration: 250 ppm)
- Phosphorylase B: 8.24 µL of 1 pmol/µL (100 ppm)
- ADH: 10.88 µL of 1 pmol/µL (50 ppm)
- Enolase: 34.16 µL of 100 fmol/µL (20 ppm)
5. pH Adjustment:
- Adjust the pH by adding 4 µL of 10% formic acid.
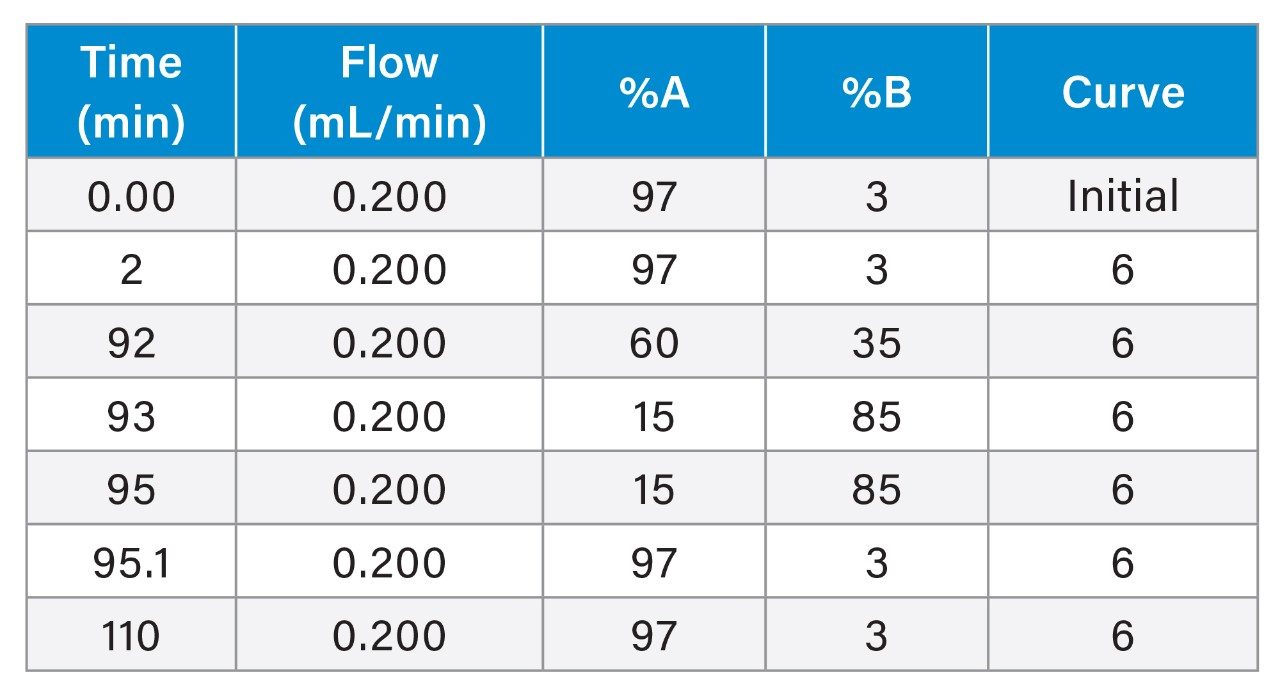
LC Conditions
|
LC system: |
Waters ACQUITY™ Premier UPLC™ System (Binary) |
|
Vials: |
Waters QuanRecovery with MaxPeak HPS 12 x 32 mm Screw Neck Vials (p/n: 186009186) |
|
Column: |
ACQUITY Premier Peptide CSH C18 Column, 130Å, 1.7 µm, 2.1 x 150 mm (p/n: 186009489) |
|
Column temperature: |
60.0 °C |
|
Sample temperature: |
6.0 °C |
|
Injection volume: |
100 µL |
|
Flow rate: |
0.200 ml/min |
|
Mobile phase A: |
H2O 0.1% formic acid |
|
Mobile phase B: |
ACN 0.1% formic acid |
Gradient Table
MS Conditions
|
MS system: |
Waters Xevo MRT Mass Spectrometer |
|
Mode: |
MSE Full scan with fragmentation |
|
Mass range: |
50–2000 m/z |
|
Polarity: |
Positive |
|
Scan rate: |
2 Hz |
|
Cone voltage: |
15 V |
|
Fragmentation collision energy ramp: |
20–45 V |
|
Source temperature: |
120 °C |
|
Desolvation temperature: |
450 °C |
|
Desolvation gas: |
800 L/hr |
|
Capillary voltage: |
0.5 kV |
Data Analysis
MSE data were processed using ProteinLynx Global Server 3.03 (PLGS) and searched against a reviewed and randomized UniProt Mus database with mAb and internal standard species appended. Peptide identification criteria included a mass accuracy threshold of 1 ppm and a minimum requirement of two peptides per protein.
Results and Discussion
The MSE (DIA) approach enables simultaneous qualitative protein identification and label-free Hi3 quantitative analysis4 allowing reporting of absolute amounts of detected HCP proteins from a sample spiked with standard proteins of a known concentration. By fragmenting all precursor ions without pre-selection, MSE achieves comprehensive peptide and fragment coverage, providing high sensitivity for detecting lower-abundance proteins.
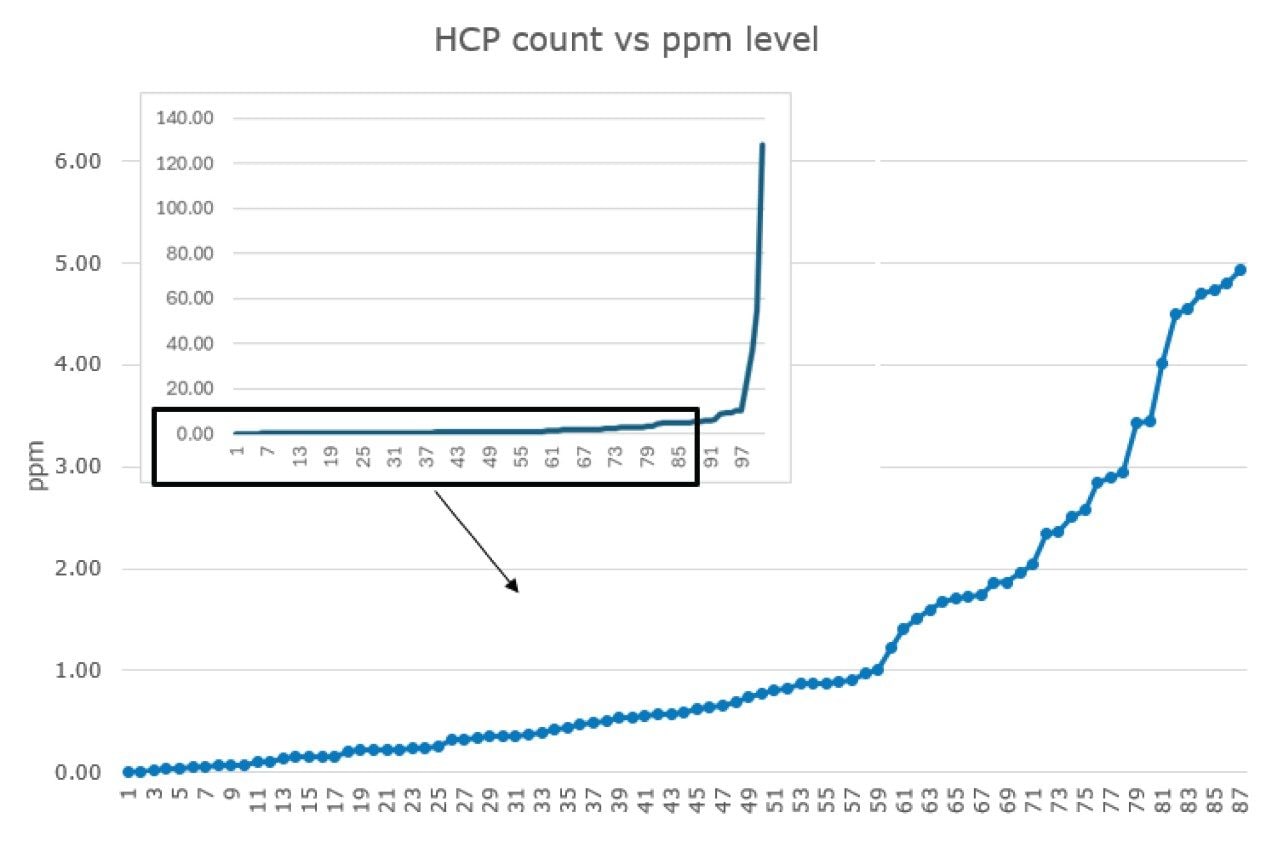
HCPs were identified based on a search criteria of two or more assigned peptides per protein, a peptide MS1 tolerance of 1 ppm and fragment MS2 tolerance of 3 ppm against a UniProt reviewed mouse database supplemented with the Waters MassPREP™ Standard and mAb sequences. Utilizing this search criteria, 101 HCPs were identified (Figure 2), reaching a lower detection limit of around 10 ppb and aggregate global HCP amount of 420 ng/mg. An extract of the HCPs identified and quantified across 4+ orders of magnitude is presented in Figure 2.
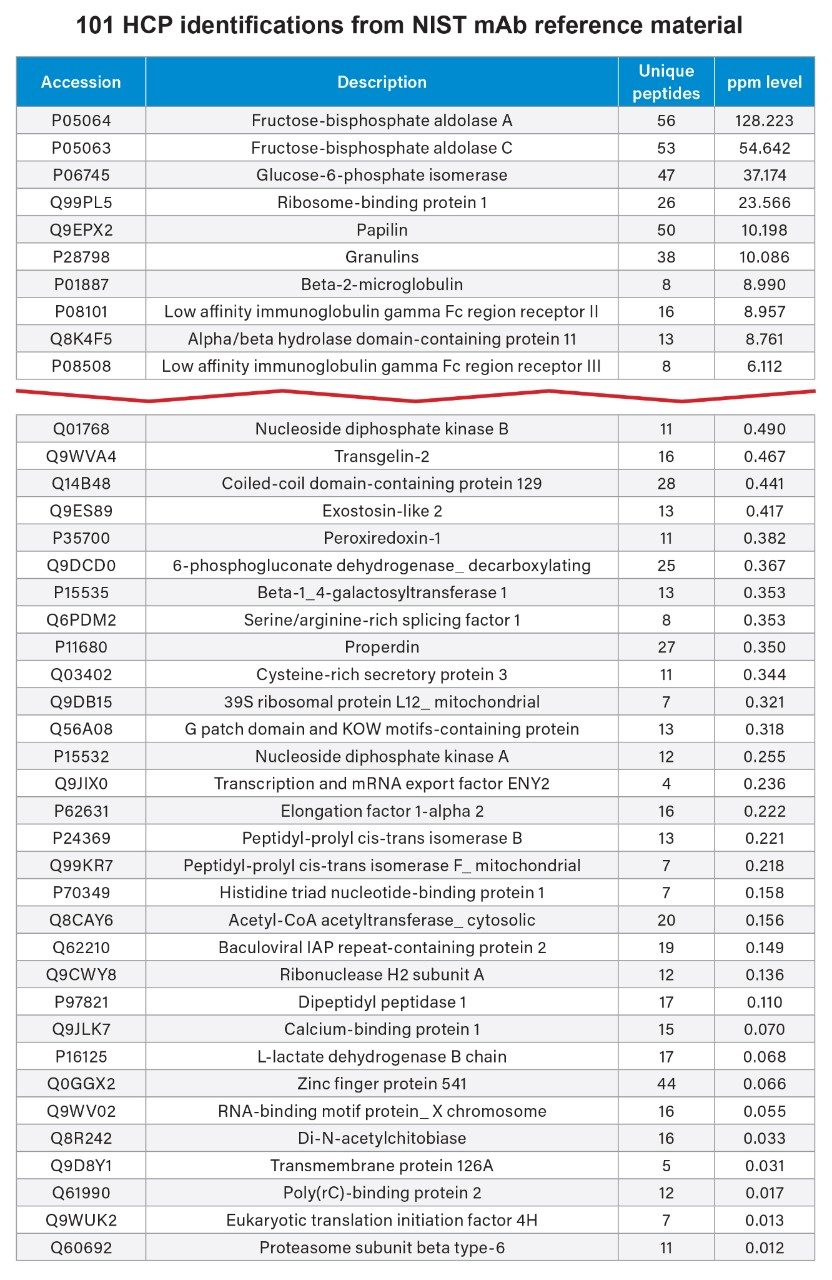
Out of the 101 identified HCPs in the NIST mAb sample, 58 were quantified at sub-ppm levels, showcasing the exceptional sensitivity of the Xevo MRT Mass Spectrometer (Figure 3). Utilizing MSE for analysis offers a comprehensive dataset for HCP identification. This method delivers high sequence coverage, supported by accurate mass fragmentation data, and precise quantification from MS1 peak integration, all from a single injection. The ability to consistently and reproducibly generate precursors and fragment data makes the MSE approach ideal for comparative studies across process steps, and trending across batches and processing conditions. The unbiased nature of MSE analysis ensures that even lower-abundance HCP peptides can be confirmed with characteristic fragments and unique peptides, enhancing the depth and reproducibility of HCP characterization.
HCP Quantitation in NIST mAb Reference Material
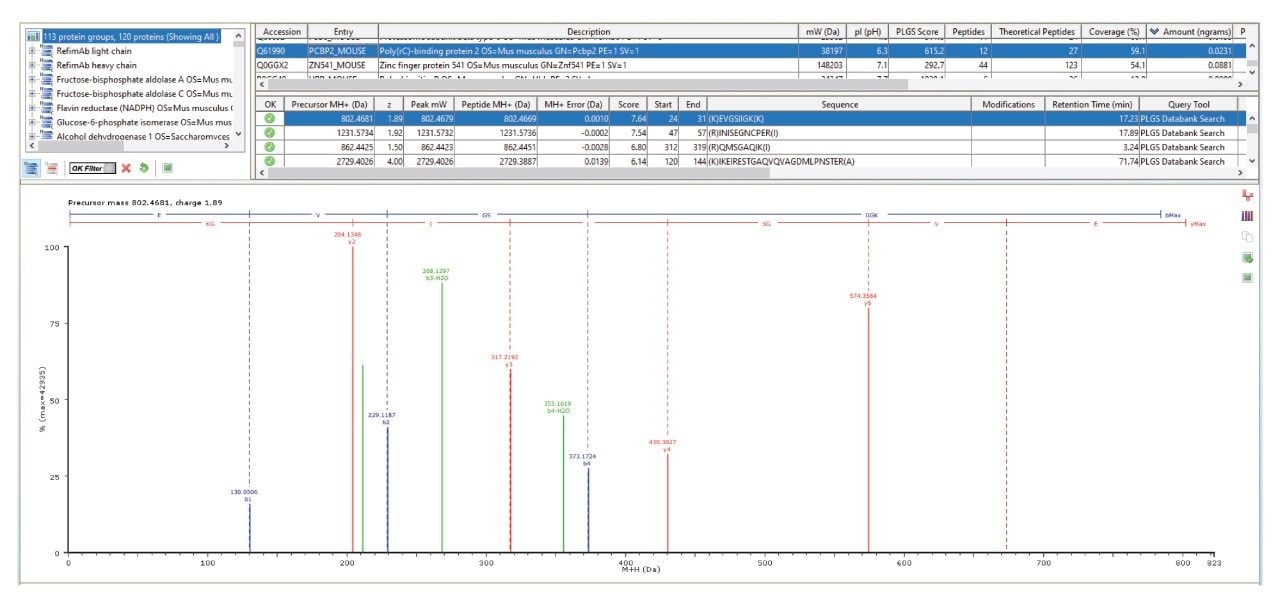
As illustrated in Figure 4, an HCP (Q61990 poly(rc)-binding protein 2 was quantified at approximately 16 ppb with high peptide fragmentation coverage and a high number of unique assigned peptides (12), resulting in 59% peptide level sequence coverage of the protein.
Protein, Peptide and Fragment Assignment
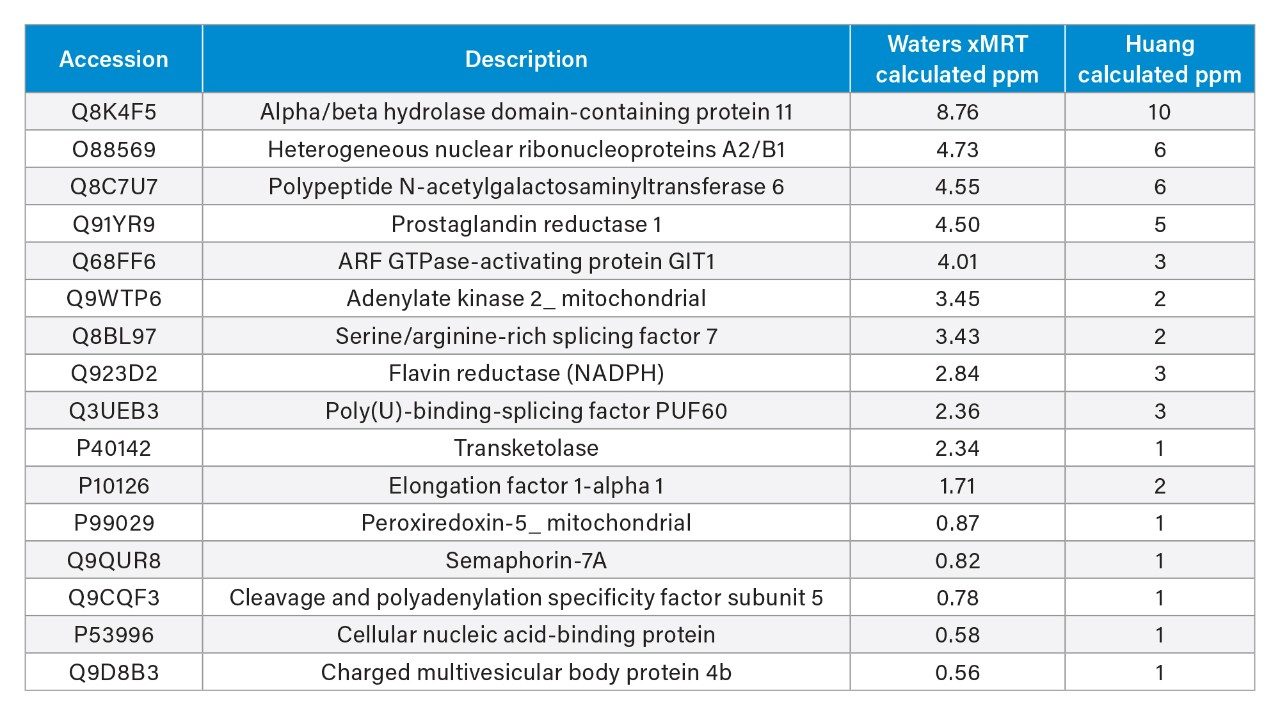
Despite the NIST mAb sample analyzed in this study that originated from different production batches to those previously reported in the literature (Huang et al), a strong correlation was observed in the relative quantitation (ppm) of the co-detected proteins, as illustrated in Figure 5.
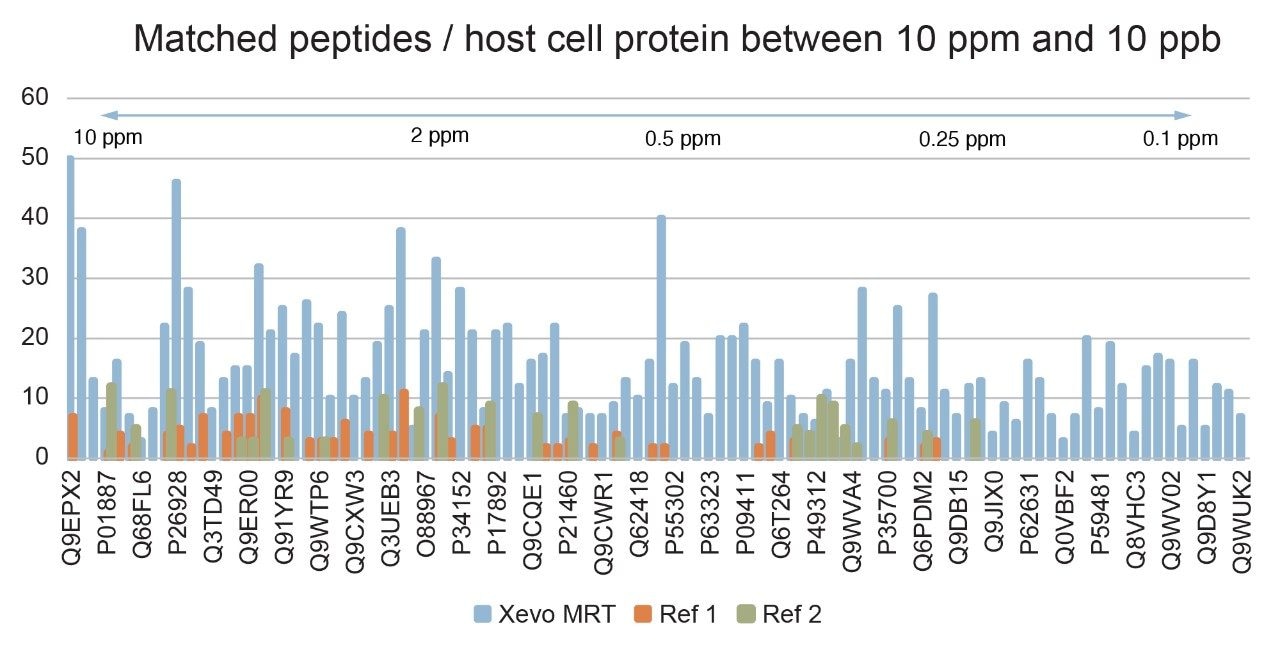
Quantification Results: Comparison with Huang et al.
The Xevo MRT Mass Spectrometer analysis identified a greater number of unique peptides for many HCPs compared to previous studies (Figure 6), enhancing confidence in both HCP protein identification and quantification. Additionally, Figure 6 demonstrates that a consistently high number of peptides were detected for each protein across the entire dynamic range of HCP levels in the sample, including HCPs at low parts-per-billion (ppb) concentrations. This extensive peptide coverage is essential for robust and confident HCP discovery and quantitation, particularly at lower abundance levels, and highlights the sensitivity of the LC-MS workflow (sample prep, analysis, separation/detection, and data analysis).
Conclusion
The Waters Xevo MRT Mass Spectrometer demonstrated the ability to discover and quantify HCPs in a murine derived NIST mAb sample from higher ppm to ~10 ppb levels from an analytical scale LC-MS experiment.
- Analysis of the NIST mAb reference sample identified and quantified 101 HCPs across 4+ orders of dynamic range from 128 ppm to 12 ppb levels using LC-MSE DIA analysis and the Hi3 quantification approach.
- Quantitation results aligned with previously published HCP analysis benchmarks conducted with this sample, validating method accuracy.
- Increased numbers of peptides per HCP protein identification were generated compared to these prior studies, with sustained higher peptide identifications and strong confirmatory fragmentation patterns down to lower ppb levels.
In summary, an analytical LC-MS workflow utilizing the Waters Xevo MRT Mass Spectrometer enables biotherapeutic developers to detect and quantify host cell proteins with greater sensitivity and accuracy than previous studies, enhancing product safety and allowing fast confident process development decisions.
References
- Doneanu, C. E., Gomes, A., Williams, B. J., Yu, Y. Q., & Chen, W. (2015). Enhanced detection of low-abundance host cell protein impurities in high-purity monoclonal antibodies down to 1 ppm using ion mobility mass spectrometry coupled with multidimensional liquid chromatography. Analytical Chemistry, 87(20), 10283–10291.
- Huang, L., Wang, N., Mitchell, C. E., Brownlee, T. J., Maple, S. R., & De Felippis, M. R. (2017). A Novel Sample Preparation for Shotgun Proteomics Characterization of HCPs in Antibodies. Analytical Chemistry, 89(10), 5436–5444.
- Claydon, A., Widdowson, P., & Williamson, A. (2020). Residual Host Cell Protein Analysis of NISTmAb: From Simplified Sample Preparation to Reliable Results (Application Note AN73412). Thermo Fisher Scientific.
- Wang H, Hanash S. Mass spectrometry-based proteomics for absolute quantification of proteins from tumor cells. Methods. 2015 Jun 15;81:34-40. doi: 10.1016/j.ymeth.2015.03.007. Epub 2015 Mar 17. PMID: 25794949; PMCID: PMC4678004.
720008961, July 2025