• Application Note

LipidQuan: A Rapid and Comprehensive Targeted Approach Investigating the Lipidome of Bladder Cancer Subjects

LipidQuan: A Rapid and Comprehensive Targeted Approach Investigating the Lipidome of Bladder Cancer Subjects

  • Nyasha Munjoma
  • Giorgis Isaac
  • Lee A. Gethings
  • Robert S. Plumb
  • Waters Corporation

For research use only. Not for use in diagnostic procedures.

Abstract

This application note describes the utilization of the LipidQuan workflow to provide a comprehensive and quantitative overview of example lipid species involved in the biomolecular processes associated with bladder cancer.

Benefits

  • Rapid quantification of ~500 lipids in plasma/serum
  • A robust and easy to deploy platform reducing method development and training costs, using Quanpedia
  • Improved identification and specificity of phospholipids using MRM transitions from the two fatty acyl chain fragments
  • Fast data processing and visualization using TargetLynx Application Manager and third-party informatics (i.e., Skyline) for maximum flexibility
  • Faster and cheaper than comparable workflow, enabling increased customer productivity

Introduction

Bladder cancer occurs when abnormal tissue growth develops within the bladder lining. About 10,000 people per year are diagnosed with bladder cancer and it is the 10th most common cancer in the U.K.1 Most new cases are diagnosed in people over 60 years of age with a history of smoking (more than one in three cases) or handling carcinogenic chemicals.1

Recent bladder cancer lipidomic studies suggest that a strict distribution pattern of lipid species and enzymes determine cell fate through regulatory mechanisms.2 For example, sphingomyelinase, an enzyme that catalyzes the breakdown of sphingomyelin (SM) into ceramides (Cer) and phosphorylcholine (PC), was shown to induce apoptosis by altering the balance between SM and Cer. Higher levels of SM have also been associated with drug resistance, possibly through alterations of membrane packing.2 LPC, PE, PI, and PS are also upregulated in various cancers.3,4

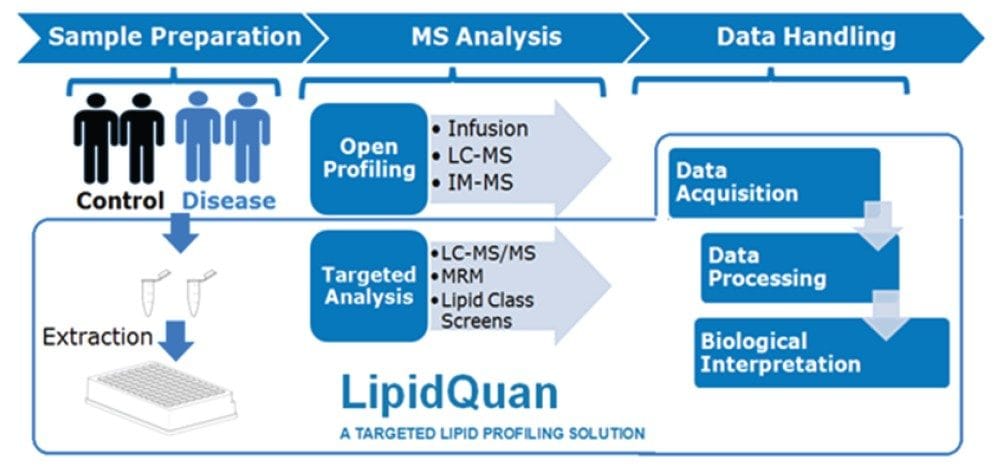
Although advances in mass spectrometry (MS) have allowed for more in-depth lipidomic analysis for research use, unambiguous identification and quantification has proven difficult as lipids exhibit a high number of isomeric and isobaric species. Here, we describe the utilization of the LipidQuan workflow5 (Figure 1) to provide a comprehensive and quantitative overview of example lipid species involved in the biomolecular processes associated with bladder cancer.

 General lipidomic workflow.
Figure 1. General lipidomic workflow used in most research laboratories, with the LipidQuan workflow highlighted.

Experimental

Samples

Plasma samples originating from 12 individuals were used for the study. These comprised of healthy controls (n=6) and bladder cancer diagnosed individuals (n=6).

Stable isotope labelled (SIL) standards (SPLASH LIPIDOMIX, Avanti Lipids, Alabaster, AL) spiked into pooled human plasma were used to generate calibration curves for quantification. In total, nine concentration levels were constructed, representing all the lipid classes contained within the SIL standard. High, middle, and low QC samples were prepared at 80%, 8%, and 1.275% of the highest concentration of the calibration curve.

Sample preparation

A simple sample preparation procedure was adopted using protein precipitation with pre-cooled isopropanol (IPA) spiked with the Odd Chain LIPIDOMIX (Avanti Lipids, Alabaster, AL), 1:5, plasma:IPA. Samples were mixed for one minute and placed at -20 °C for 10 minutes. Samples were vortex mixed again for one minute and placed at 4 °C for two hours to ensure complete protein precipitation. The extracted samples were centrifuged at a maximum of 10,300 g for 10 minutes at 4 °C before transferring the supernatant to Waters Total Recovery UPLC Vials (p/n: 186005669CV) for LC-MS analysis. Prepared samples were analyzed in duplicate for both ionization modes.

LC conditions

LC system:

ACQUITY UPLC I-Class or ACQUITY UPLC H-Class System (Fixed Loop (FL) or Flow Through Needle (FTN))

Column(s):

ACQUITY UPLC BEH Amide 2.1 × 100 mm, 1.7 μm

Column temp.:

45 °C

Flow rate:

0.6 mL/min

Mobile phase:

95:5 Acetonitrile/water + 10 mM Ammonium acetate (A) and 50:50 Acetonitrile/water + 10 mM Ammonium acetate (B)

Gradient:

0.1% to 20.0% B for two minutes, then 20% to 80% B for three minutes, followed by three minutes re-equilibration

Injection volume:

2 μL

Run time:

Eight minutes

MS conditions

MS systems:

Xevo TQ-XS, TQ-S, or TQ-S micro

Ionization mode:

ESI (+/-)

Capillary voltage:

2.8 kV (+) 1.9 kV (-)

Acquisition mode:

MRM

Source temp.:

120 °C

Desolvation temp.:

500 °C

Cone gas flow:

150 L/hr

Desolvation flow:

1000 L/hr

Nebulizer gas:

7 bar

Ion guide offset 1:

3 V

Ion guide offset 2:

0.3 V

Informatics

The Waters Targeted Omics Method Library (TOML) containing the LC conditions, MS method, and associated TargetLynx processing method (including retention times and MRM transitions) was used to generate these methods. The resulting data were processed using either TargetLynx or Skyline (MacCoss Lab Software, University of Washington). Statistical analysis was performed using SIMCA P+ (Umetrics, Umeå, Sweden) and further data interrogation conducted using Metaboanalyst.6

Results and Discussion

Targeted lipid analysis of plasma samples from individuals diagnosed with bladder cancer and healthy subjects was conducted using the LipidQuan platform. The samples were prepared for LC-MS using isopropanol to generate total extracts. The LipidQuan method package was downloaded from the Waters Targeted Omics Method Library (TOML) and imported in a matter of minutes. The Quanpedia method file included in the method package contained all the chromatographic settings and MRM transitions. Importing the method file pre-populated the system and eliminated manual input of LC-MS/MS settings and any potential transcription errors. Targeted LC-MS data were acquired in positive and negative ion electrospray modes using the LipidQuan platform. Samples were randomized and two technical replicates per sample acquired. Over 400 lipids were identified. Example chromatograms for both positive and negative mode data are shown in Figure 2.

Overlaid chromatograms representing the plasma screen for positive mode (A) and negative mode (B).
Figure 2. Overlaid chromatograms representing the plasma screen for positive mode (A) and negative mode (B).

Statistical analysis of the data revealed clear separation between the various cohorts. Unsupervised PCA models created using SIMCA P+ and MetaboAnalyst resulted in clustering of healthy controls and bladder cancer patient samples (Figure 3).

SIMCA P+ Score (A) and loadings plot (B) for an unsupervised PCA, pareto scaled model.
Figure 3. Multivariate statistical packages such as SIMCA P+ can be utilized to assess findings. SIMCA P+ Score (A) and loadings plot (B) for an unsupervised PCA, pareto scaled model (R2=0.93, Q2=0.911). (Note: The size of the plot markers correspond to the magnitude of the specific observation.)

The Q2 values were greater than 90%, showing the model created is predictive. A VIP scores plot, heatmap from PLS-DA models, and ANOVA/t-tests were generated using MetaboAnalyst (Figures 4 and 5). The top 15 VIP scores (Figure 4) revealed LPC, PC, and SM classes to be the main contributors to sample type clustering. Of the top 25 lipids, a decrease in the level of plasmalogens was observed as significant for bladder cancer patients (heatmap). The ANOVA/t-test, with 1% FDR (Figure 5), highlights lipid species with p-values greater than 0.05. Example chromatograms of these statistically significant peaks are overlaid to show potential for quantification.

A, Metaboanalyst VIP scores showing the top 25 most significant variables (lipids); B, Selected box plots of the most significant variables; and C, Hierarchical clustering of the top 25 lipids highlights.
Figure 4. Multivariate statistical packages such as SIMCA P+ or Metaboanalyst can be employed assess findings: A, Metaboanalyst VIP scores showing the top 25 most significant variables (lipids); B, Selected box plots of the most significant variables; and C, Hierarchical clustering of the top 25 lipids highlights the averaged differential expression across the three groups.
ANOVA/t-test with %1 FDR.
Figure 5. ANOVA/t-test with %1 FDR. Lipid species with P values greater than 0.05 are highlighted in pink. Some example chromatograms of highlighted peaks are included to illustrate potential for quantification. (Note: Most phospholipids use the fatty acyl MRM transitions to improve specificity.)

Quantification was achieved using calibration curves of plasma spiked with known concentrations of SIL standards prior to extraction. By using surrogate standards prepared and analyzed under identical conditions to those of endogenous lipids, the quantification of endogenous lipids within the same class was achieved. One caveat with regards to this method of quantitation is that MS detector responses for lipid species from the same class are reported to vary in intensity depending on the FA chain length.7 The use of a commercially available, premixed SIL solution per lipid class, rather than a SIL standard for each measured lipid, significantly reduces the overall cost of the study. Deuterated standards were used to assess linear response, with typical R2 values ranging from 0.97–0.99 for the various lipid classes in both modes of ionization. Figure 6 shows examples of the LPC, PC, and SM calibration curve generated using TargetLynx, as well as histograms of statistically significant endogenous lipids.

Selected quantitative data for (A) LPC R2 = 0.99, (B) PC +ve R2 = 0.99, and (C) SM R2 = 0.99 species.
Figure 6. Selected quantitative data for (A) LPC R2 = 0.99, (B) PC +ve R2 = 0.99, and (C) SM R2 = 0.99 species.

Ceramides, LPCs, PCs, and SM are differentially expressed in bladder cancer samples when compared to samples from healthy controls. However, some species, including plasmalogens and PEs, are elevated in control samples. Pathway analysis was conducted to provide biological context, revealing a number of components related to inflammation, oxidative, and immunity processes were identified as significant and associated with signalling, metabolic, and regulatory pathways.

Conclusion

  • A rapid, quantitative lipidomics method (LipidQuan) was downloaded and deployed for the analysis of plasma in a normal and bladder cancer comparative study.
  • The methodology allowed for the clustering of samples by phenotype using multi-variate statistical packages.
  • The method was shown to be linear over four orders of magnitude and had sufficient sensitivity to allow for the analysis of lipids at endogenous levels in human plasma.
  • Employing HILIC-based chromatography allowed lipids to elute according to class, thereby reducing the number of stable label isotope standards required for quantification (i.e., cost reductions).
  • LPCs, Cer, and SM were found to be over-expressed in bladder cancer samples compared to control samples.

References

  1. Bladder cancer overview (NHS) (downloaded Jan. 31, 2019).
  2. Lee. M. Y.; Yeon, A.; Shahid, M.; Cho, E.; Sairam, V.; Figlin, R.; Kim, K-H.; Kim, J. Reprogrammed Lipid Metabolism in Bladder Cancer with Cisplatin Resistance, Oncotarget. 2018, 9 (17), 13231–13243.
  3. Zhou, X.; Mao, J.; Ai, J.; Deng, Y.; Roth, M.R.; Pound, C.; Henegar, J.; Welti, R.; Bigler, S.A. Identification of Plasma Lipid Biomarkers for Prostate Cancer by Lipidomics and Bioinformatics, PLoS One. 2012, 7 (11).
  4. Perrotti. F.; Rosa, C.; Cicalini, I.; Sacchetta, P.; Del Boccio, P.; Genovesi, D.; Pieragostino, D. Advances in Lipidomics for Cancer Biomarkers Discovery, Int. J. Mol. Sci. 2016, 17 (12).
  5. Isaac, G.; Munjoma, N.; Gethings, L.; Plumb, R. LipidQuan for Comprehensive and High- Throughput HILIC-based LC-MS/MS Targeted Lipid Quantitation, Application Note – Waters Corporation (720006402EN, 2018).
  6. Chong, J.; Wishart, D.S.; Xia, J. Using MetaboAnalyst 4.0 for Comprehensive and Integrative Metabolomics Data Analysis. Current Protocolsin Bioinformatics. 2019, e86.
  7. Koivusalo, M.; Haimi, P.; Heikinheimo, L.; Kostiainen, R.; Somerharju, P. Quantitative Determination of Phospholipid Compositions by ESI-MS: Effects of Acyl Chain Length, Unsaturation, and Lipid Concentration on Instrument Response. Journal of Lipid Research. 2001, 42 (4), 663–72.

720006733, January 2020

Back To Top Back To Top