• Application Note

A Rapid, Kit-based Approach for LC-MS/MS Quantification of Apolipoprotein A1 in Plasma

A Rapid, Kit-based Approach for LC-MS/MS Quantification of Apolipoprotein A1 in Plasma

  • Hua Yang
  • Mary E. Lame
  • Sherri Naughton
  • Erin E. Chambers
  • Waters Corporation

For research use only. Not for use in diagnostic procedures.

Abstract

This work demonstrates the accurate and precise quantification of the endogenous protein, Apolipoprotein A1 in plasma. Using the ProteinWorks eXpress Direct Digest Kit with 3-step protocol, the total sample preparation time was under 1.5 hrs. Through direct digestion of 15 μL of plasma, quantification limits of 5–1500 μg/mL were achieved, while maintaining linearity, precision and accuracy. This method easily distinguishes 5 μg/mL changes in Apo A1 in rat plasma and changes of 75 μg/mL over the endogenous level in human plasma. We’ve demonstrated that using a simple kit-based approach can eliminate the need for method development and allow bioanalytical labs with limited experience to quickly generate robust, accurate and precise data.

Benefits

  • Rapid digestion time (<30 mins); Total sample preparation time under 1.5 hrs
  • Simple and standardized approach to biomarker/endogenous protein quantification
  • Excellent linearity, accuracy, and precision

Introduction

Apolipoprotein A1 (Apo A1) protein is a major component of High Density Lipoprotein (HDL) in plasma. Along with other lipoproteins, Apo A1 plays a key role in lipid metabolism.1 While typical levels of Apo A1 are >1.2 mg/mL for males and >1.4 mg/mL for females,2 reduced plasma concentrations of Apo A1 have been reported in patients at risk for certain types of heart disease.3–6 In addition, in Tangier Disease, which is characterized by a severe reduction in the amount of HDL, Apo A1 plasma concentration is only ~ 1% of those in normal subjects,7 that is, in the tens of microgram per mL range. Thus, measurements of Apo A1, and other lipoproteins are of high interest as potential biomarkers for cardiovascular disease. Traditionally, proteins have been quantified using ligand binding assays (LBAs). However, these immunoassays suffer from problems such as cross-reactivity, long antibody development time, reagent reliability, etc.

Advances in MS and bioanalytical methods have led to a rapid expansion in the area of MS-based biomarker quantification.8–10 In addition, LC-MS avoids common LBA shortcomings. In this application note, we showed a fast and standardized kit-based approach that is capable of quantifying Apolipoprotein A1 accurately and reproducibly in plasma.

Experimental

Sample preparation

Apolipoprotein A1 digestion time course studies:
Human Apo A1 was spiked into rat plasma at a concentration of 1 mg/mL. 15 μL aliquots of the Apo A1 plasma samples were then digested using the ProteinWorks eXpress Direct Digest Kit and 3-step protocol (no reduction and alkylation). Several digestion time points in plasma (5–60 min) were taken to assess digestion performance for the various signature peptides of Apo A1. Subsequent samples were then analyzed by LC-MS.

Quantification of Apo A1 in plasma:
To prepare calibration standards and quality control (QC) samples, various concentrations of human Apo A1 were spiked into rat or human plasma. Stable isotopically labeled Apolipoprotein A1 was used as internal standard (IS). Plasma samples (15 μL) were directly digested (30 min) using the ProteinWorks eXpress Direct Digest kit and the 3-step protocol (no reduction and alkylation).

Method conditions

LC system:

ACQUITY UPLC System

Detection:

Xevo TQ-S Mass Spectrometer, ESI+

LC conditions

Column:

ACQUITY UPLC Peptide BEH C18, 300Å, 1.7 μm, 2.1 mm x 150 mm

Column temp.:

55 °C

Sample temp.:

10 °C

Injection volume:

10 μL

Mobile phase A:

0.1% formic acid in water

Mobile phase B:

0.1% formic acid in acetonitrile

Gradient:

Flow rate (mL/min)

Time(min)

%A

%B

Curve

0.3

0.0

100

0

6

0.3

1.0

100

0

6

0.3

7.0

50

50

6

0.3

8.0

10

90

6

0.3

8.8

10

90

6

0.3

9.0

100

0

6

0.3

15.0

100

0

6

MS conditions

Capillary:

3 kV

Cone (V):

Optimized for individual peptides, see Table 1

Source offset):

50 V

Source temp. (°C):

150 °C

Desolvation temp.:

600 °C

Cone gas flow:

150 L/hr

Desolvation gas flow:

1,000 L/hr

Collision gas flow:

0.15 mL/min

Nebuliser gas flow:

7 Bar

Data management:

MassLynx(v4.1)

Results and Discussion

Apolipoprotein A1 (Apo A1), a 28 kDa protein, (Figure 1),11 has become an important biomarker for predicting cardiovascular risk.2–7 As a result, there is growing interest in developing and implementing improved tools for its quantification. Using the ProteinWorks Direct Digestion Kit and protocol, unpurified plasma (15 μL) containing Apo A1 was directly digested. LC-MS/MS quantification of signature peptides was performed using a Xevo TQ-S triple quadrupole MS. MRM transitions of the four Apo A1 tryptic peptides are listed in Table 1. These peptides were chosen based on the literature8 and were optimized for their signal intensity and specificity. Chromatographic separation of Apo A1 peptides was achieved using an ACQUITY UPLC Peptide BEH C18, 300Å, 1.7 μm, 2.1 mm x 150 mm Column. Representative chromatograms in rat and human plasma are illustrated in Figure 2, Panels A and B, respectively. Due to high endogenous Apo A1 concentration in human plasma, the peptide signal is much higher than the signal in rat plasma. The corresponding internal standards elute at the same retention time as the native peptides (data not shown).

Amino acid sequence of human apolipoprotein A1
Figure 1. Amino acid sequence of human apolipoprotein A1. Tryptic peptides used for quantification are highlighted in blue.
Final MS conditions for apolipoprotein A1 tryptic peptides
Table 1. Final MS conditions for apolipoprotein A1 tryptic peptides used for quantification.
 Representative chromatograms of the Apo A1 tryptic peptides
Figure 2. Representative chromatograms of the Apo A1 tryptic peptides in rat (A) and human (B) plasma using the ACQUITY UPLC Peptide BEH C18 , 300Å, 1.7 μm, 2.1 mm x 150 mm Column.

To evaluate Apo A1 digestion efficiency over time, plasma samples (15 μL) containing 1 mg/mL of human Apo A1 were digested using the ProteinWorks eXpress Direct Digest Kit and 3-step protocol. At various time points, an aliquot of sample was quenched and the resulting Apo A1 tryptic peptides were analyzed by LC-MS. The tryptic peptide signals were normalized to the 5 minute time point.

For all 4 signature peptides, the analyte peak areas stabilized within 15 minutes (Figure 3), indicating quantification of Apo A1 can be done by digesting the protein for a very short period of time (~15–30 minutes).

Apo A1 digestion time-course
Figure 3. Apo A1 digestion time-course. Responses for Apo A1 tryptic peptides are plotted against the length of digestion time in rat plasma. For all 4 signature peptides, the signals stabilized within 15 minutes.

For quantification, calibration and QC samples were prepared by fortifying rat or human plasma with human Apo A1 protein at various concentrations and IS was then added to each sample. Each calibration standard level was prepared in duplicate, while each QC was prepared in triplicate (rat plasma) or in quadruplicate (human plasma). Plasma samples were then digested (30 minutes) using the ProteinWorks eXpress Direct digest kit according to the generic 3-step protocol included in the kit. Finally, digested samples were analyzed by LC-MS. Peak area ratios (PARs) of the analyte peak area to the IS peak were calculated and calibration curves for the four tryptic peptides were constructed using PARs of the calibration samples by applying a one/concentration2 (1/x2) weighted linear regression model. All QC sample concentrations were then calculated from their PARS against the calibration curve. For all 4 tryptic peptides, Apo A1 calibration curves in rat and human plasma were linear with R2 values of >0.98, and mean accuracy of the data points >99%. A summary of standard curve performance in rat and human plasma is shown in Tables 2, Panels A and B, respectively.

 Linear dynamic range and standard curve statistics for the Apo A1
Table 2. Linear dynamic range and standard curve statistics for the Apo A1 tryptic peptides in rat plasma (A) and human plasma (B) used for quantification. Plasma samples were digested and extracted using ProteinWorks eXpress Direct Digest Kit.

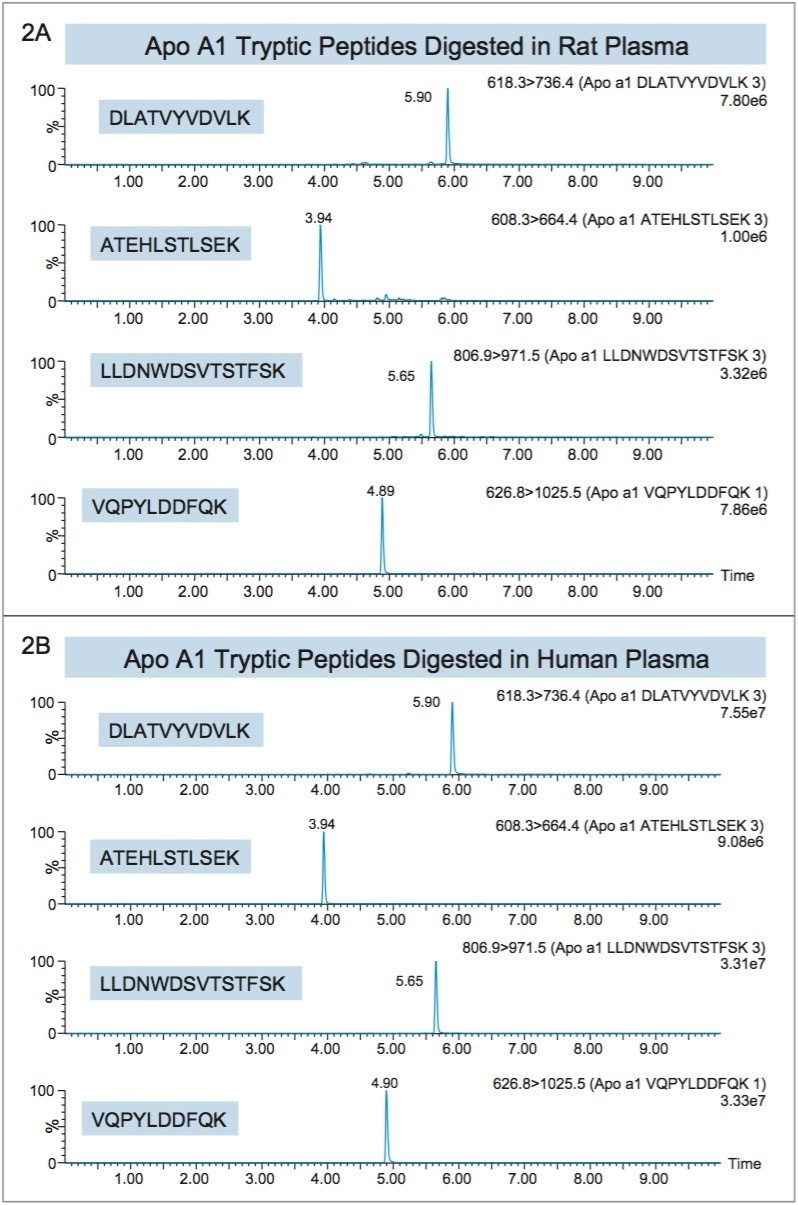
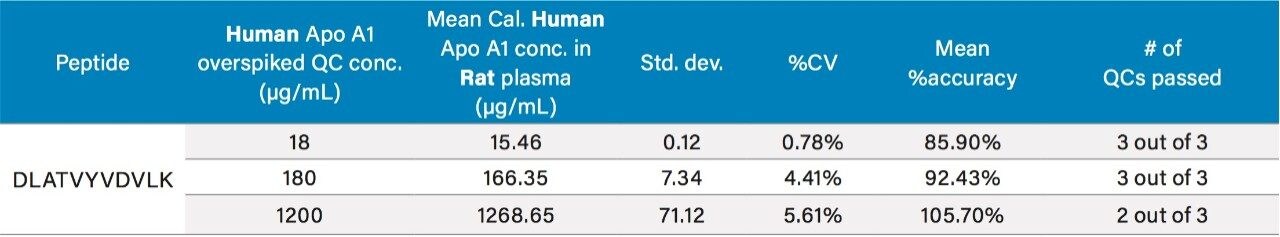
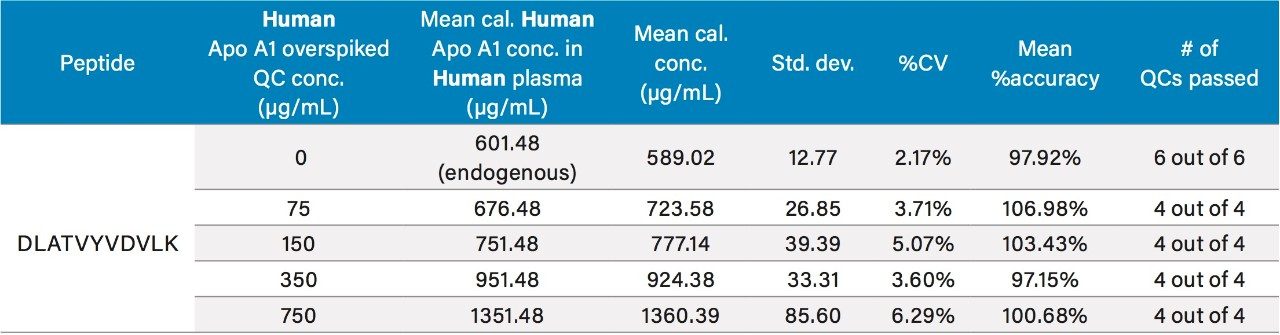
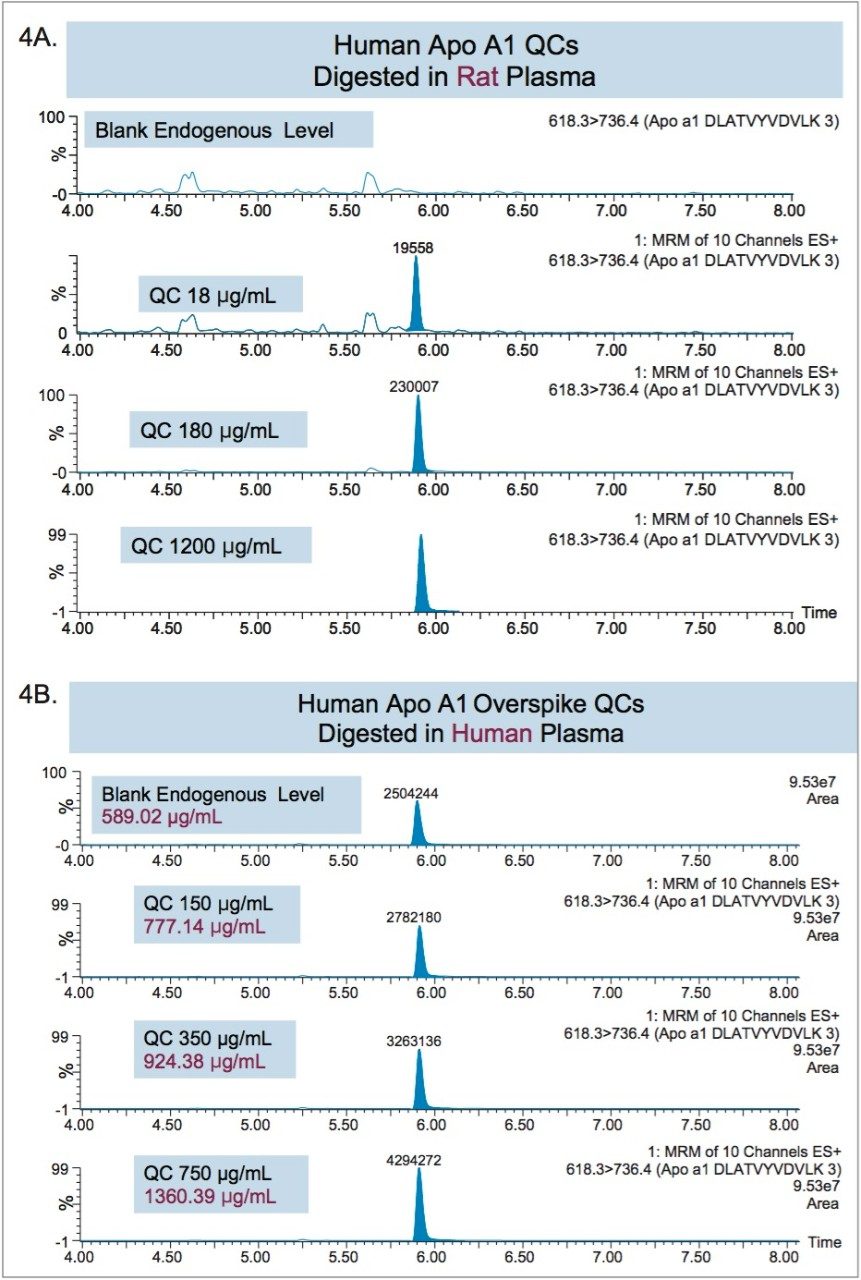
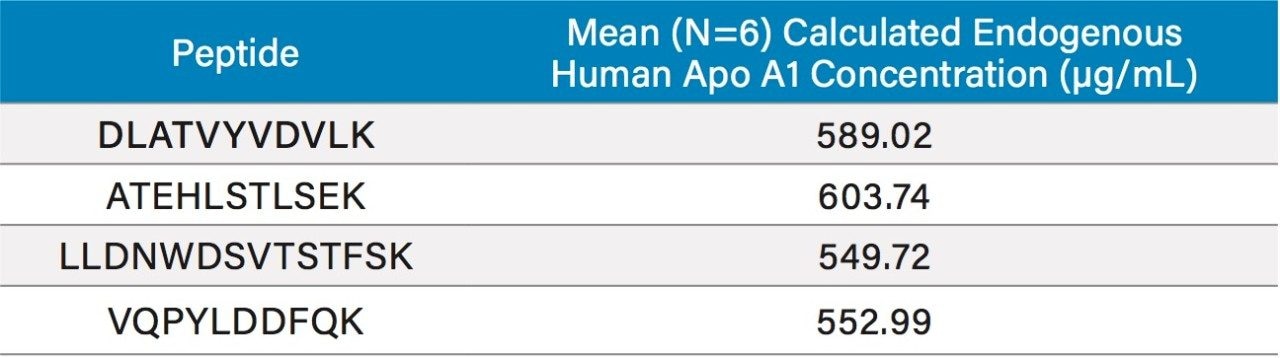
Due to the presence of endogenous Apo A1 in human plasma, the method of standard addition was used for quantification. In this case, the slope and y-intercept from the individual tryptic peptide calibration curves were used to calculate the endogenous Apo A1 concentrations (x-intercept). The calculated endogenous concentration of Apo A1 was then added onto the spiked concentration of Apo A1 in the standard and QC samples to enable accurate assessment of Apo A1 in the human plasma. For all four tryptic peptides, standard curves in plasma were accurate and precise from 5–1500 μg/mL (rat) and 100–1000 μg/mL (human). This is illustrated in Tables 2A and 2B, respectively. The detection limit is estimated to be in the 2.5–5 μg/mL range. At all QC levels, in both rat and human plasma, QC samples demonstrated accuracy and precision with CVs ≤15%. QC performance for the DLAT tryptic peptide in rat and human plasma is highlighted in Tables 3 and 4, respectively, and is illustrated in Figure 4, Panels A and B, respectively. For the blank rat plasma digest, there is no detection of the human Apo A1 peptide (rat Apo A1 amino acid sequence is different than human Apo A1 sequence); while in human plasma blank digest, there is a strong signal of the human Apo A1 peptide, due to the high concentration of endogenous Apo A1 in human plasma. For the DLAT, ATEH, LLDN and VQPY tryptic peptides, mean endogenous levels of Apo A1 in human plasma were determined to be 589.02, 603.74, 549.72, and 552.99 μg/mL, respectively (Table 5). These values are lower than the typical reported levels (>1.2 mg/ml for males and >1.4 mg/ml for females).2 Sub-optimal pre-analytical collection and storage of the plasma samples could be a plausible explanation for the lower endogenous plasma concentrations observed herein. It has been reported that pre-analytical sample collection and storage can affect the stability of Apo A1 in plasma. For example, Pasella et al. found that Apo A1 decreases in abundance when stored at 4 °C for 13 days.12 The fact that the commercially available plasma that was used in this application was stored at 4 °C for more than 2 weeks supports the above hypothesis. Regardless, our method demonstrates excellent accuracy and precision for Apo A1 quantification, with a dynamic range which is well-suited for measuring Apo A1 levels in both normal and disease conditions.

QC sample statistics
Table 3. QC sample statistics for the DLAT tryptic peptides used to quantify Apo A1 in rat plasma.
QC sample statistics for the DLAT tryptic peptides
Table 4. QC sample statistics for the DLAT tryptic peptides used to quantify Apo A1 in human plasma.
QC chromatograms for the DLAT tryptic peptide of Apo A1
Figure 4. QC chromatograms for the DLAT tryptic peptide of Apo A1 in rat (A) and human (B) plasma.
Calculated endogenous Apo A1 concentrations
Table 5. Calculated endogenous Apo A1 concentrations in human plasma for the various tryptic peptides of Apo A1.

Conclusion

This work demonstrates the accurate and precise quantification of the endogenous protein, Apolipoprotein A1 in plasma. Using the ProteinWorks eXpress Direct Digest Kit with 3-step protocol, the total sample preparation time was under 1.5 hrs. Through direct digestion of 15 μL of plasma, quantification limits of 5–1500 μg/mL were achieved, while maintaining linearity, precision and accuracy. This method easily distinguishes 5 μg/mL changes in Apo A1 in rat plasma and changes of 75 μg/mL over the endogenous level in human plasma. We’ve demonstrated that using a simple kit-based approach can eliminate the need for method development and allow bioanalytical labs with limited experience to quickly generate robust, accurate and precise data.

References

  1. Wasan et al., Nature Reviews Drug Discovery, 7(1), 84–99, 2008.
  2. Apolipoprotein A1, plasma values. May 25, 2016 from http://www.mayomedicallaboratories.com/ test-catalog/Clinical+and+Interpretive/80309
  3. Genest et al., JACC, 1992, Vol. 19, No.4, 792–802.
  4. Dawar et al., International J. Pharma and Bio Sciences, 2010, V1(2), Biological Science, No. 43.
  5. Ashmaig et al., J Vasc Bras. 2011, 10(4): 293–297.
  6. Shilpasree et al. J Clin Diagn Res., 2013, 7(7): 1303–1306.
  7. Schaefer et al., N Engl J Med, 1978, 299,:905–910.
  8. Wang et al., Bioanalysis, 2015, Vol. 7, No. 22, 2895–2911.
  9. Lassman et al., Rapid Commun. Mass Spectro. 2012, 26, 101–108.
  10. Agger et al., Clin. Chem., 2010, 56(12), 1804–1813.
  11. UniPro, (23Jan2007). UniProtKB – P02647 (APOA1_HUMAN). Primary accession number:P02647. Retrieved from http://www.uniprot.org/uniprot/P02647
  12. Pasella et al., Proteome Science 2013, 11:10.

720005777, August 2016

Back To Top Back To Top