In this application note, ACQUITY UPC2 and tandem quadrupole mass spectrometry were used for the trace level enantio-analysis of five triazole fungicides in wheat grain and/or wheat straw. A QuEChERS extraction modified for dry commodities was performed followed by solid phase extraction using Oasis MCX.
The safe use of crop protection products is of paramount importance to the agricultural chemicals manufacturing industry. Extensive studies and trials are carried out in support of product registration. These studies ensure that any risks associated with using the product are characterized and properly understood so that it can be safely applied to the field. When a crop protection active ingredient (AI) contains one or more stereogenic centers in its structure the enantioselective behavior must be studied, since it is known that enantiomers can exhibit different bioactivities.1,2 Analytical methods used to evaluate the influence of stereochemistry on the degradation dynamics, environmental fate, and final residue levels help to establish a more accurate risk assessment of crop protection products.
Liquid chromatography (LC) on chiral stationary phases (CSPs), such as polysaccharide stationary phases including amylose and cellulose, has been the most commonly used chiral separation technique.3-6 More recently, there has been an increasing adoption of using supercritical fluid chromatography (SFC) on CSPs for chiral separation.7,8 The properties of a supercritical fluid, its high diffusivity and low viscosity in particular, enable high efficiency chiral separations with shorter run times. For example, triazole fungicides, such as tebuconazole, structure shown in Figure 1, are a commonly used group of pesticides due to their potent activity against a broad spectrum of crop diseases. Using HPLC, the analysis times for the enantiomeric resolution of tebuconazole ranged from 13 to 45 min.3-6 Similar resolutions were achieved for tebuconazole using SFC, but the analysis times were reduced to 10 min.8
UltraPerformance Convergence Chromatography (UPC2) applies the performance advantages of UPLC to SFC, combining the use of supercritical CO2 with sub-2-μm particle columns.9,10 UPC2 is an orthogonal analytical technique to reversed-phase LC and can be used to solve complex separations challenges. The detection sensitivity and specificity offered by tandem MS/MS is advantageous for determining trace levels of pesticides in complex matrices like field crops or soil.11-14
In this application note, ACQUITY UPC2 and tandem quadrupole mass spectrometry were used for the trace level enantioanalysis of five triazole fungicides (Figure 1) in wheat grain and/or wheat straw. A QuEChERS (quick easy cheap effective rugged and safe) extraction modified for dry commodities was performed followed by solid phase extraction using Oasis MCX. Chiral separations using a 3.0 μm chiral CSP followed by multiple reaction monitoring (MRM) detection allowed concentrations of part per trillion (ppt) levels to be reproducibly detected and quantified.
SFC system: |
ACQUITY UPC2 |
Chiral separation: |
Diniconazole, fenbuconazole, flutriafol, tebuconazole |
Column: |
Chiralpak IA-3, 4.6 x 150 mm, 3.0 μm |
Co-solvent (B): |
Methanol with 2% water and 0.1% formic acid |
ABPR: |
1990 psi/137 bar |
Flow rate: |
2.5 mL/min |
Column temp.: |
40 °C |
Injection volume: |
4 μL |
UPC2 conditions: |
0 min 20% B, 2.5 min 20% B, 2.6 min 30% B, 5 min 30% B, return to initial conditions. |
Chiral separation: |
Uniconazole |
Column: |
Chiralpak IA-3 4.6 x 150 mm, 3.0 μm |
Co-solvent (B): |
50:50 2-propanol/ethanol with 2% water and 0.1% formic acid |
ABPR: |
1990 psi/137 bar |
Flow rate: |
2.5 mL/min |
Column temp.: |
15 °C |
Injection volume: |
4 μL |
UPC2 conditions: |
0 min 15% B, 4 min 15% B, 4.1 min 35% B, 5 min 35% B, return to initial conditions. |
MS system: |
Xevo TQ-S |
Ionization mode: |
ESI+ |
Capillary voltage: |
2.8 kV |
Cone voltage: |
See Table 1 |
Desolvation temp.: |
600 °C |
Source temp.: |
150 °C |
Collision energy (eV): |
See Table 1 |
MS scan range: |
100 to 800 m/z |
An AgileSLEEVE 30 cm x 1/16” I.D. tubing heater (Analytical Sales and Services Inc. Pompton Plains, NJ) set to 65 °C was used to heat the transfer line to the MS system. All compounds were automatically tuned by direct infusion using IntelliStart prior to the analysis. A summary of the optimized MRM transitions and voltages is shown in Table 1.
All separations were performed on a Waters ACQUITY UPC2 System. Detection was by positive ion electrospray mass spectrometry (MS) using a Xevo TQ-S tandem quadrupole mass spectrometer. MassLynx Software was used for data acquisition, and TargetLynx Application Manager was used for data processing.
Triturated wheat straw (1 g) or wheat grain (5 g) were placed in a 50-mL polypropylene centrifuge tube. The volume of water added to the wheat straw was 9 mL with 5 mL of water added to the wheat grain, followed by phosphoric acid (100 μL) and acetonitrile (10 mL). The mixture was shaken for 20 minutes. A DisQuE Pouch for the European Committee for Standardization (CEN) QuEChERS method (Part No. 186006813) was added to the tube and shaken vigorously for 1 minute. Centrifugation at 4000 rpm followed to produce a liquid partition with a clear acetonitrile top layer. The top acetonitrile layer (5 mL) was transferred to a clean 50-mL centrifuge tube and diluted with water (45 mL) for cleanup using an Oasis MCX 3 cc, 60 mg Cartridge (Part No. 186000254).
Oasis MCX 3 cc, 60 mg Cartridges were conditioned with 3 mL of methanol and equilibrated with 3 mL of water. The samples were loaded in reverse phase mode into Sep-Pak 60 cc Reservoirs (Part No. 186005587) at a flow rate of 1 to 3 mL/min. After sample loading was completed the cartridge was washed with 2% formic acid in water (3 mL) followed by 100% methanol (3 mL). A collection vessel was installed and elution was achieved using 2 mL 2% ammonium hydroxide in methanol. The base containing eluent from the elution step was blown down to dryness and reconstituted in neat methanol (5 mL).
Working standard solutions were prepared by sequential dilution of the stock solution using acetonitrile. The working standards were spiked (in triplicate) on to the dry wheat straw/wheat grain at levels of 1, 5, and 10 ng/g. The samples were allowed to equilibrate for 30 min prior to extraction. Matrix-matched standard curves were prepared with blank matrix extracted using the same protocol.
Wheat straw and wheat grain samples were obtained from online vendors.
A Chiralpak IA-3, 4.6 x 150 mm, 3.0 μm was used to perform enantioseparation of the five triazole fungicides. Resolution was achieved for diniconazole, fenbuconazole, flutriafol, and tebuconazole using methanol as the co-solvent; while the chiral resolution of uniconazole was improved using a mixture of ethanol and 2-propanol (50:50 v/v). Water (2%) and formic acid (0.1%) were added directly to the co-solvents to promote ionization. A chromatogram of wheat grain directly spiked at a level of 1 ng/g and extracted using QuEChERS followed by sample cleanup using Oasis MCX is shown in Figure 2. All triazole AI’s were enantiomerically resolved in less than 3.5 minutes. The United States Pharmacopeia (USP) resolution (Rs) ranged from 1.73 to 6.83.
The five triazole fungicides were post spiked into the wheat grain and/or wheat straw extracts. The spiked extracts were sequentially diluted with blank matrix extract to produce a series of matrix-matched curves and QC samples ranging in concentration from 0.005 to 50 ng/ mL. Examples of the quantitation curves for each flutriafol enantiomer spiked into blank wheat grain extract, and for the fenbuconazole enantiomers spiked into blank wheat straw extract are shown in Figures 3 and 4 respectively. Linear calibration curves (R2 >0.998) for each enantiomer of the target fungicides were obtained.
To assess the accuracy of the method, quality control (QC) samples were made up in the blank extracted matrices at four concentration levels: 0.016, 0.16, 1.66, and 16.66 ng/mL. Three concentration levels were analyzed against the curves. The calculated concentrations for the QC samples were within +/- 15% of the known concentration for each enantiomer in both the wheat and straw matrices.
Examples of the blank, 0.01 ng/mL and 0.05 ng/mL level for all compounds spiked into extracted wheat grain matrix are shown in Figure 5.
The precision of the technique was determined by a repeatability study (n=4) using four concentration levels 0.05 ng/mL, 1 ng/mL, 5 ng/mL, and 10 ng/mL of matrix-matched wheat grain standards, as shown in Table 2.
Internal standards were not available for the study; however the RSD’s ranged from 0.6% to 3.9%. These results illustrate the reliability of the method reproducibility over a range of concentration levels.
A series of standard solutions was prepared in methanol at the same concentration levels as the matrix-matched curves. The analyte response and slopes from both curves were compared. The matrix effects were calculated to within +/- 10% for each enantiomer of the target fungicides.
The average extraction recoveries from three samples fortified at 1 ng/g, 5 ng/ g, and 10 ng/g (n=3) in wheat were calculated. Recoveries in excess of 75% were obtained for each enantiomer of the pesticides analyzed in the study.
Depending on the chromatographic conditions target analytes can co-elute with endogenous matrix components which can lead to matrix effects and decreased method robustness. The Xevo TQ-S employs a proprietary scanning technology known as RADAR from which full scan (MS) and MRM (MS/MS) data can be acquired simultaneously. RADAR provides a convenient way to monitor the background matrix using its full-scan MS function. Co-eluting components can be identified at an earlier stage of the method development process.
In addition Product Ion Confirmation Scan (PICs) can be activated, which facilitate the collection high quality full-scan spectra during MRM acquisition, and provide an additional means of chromatographic peak identification based on MS or MS/MS spectra. Activated by a single check box in the method editor, PICS automatically triggers a product ion scan when a peak is detected by MRM.
During method development for the analysis of fenbuconazole enantiomers in wheat straw the RADAR and PICs chromatograms shown in Figure 6 were acquired simultaneously with the MRM function. Peak 1 in the MRM chromatogram was isobaric (m/z 337) with fenbuconazole and shared a common fragment. Enantiomers were differentiated using the MS/MS PIC spectrum. The RADAR data acquired simultaneously identified components eluting closely to the analytes (Peaks 2 and 3). Changes were made to the SPE cleanup and isocratic elution was employed, which resulted in a lower spectral background and the removal of closely eluting matrix components.
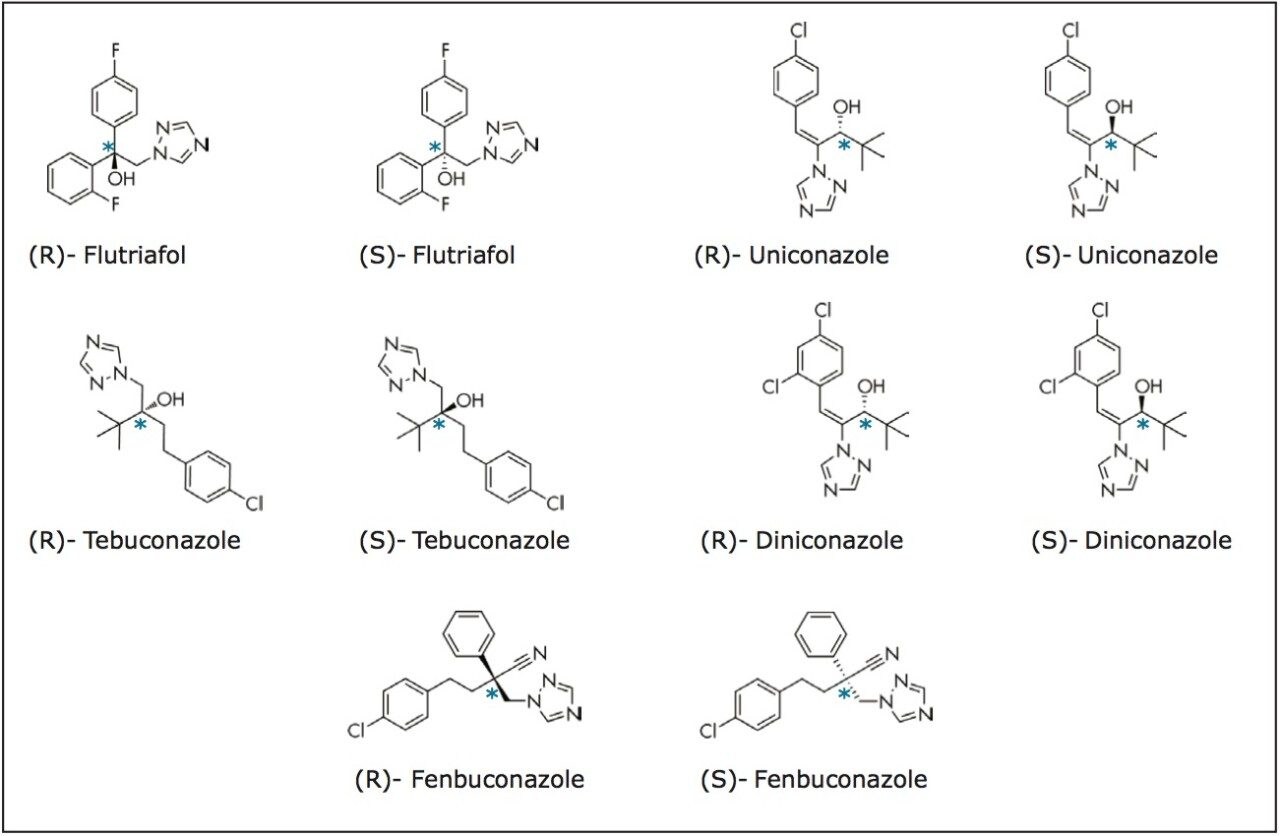
The study of pesticide enantiomers is important as they can exhibit different bioactivities. Analytical methods that can rapidly provide information about each enantiomer at trace concentration levels can lead to a more accurate assessment of the influence of stereochemistry on the degradation dynamics, environmental fate, and final residue levels of crop protection chemicals.
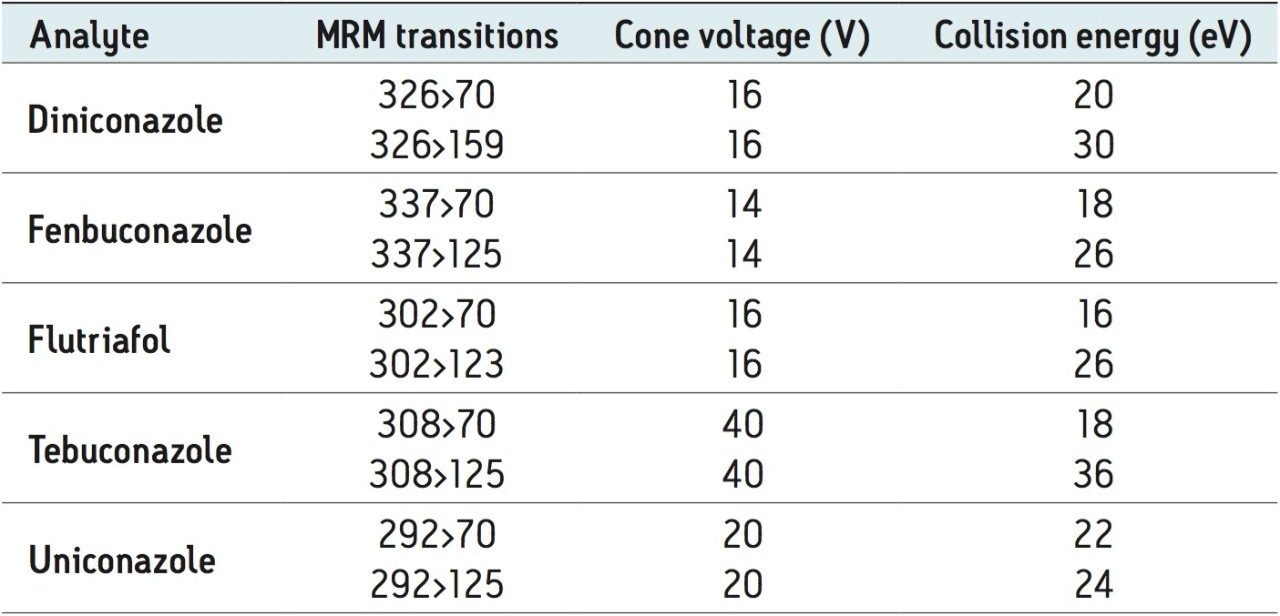
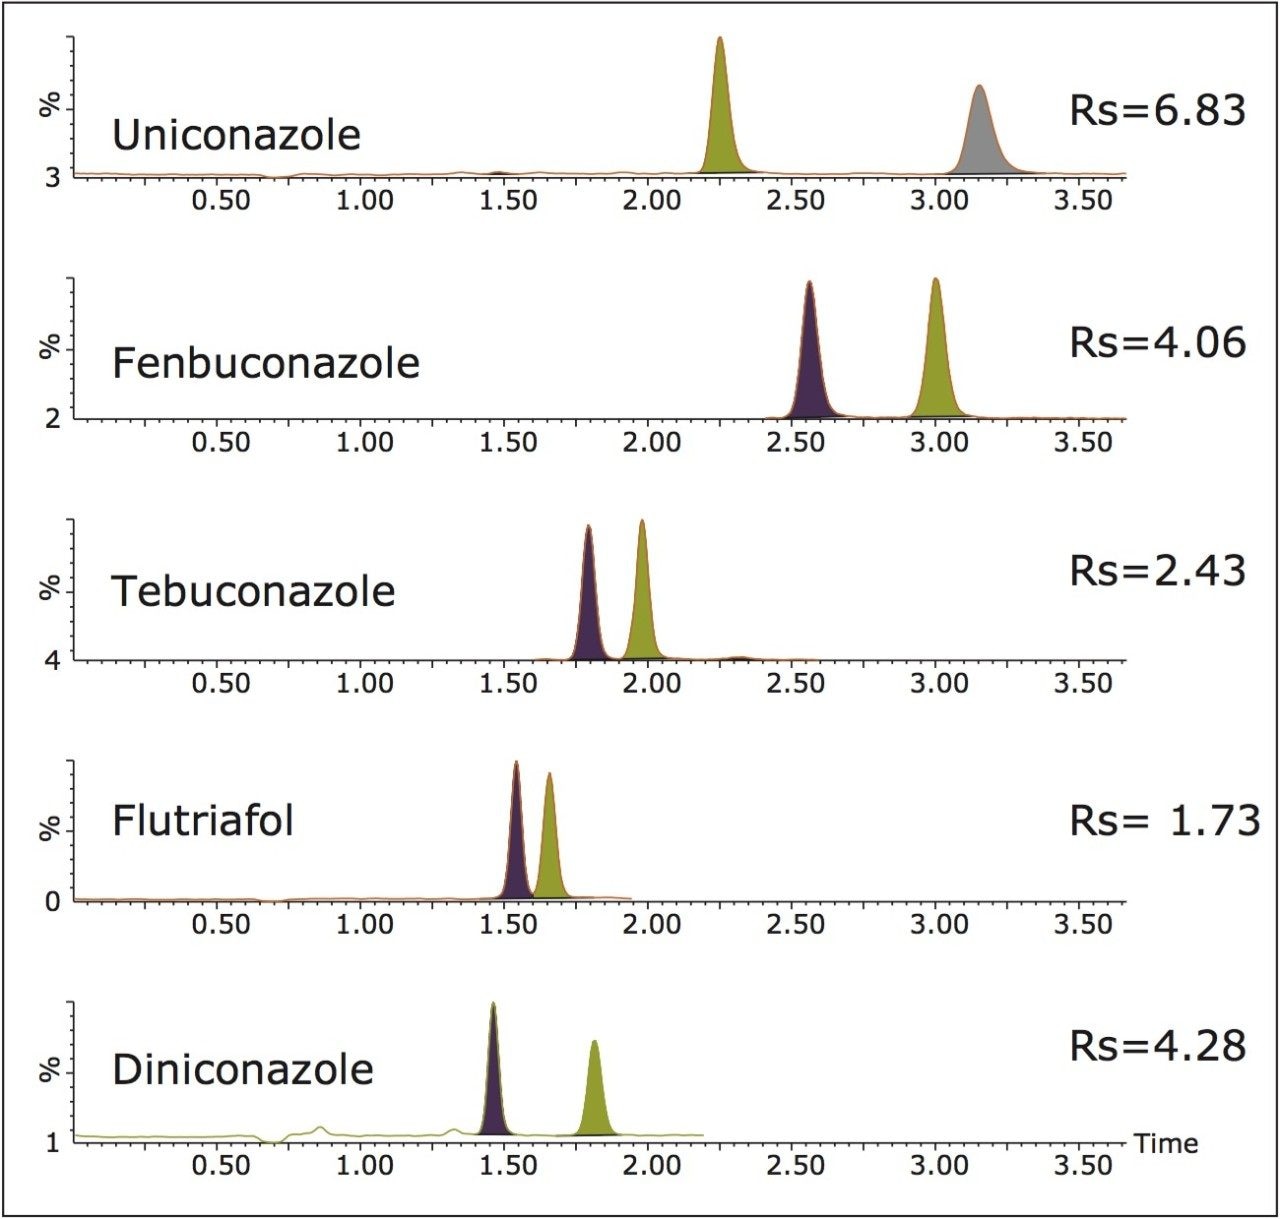
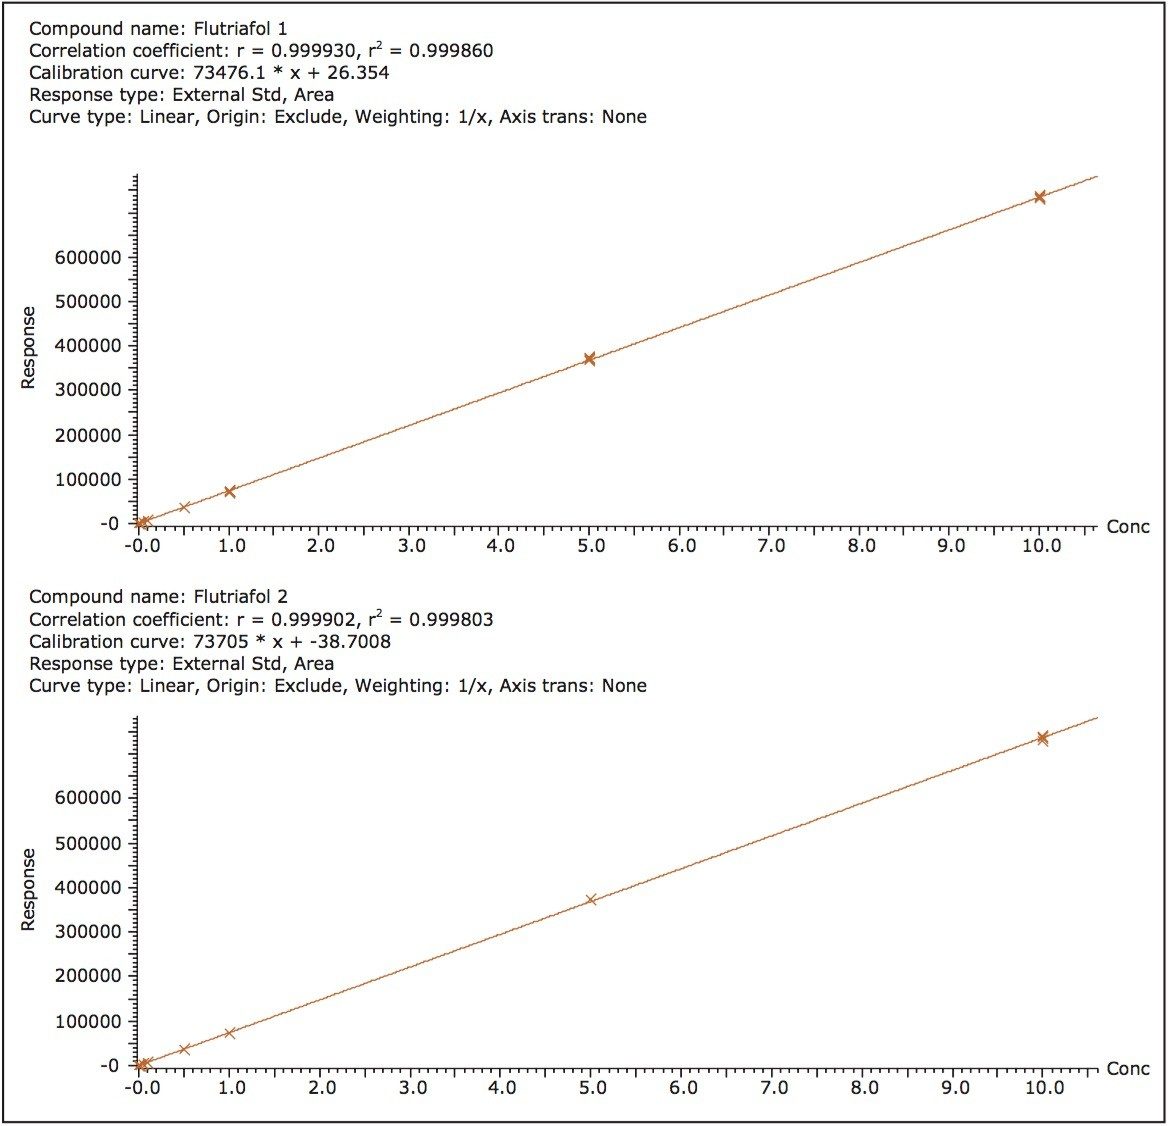
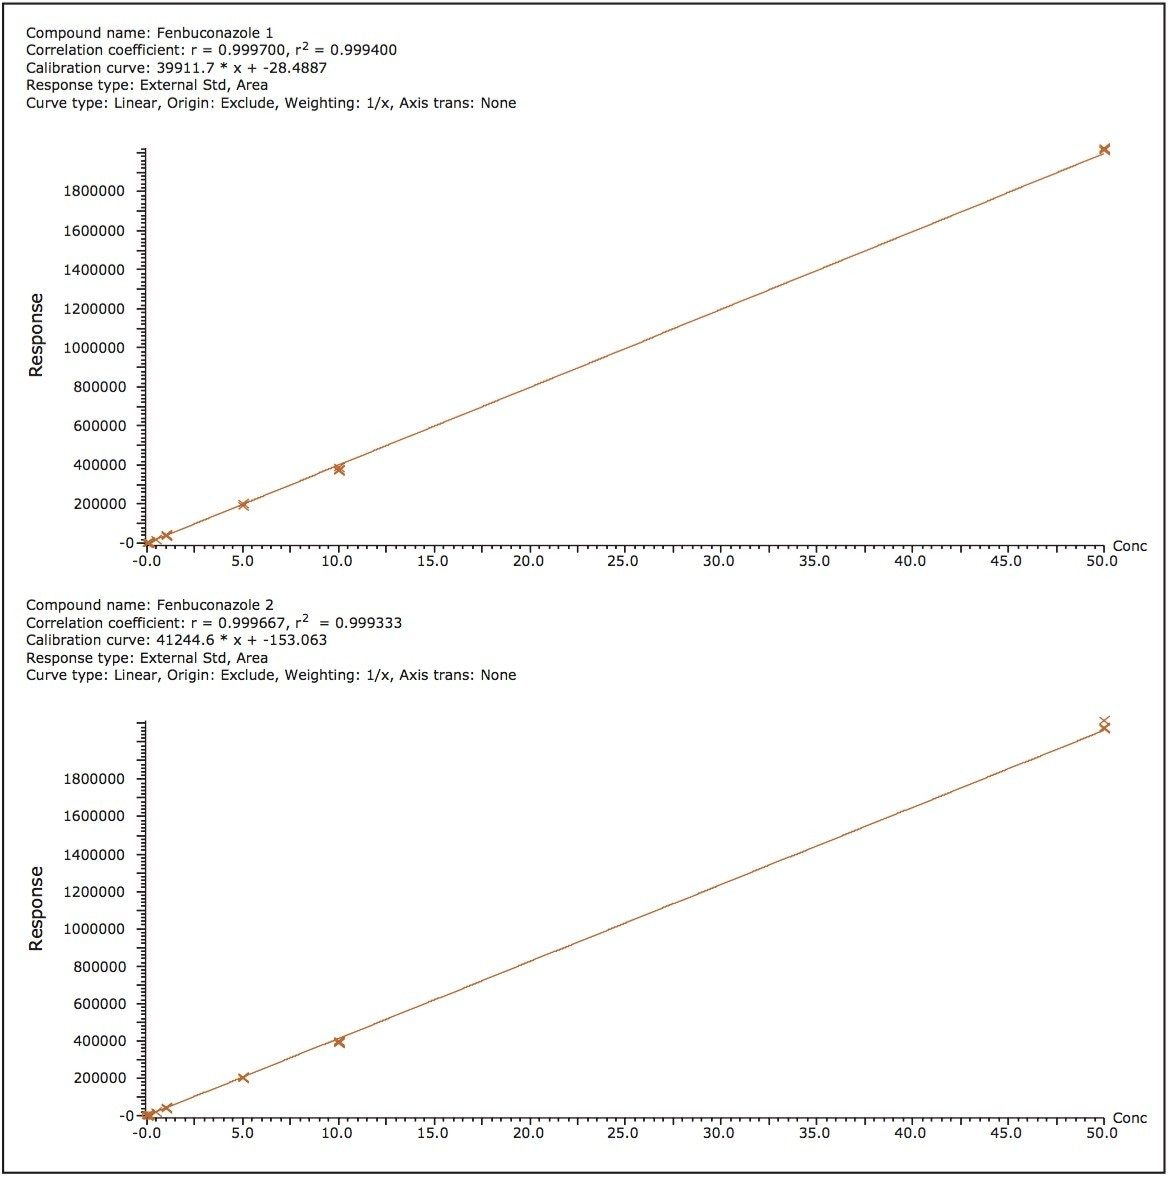
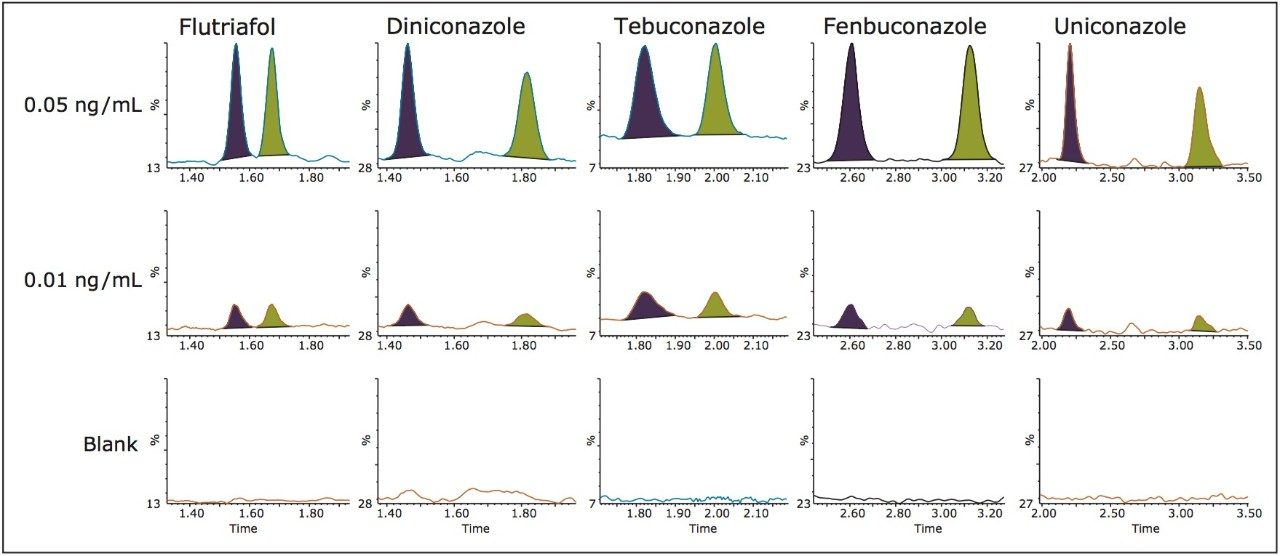
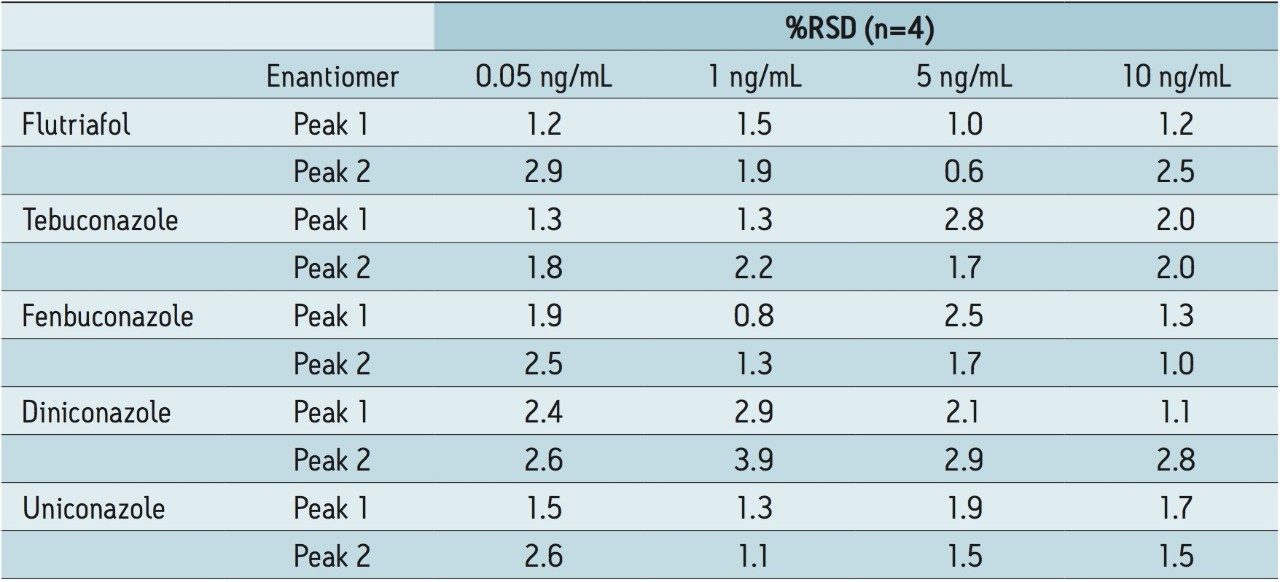
In this study, the enantioseparation of five triazole fungicides was performed in less than 3.5 minutes. The Xevo TQ-S was used for detection of the rac-triazole fungicides in wheat grain and wheat straw. The results from the chiral UPC2-MRM analysis show that trace level detection (ppt) can be achieved with good precision and accuracy over at least 3.5 orders of magnitude using this technique.
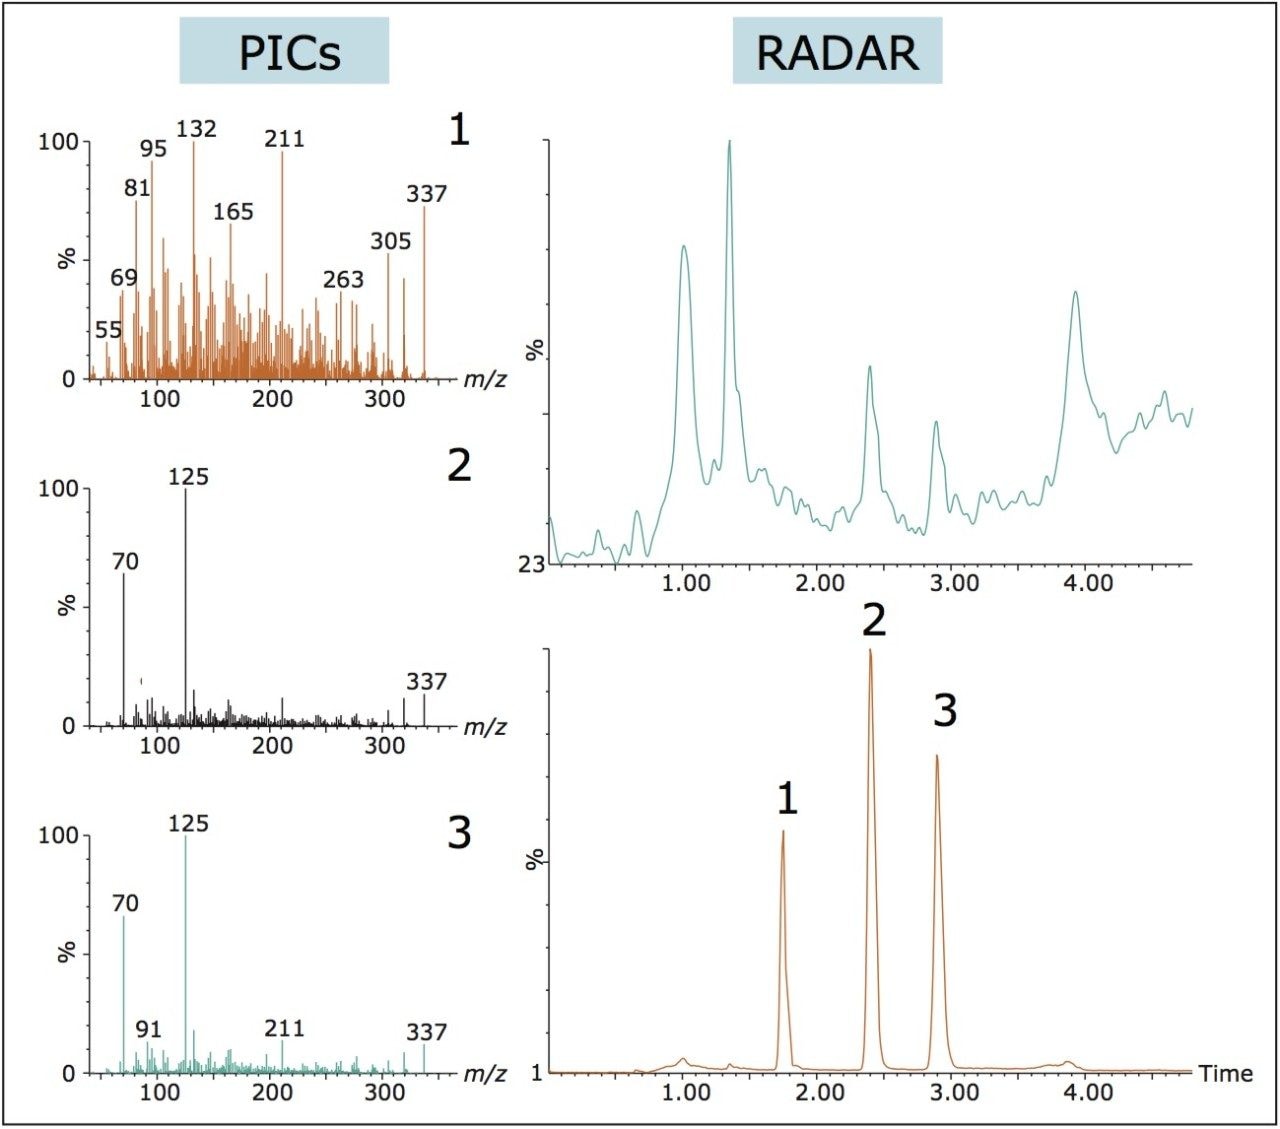
The use of RADAR, where full-scan data can be acquired simultaneously with MRM data can help identify co-eluting components that could potentially decrease the assay’s robustness.
When complex matrices are analyzed, despite the specificity of MRM, matrix components give rise to signals that can be misidentified as an analyte peaks. PICs data provides an added qualitative element to the acquisition, which is useful for achieving higher selectivity, and greater confidence for peak assignment and confirmation.
720005110, September 2014