• Application Note

Method Development for the Separation of Sulfated Estrogens by UltraPerformance Convergence Chromatography (UPC2)

Method Development for the Separation of Sulfated Estrogens by UltraPerformance Convergence Chromatography (UPC2)

  • Christopher J. Hudalla
  • Kenneth J. Fountain
  • Manisha A. Patel
  • Mark A. Hardink
  • Frank W. Riley
  • Waters Corporation
  • Pfizer Inc.

Abstract

In this study, method development for the application of UltraPerformance Convergence Chromatography (UPC2) for the separation of 10 structurally similar sulfated estrogens is explored.

Benefits

  • Analysis of sulfated estrogens in their native form, thus reducing sample preparation and analysis by >90% compared to traditional methods 
  • Does not require hazardous chemicals typical for sample derivatization prior to GC analysis 
  • Full resolution of all isobaric compound pairs

Introduction

The chromatographic analysis of steroids and steroid derivatives often presents a difficult challenge due to their structural similarities. Even with the inclusion of mass spectrometric detection, due to the isobaric nature of many of these compounds, chromatographic resolution is often required. One such group of compounds is the conjugated estrogens. Because free steroids have limited aqueous solubility, they are often found in a biologically conjugated form, which in mammals can be as sulfates or glucuronates. The resulting ester formed with the negatively charged hydrophilic side groups increase their aqueous solubility, and thus their bioavailability. The sulfated estrogens are frequently used as hormone replacement therapy for post-menopausal women, to provide both symptomatic relief from vasomotor symptoms (hot flashes) and prevent osteoporosis.1,2,3 They have also been used in the treatment of hormone deficiencies in younger women.4 Because of these treatment regimes, there is great interest in the development and characterization of therapeutic preparations of the sulfated estrogens. Typical methods employing gas chromatography (GC) involve lengthy sample preparation and derivatization steps, and results in inadequate resolution for one isobaric pair of compounds. Additional methods have been developed utilizing LC-MS yielding a relatively complex method requiring approximately 90 minutes for analysis. In this study, method development for the application of UltraPerformance Convergence Chromatography (UPC2) for the separation of 10 structurally similar sulfated estrogens is explored (Figure 1).

Structures of ten sulfated estrogens
Figure 1. Structures of ten sulfated estrogens. Compounds with the same color font for molecular weight indicate that they are isobaric. The numbers assigned to each compound are used for peak identification in all figures.

Experimental

Sample preparation

Stock solutions were prepared from individual sulfated estrogen samples using methanol (MeOH), ethanol (EtOH), and 2-propanol (IPA) as diluents. The stock solutions were used to prepare the final sample mixture, at the concentrations shown in Table 1, using ethanol as a diluent.

Stock and sample preparation
Table 1. Stock and sample preparation.

UPC2 conditions

System:

ACQUITY UPC2 with PDA detector

Column:

ACQUITY UPC2 BEH 2-Ethylpyridine 1.7 μm, 2.1 x 150 mm (p/n 186006579)

Mobile phase A:

CO2 (tank, medical grade)

Mobile phase B:

Methanol with additional additives, as specified for each chromatogram

Column temp.:

20 °C to 50 °C

ABPR:

1700 to 4100 psi

UV detection:

220 nm (compensated 380 to 480 nm) [40 pts/s]

Injection volume:

1.5 μL

Strong needle wash:

Methanol

Weak needle wash:

2-Propanol

Seal wash:

Methanol

Gradient conditions:

Shown in individual chromatograms

Vials:

LCMS Certified Maximum Recovery Vials

Results and Discussion

The current USP method for the characterization of conjugated estrogens utilizes GC analysis of the derivatized estrogens.5 Prior to the derivatization of the estrogens, the conjugated estrogen must be treated to cleave the sulfate group using a sulfatase enzyme. This process takes approximately two hours in multiple steps involving shaking, sonication, water baths, centrifuging, buffers, pH adjustments, and filtration. The derivatization step requires another 25 minutes with the addition of pyridine, bis(trimethylsilyl)trifluoroacetamide, andtrimethylchlorosilane. The sample is then analyzed by a 35-minute GC-FID method. As shown in Figure 2, even under these conditions with a total sample preparation and analysis time of approximately three hours, two of the compounds are not completely resolved.

GC-FID separation of ten estrogens using the USP method for conjugated estrogens
Figure 2. GC-FID separation of ten estrogens using the USP method for conjugated estrogens. Sample preparation includes cleavage of the sulfate group from the conjugated estrogen prior to chemical derivatization of the sample. Total sample preparation time is greater than 2.5 hours. Two of the compounds, peaks 6 and 7 (circled in red) are not completely resolved.

Preparation of the sample for UPC2 analysis eliminates the need for sulfate removal followed by derivatization, thereby providing a significantly faster and easier analysis than GC, and involves simple dilution of the sulfated estrogens in the appropriate diluents (Table 1). For the current application, the goal was to separate the 10 sulfated estrogens with resolution values (RS) greater than 1.5 with UV detection. To achieve this, the method development for the separation was performed following a stepwise procedure (Figure 3) to explore the effect of various stationary phases, modifiers, additives, pressures, temperatures, and gradient conditions. After the evaluation of each set of parameters, the optimum results were used to move forward to the next set of experiments. With the exception of evaluating the effects due to variations in pressures (either through variation of the pressure directly or through variation of the flow rate), the steps for method development using UPC2 technology are not significantly different from those used for conventional LC techniques.

Method development process for the UPC2 separation of the sulfated estrogen mixture

Preliminary method screening was performed using different combinations of stationary phase and mobile phase modifier with the addition of a modifier additive. Additives have been shown to play a critical role in the retention mechanisms governing separations with liquid CO2, offering several hypotheses regarding their function including: suppression of ionization, formation of ion pairs, coverage of stationary phase active sites, or altering the polarity of the stationary and/or mobile phases. For the current example, without the addition of basic, acidic, or salt additives to the mobile phase modifier, the charged estrogen sulfates are not eluted from the column (data not shown). Initial evaluations utilized 10 mM ammonium acetate (AmOAc) with 5% water as additives in methanol (MeOH), ethanol (EtOH), or acetonitrile (ACN). The results from this screening on the ACQUITY UPC2 BEH, BEH 2-Ethylpyridine, and HSS C18 SB Columns are shown in Figure 4.

Screening of the sulfated estrogen mixture

In each case, using acetonitrile as the modifier, the estrogenic compounds did not elute under the conditions studied. Conversely, methanol seemed to have the greatest ability to provide the best resolution between the compounds. Based on these evaluations, it was surmised that the optimum separation of the analytes would be achieved on the BEH 2-Ethylpyridine column, using methanol as the mobile phase modifier. All additional method development focused on this combination of column chemistry and modifier, with further exploration of additives, pressures, temperatures, flow rates, and gradient slopes.

Effect of additives to the modifier

In the previous example, the use of a modifier additive was necessary for the charged analytes to elute from the UPC2 Column. Using ammonium acetate in water as the additive, the optimum separation was obtained on the BEH 2-EP column with methanol as the modifier. The choice of additive can have a significant impact on the retention and resolution, so various additives were next explored. Due to the analyte retention window observed for the column screening example, the gradient slope for these evaluations was decreased by using a smaller range of modifier concentration, with a gradient from 9% to 40% modifier. All other parameters remained the same. Figure 5 shows the impact of the various additives on the separation.

 Screening of the estrogen mixture

In each of the examples with the various additives, the elution order remains the same. Only the retention times and resolution is impacted by the choice of additive. The separations in Figure 5 show two sets of critical pairs for resolution; peaks 2 and 3, and peaks 6 and 7. Based on the resolution for these two pairs, there are multiple additives that may be acceptable with further optimization. The choice of the set of conditions to move forward with may depend on the ultimate goals of the separation. If this final method was intended for mass spectrometric detection, optimization may have focused on either the ammonium hydroxide or the formic acid/ ammonium formate additives, due to their compatibility with the detection technique. Using UV detection for the current evaluation, the isopropyl amine (IPAmine) additive was selected for further optimization.

Pressure effects

It is well known that separations using liquid CO2 as a mobile phase have analyte retention factors that are greatly influenced by the density of the mobile phase. Because of the compressibility of liquid CO2, the density can change significantly with changes in pressure, resulting in retention factors decreasing with increasing mobile phase density (pressure). In addition, the selectivity and resolution of individual analytes may be impacted as they respond differently to the changes in mobile phase density. Using isopropyl amine as the additive, the effects of pressure were studied by varying the pressure setting for the Automated Back Pressure Regulator (ABPR) on the ACQUITY UPC2 System, with pressures ranging from 1700 to 3200 psi. The results are shown in Figure 6.

Screening of the estrogen mixture
Figure 6. Screening of the estrogen mixture on the ACQUITY UPC2 BEH 2-EP 1.7 μm, 3.0 x 100 mm Column using a methanol modifier with 0.3% isopropyl amine with variable ABPR settings as follows: (a) 1700 psi, (b) 2175 psi, (c) 2500 psi, (d) 2900 psi , and (e) 3200 psi. A five-minute gradient from 9% to 40% modifier was run at 1.3 mL/min and 50 °C.

With attention to the two critical pairs, Figure 6 shows that for this set of analytes, the resolution of peaks 2 and 3 is not significantly impacted by changes in pressure, while for peaks 6 and 7, the resolution is improved slightly at the higher pressure, higher density conditions. The greatest resolution for peaks 6 and 7 (RS(6,7) = 1.00) was observed with an ABPR setting of 3200 psi.

Temperature effects

Temperature can also be a useful tool to influence selectivity and resolution. Using the highest ABPR setting of 3200 psi, further evaluations were performed at 40 °C and 30 °C, as shown in Figure 7.

Screening of the estrogen mixture

Again, focusing on the critical pairs, it can be seen that the decrease in temperature results in the increase in resolution for both critical pairs. The optimum separation for these analytes is achieved at the lowest temperature evaluated, 30 °C.

Flow rate effects

Because of the co-dependent relationship between flow rate and pressure, exploring the effects of flow rate requires pressure to be considered as a parameter. In the earlier evaluation of pressure effects, the best separations were achieved at the higher pressures. Because of this, as the various flow rates were explored, the ABPR pressure setting was adjusted to maintain the highest possible pressures during the separation within the specifications of the ACQUITY UPC2 System. In addition, the gradient times (tg) were adjusted based on the flow rate used so that the number of column volumes was the same for each separation (13.9 column volumes), thus the tg was increased for lower flow rates, while the tg was decreased for the faster flow rates. The separations at flow rates from 0.8 mL/min to 1.9 mL/min are shown in Figure 8.

 Screening the estrogen mixture

For each set of conditions, the resolution values for the critical pairs were recorded when possible, as shown in Table 2. The highest resolution for both pairs was obtained at the lowest flow rate evaluated (0.8 mL/min), using an ABPR setting of 4100 psi, and a gradient time of 8.1 minutes.

Resolution of critical peak pairs as a function of flow rate
Table 2. Resolution of critical peak pairs as a function of flow rate.

Flow gradients

Throughout the preliminary screening of these compounds under a variety of conditions, including various pressure and flow rate settings, it was consistently observed that the best separations were obtained at conditions with the highest pressures. However, as the gradient transitions to higher modifier concentrations, the increased mobile phase viscosity results in higher system pressures leading to system over-pressure shut-down above 6000 psi. In order to stay within the pressure specifications of the system, flow rates lower than the optimum linear velocity are required, resulting in a lower efficiency separation with lower peak capacities. To achieve the fastest separations with the greatest peak capacity, reverse flow-gradients can be used to maintain the system pressure at a nearly constant level near the upper specification for the system. As the concentration percentage of organic modifier is increased, the flow rate is decreased. This can be seen in the gradient table shown in Figure 10 (bottom) for the separation of the sulfated estrogens using methanol as the modifier with 0.3% isopropyl amine (IPAm) as the additive. As the percent modifier transitions from 9% to 40%, the flow rate is decreased from 1.3 mL/min to 0.8 mL/min, the maximum flow rates that were determined empirically at each concentration of mobile phase modifier. Figure 9 compares the separation at constant flow with that using a flow gradient, with the resulting system pressure traces shown in orange. For the flow gradient, the system pressure is nearly constant throughout the gradient retention window. The use of the flow gradient enables collection of data at flow rates as close to the optimum linear velocity as possible, within the pressure specifications of the system, maximizing the overall peak capacity of the separation.

Separation of the estrogen mixture

Gradient slope

The slope of the gradient can also have significant impact on the separation. The slope can be explored by altering either the beginning and ending modifier concentrations, or by increasing or decreasing the gradient time (tg). Figure 10 illustrates the effect of altering the starting and ending modifier concentration for the gradient, while holding the gradient time constant. The optimum resolution for the critical pairs is obtained with the shallowest gradient evaluated (8% to 33% modifier). Using these starting and ending modifier concentration values for the gradient, further evaluation of the gradient slope was explored by altering the length of the gradient (tg). Figure 11 shows the effect of increasing and decreasing the slope of the gradient by altering the length of the gradient, or the number of column volumes used during the gradient separation.

Separation of the estrogen mixture

The greatest resolution of the critical pairs is again obtained with the shallowest gradient (8% to 33% modifier in 12 minutes or ~2% per minute), as shown in Figure 11.

 Separation of the estrogen mixture
Figure 11. Separation of the estrogen mixture on the ACQUITY UPC2 BEH 2-EP 1.7 μm, 3.0 x 100 mm Column using a methanol modifier with 0.3% isopropyl amine employing a flow gradient from 1.4 to 0.9 mL/min, with 8% to 33% modifier. For each example, the gradient slope was adjusted by changing the gradient time (tg) as follows: (a) five minutes, (b) seven minutes, (c) nine minutes, and (d) 12 minutes. Each chromatogram was collected at 30 °C with an ABPR setting of 4100 psi. The gradient volumes were 12.3, 17.3, 22.2, and 29.6 column volumes, respectively.

Additional optimization

The goal of this method development was to obtain resolution values >1.5 for each of the analytes. While the best separation in the previous example approaches this criteria, additional optimization was still required. During the temperature evaluations, the optimum separation was achieved at 30 °C, but lower temperatures were not explored. For additional optimization, lower temperatures were evaluated with an additional adjustment to decrease the slope of the gradient. Temperatures of 20 °C, 10 °C, and 5 °C were evaluated with a 12-minute gradient from 8% to 27% modifier (~1.6% per minute). The results of these evaluations are shown in Figure 12.

Separation of the estrogen mixture
Figure 12. Separation of the estrogen mixture on the ACQUITY UPC2 BEH 2-EP 1.7 μm, 3.0 x 100 mm Column using a methanol modifier with 0.3% isopropyl amine , using a 12-minute gradient from 8% to 27% modifier, employing a flow gradient from 1.4 to 0.9 mL/min. The temperatures were 20 °C (top), 10 °C (middle), and 5 °C (bottom). Each chromatogram was collected with an ABPR setting of 4100 psi. The separation at 20 °C meets the resolution criteria required for the current separation.

Figure 12 shows that the goals for this separation, RS > 1.5 for all analytes, can be achieved at 20 °C, using the shallower gradient of 8% to 27% modifier in 12 minutes.

Alternative separations

During the initial evaluation of additives, based on the goals set forth for this method, isopropyl amine was chosen for additional optimization. If the method incorporated mass spectrometry, optimization may have been focused on another additive, either the ammonium hydroxide or the formic acid/ammonium formate additive because of their increased compatibility with the mass spectrometry system. Purely as an exploratory exercise, these two additives were re-evaluated with the current optimized method. Based on the increased retention observed during the initial additive evaluations (Figure 5), the modifier concentrations were increased slightly (3%), while keeping all other parameters constant, including the gradient slope. Figure 13 shows the optimum separation achieved with the isopropyl amine additive, using the optimized gradient from 8% to 27% modifier, along with the separations of the two alternative modifiers, utilizing a gradient from 11% to 30% modifier.

Separation of the sulfated estrogen mixture
Figure 13. Separation of the sulfated estrogen mixture on an ACQUITY UPC2 BEH 2-EP 1.7 μm, 3.0 x 100 mm Column using a methanol modifier with various additives; 0.3% isopropyl amine (top), 0.3% ammonium hydroxide (middle), and 0.1% formic acid with 25 mM ammonium acetate (bottom). For each separation, 12-minute gradients with equal slopes were used as follows: 8% to 27% (top), and 11% to 30% (middle and bottom). Each separation also utilized a flow gradient from 1.4 to 0.9 mL/min. The data was collected at a temperature of 20 °C with an ABPR setting of 4100 psi.

This exercise demonstrates the versatility of convergence chromatography, offering flexibility for altering conditions to accommodate different detection methods.

Conclusion

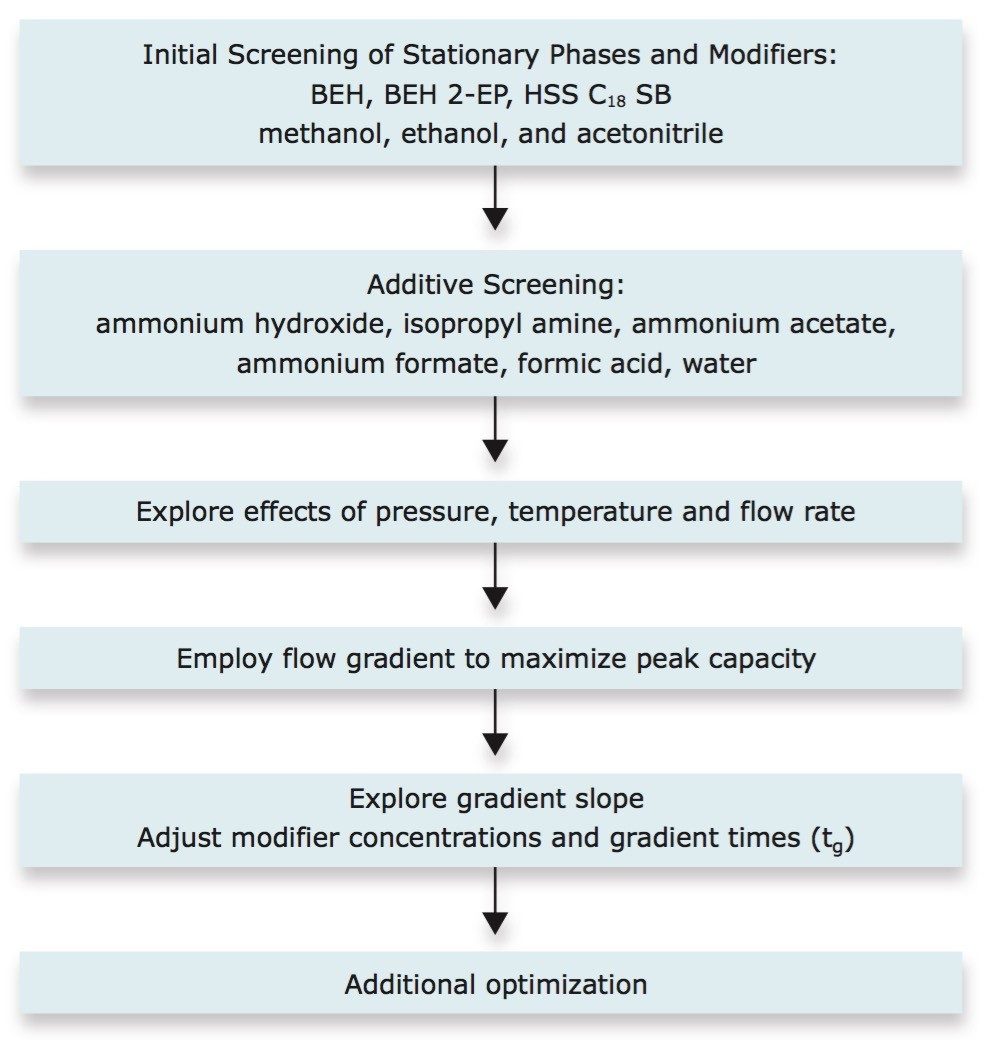
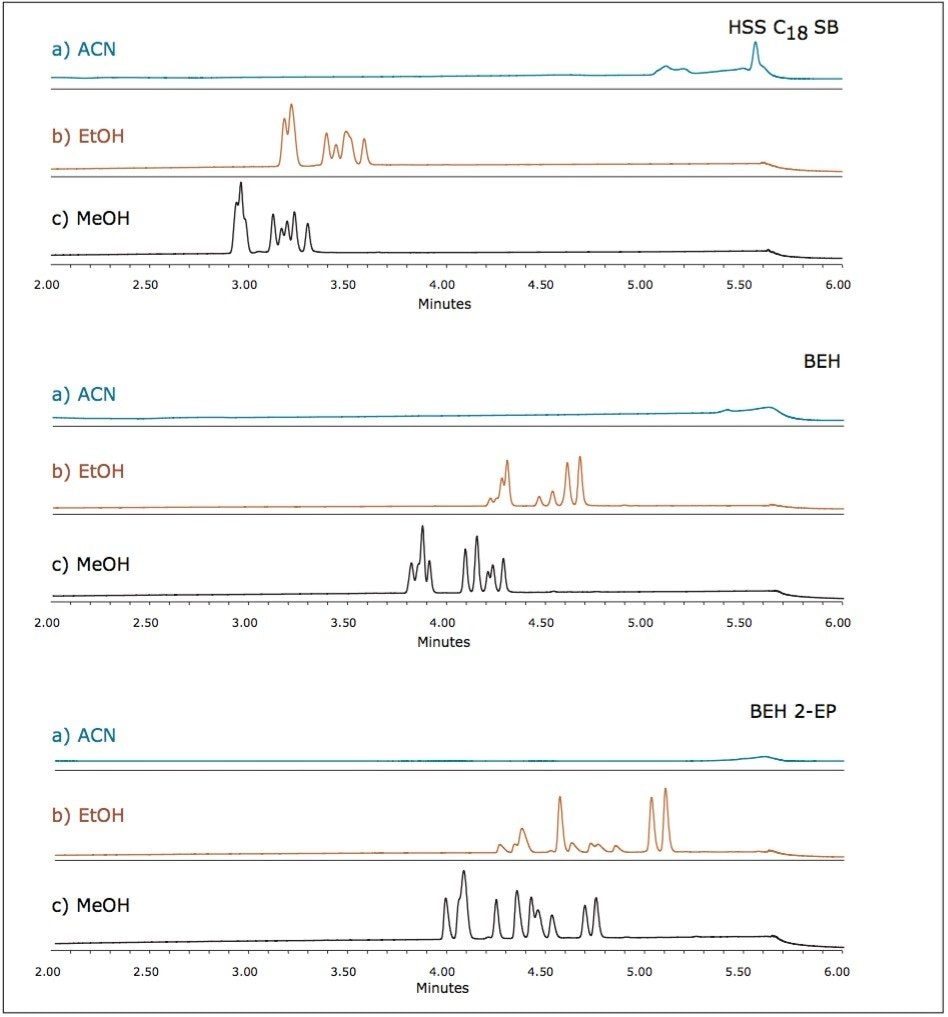
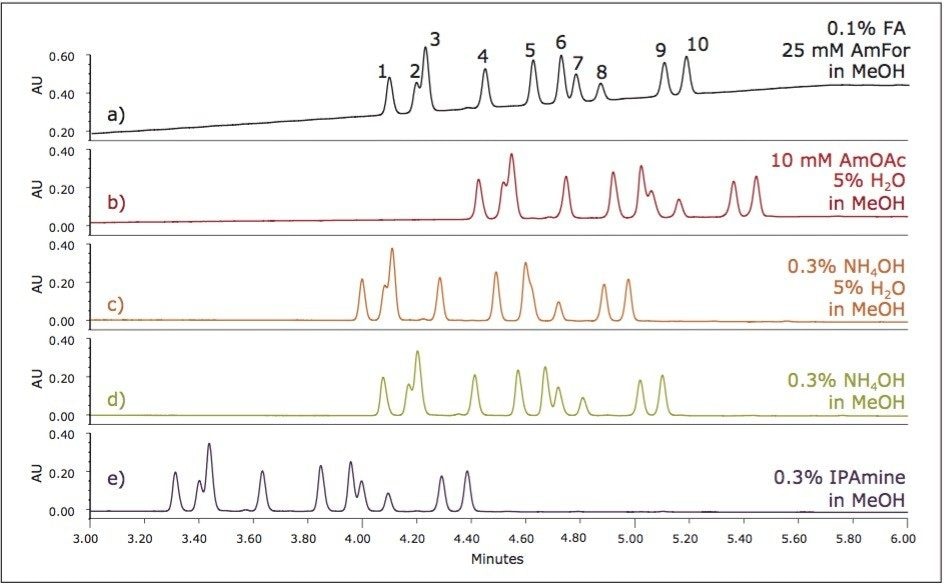
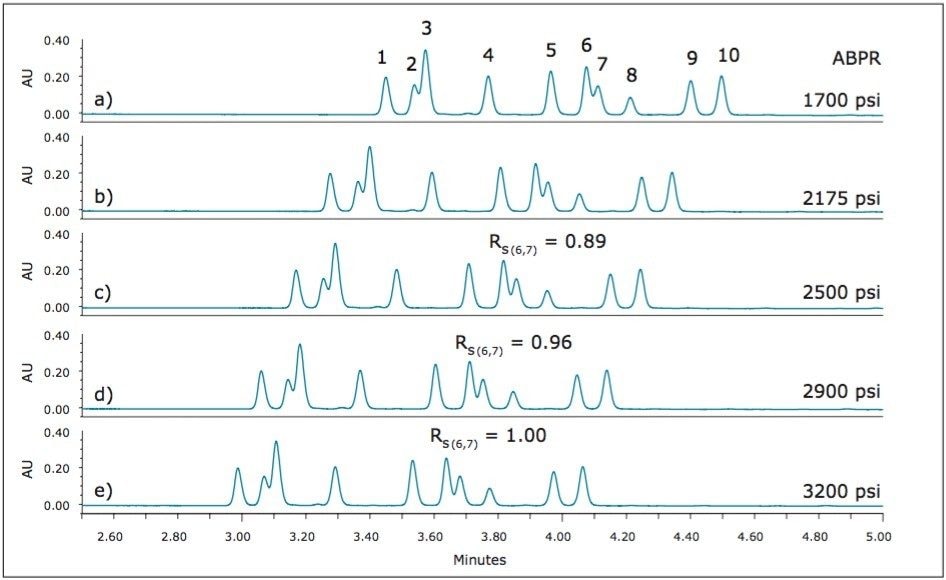
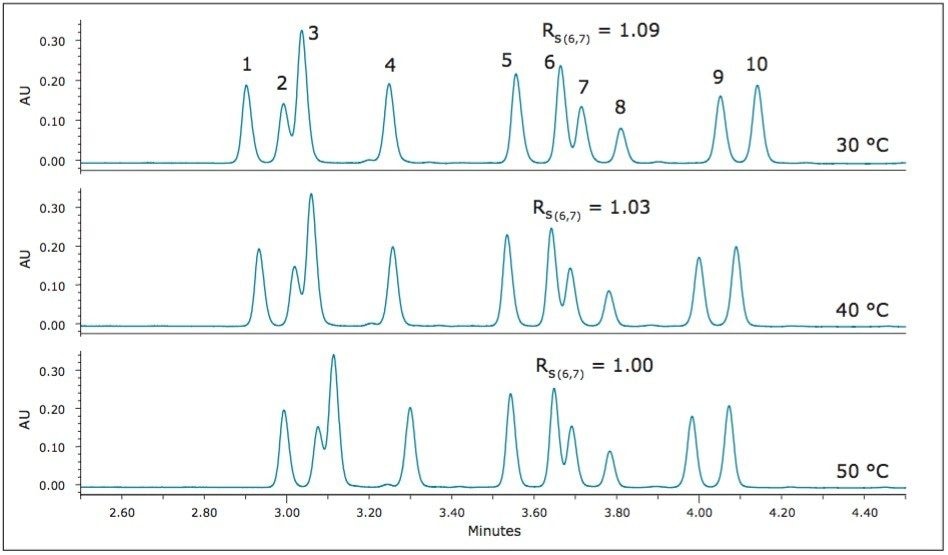
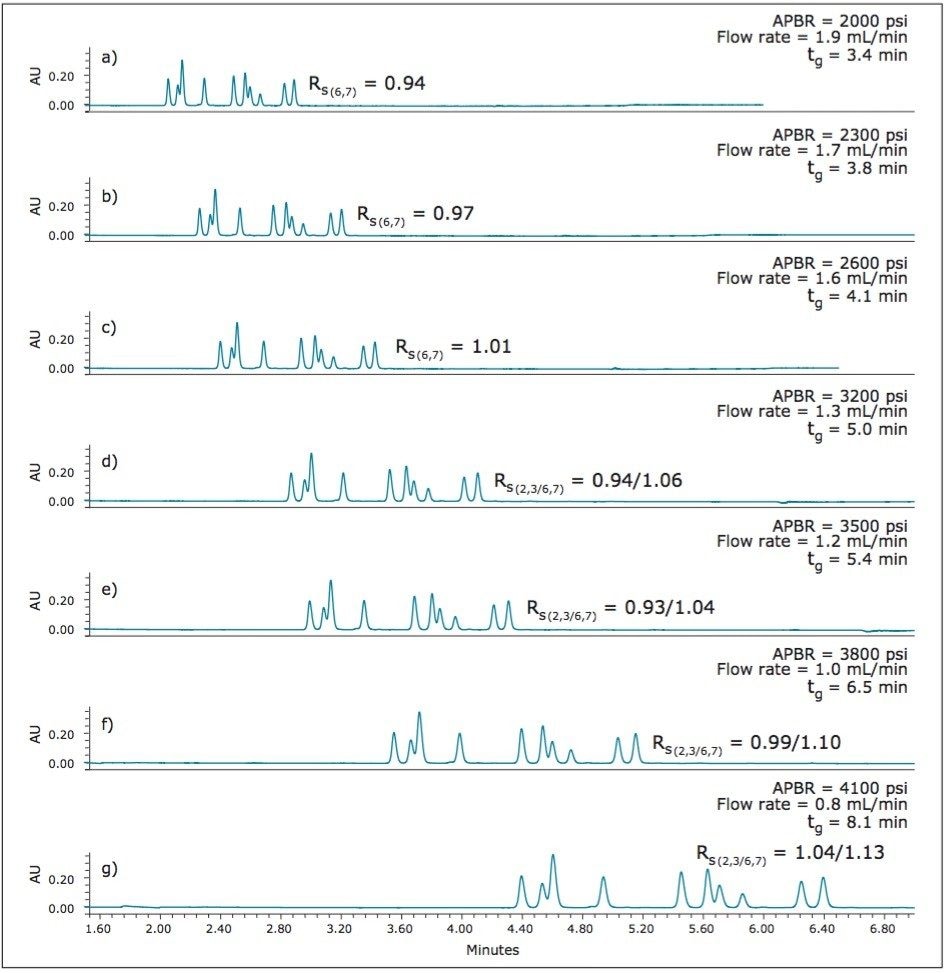
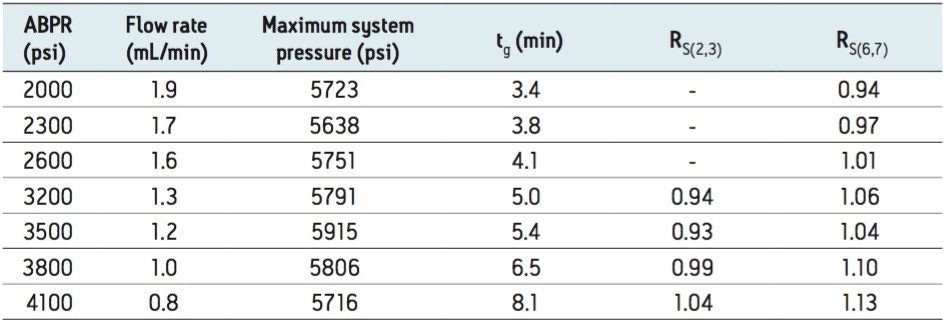
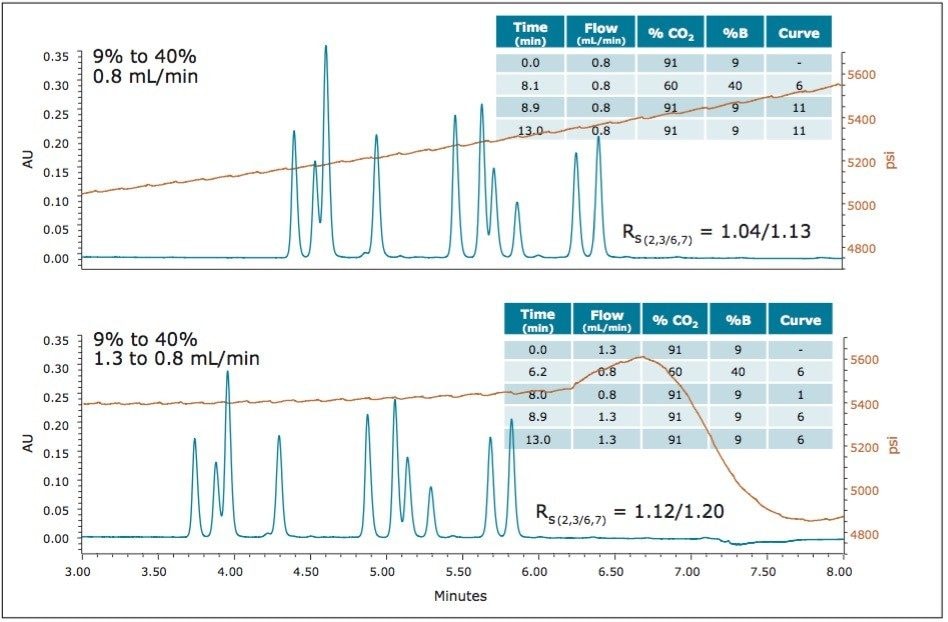
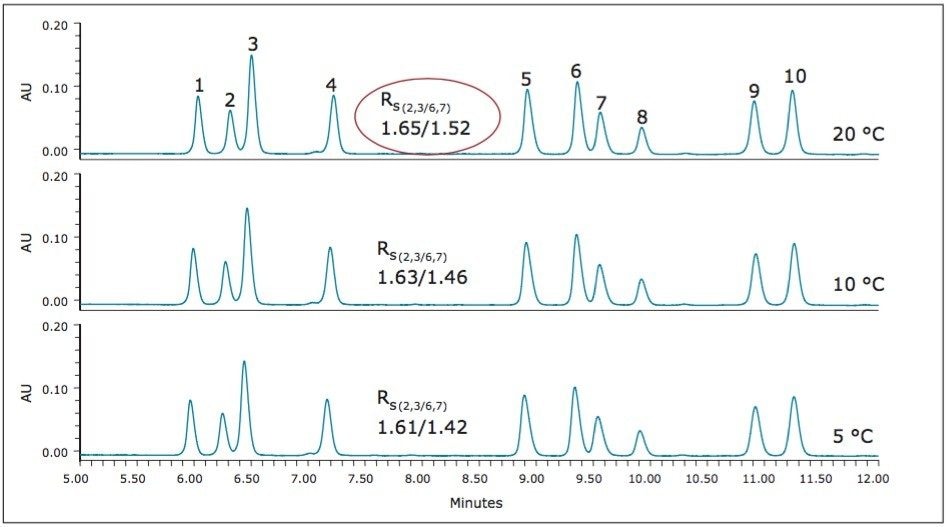
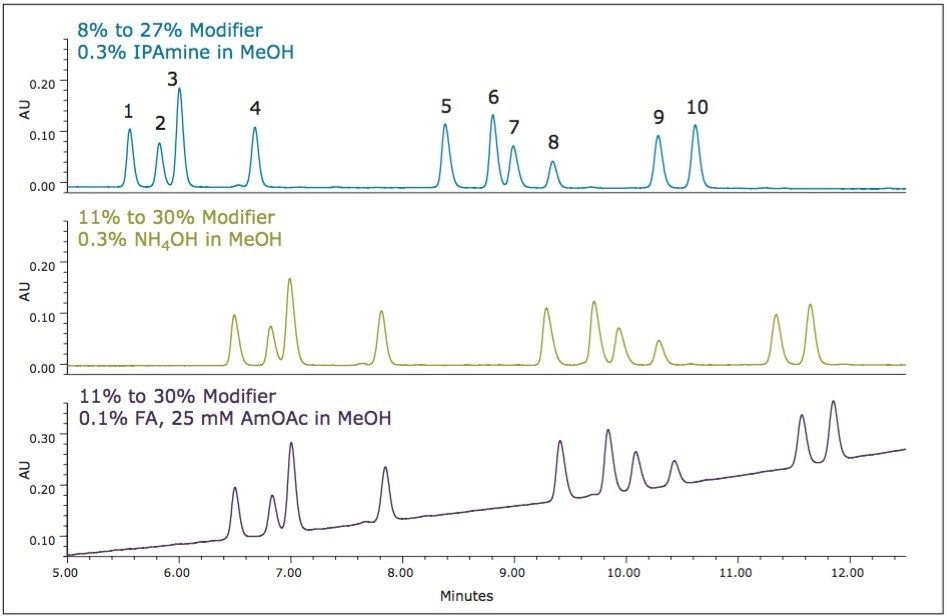
UPC2 method development for sulfated estrogens involved several critical parameters for an optimal separation, including column chemistry, choice of modifier, additive, pressure, temperature, flow rate, and gradient slope. Although the choice of additive had minimal impact on overall selectivity, the presence of the additive is critical for elution of these charged analytes, and can impact the peak shape and resolution for the analytes. The importance of pressure cannot be understated, and the application of reverse flow-gradients to maintain the highest possible flow rates and greatest efficiencies can be extremely beneficial, while staying within the pressure limitations of the system.

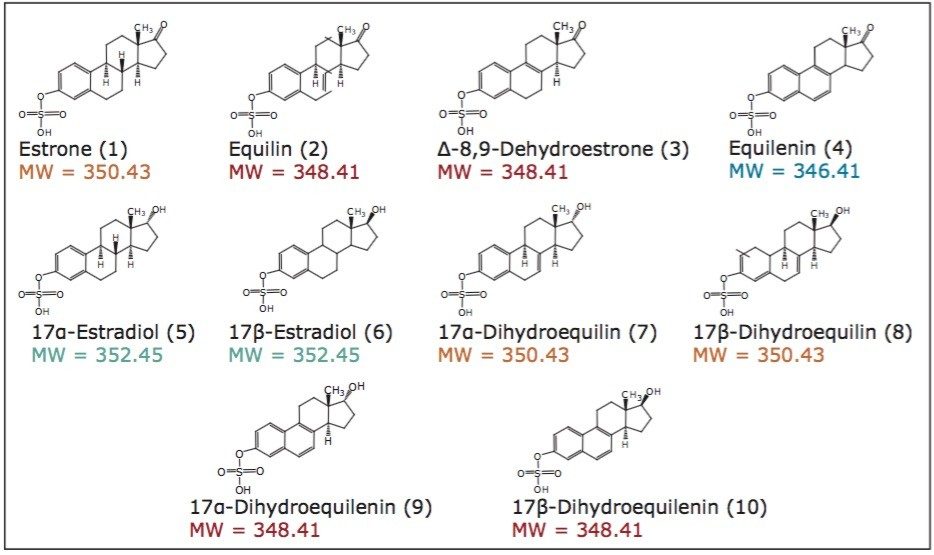
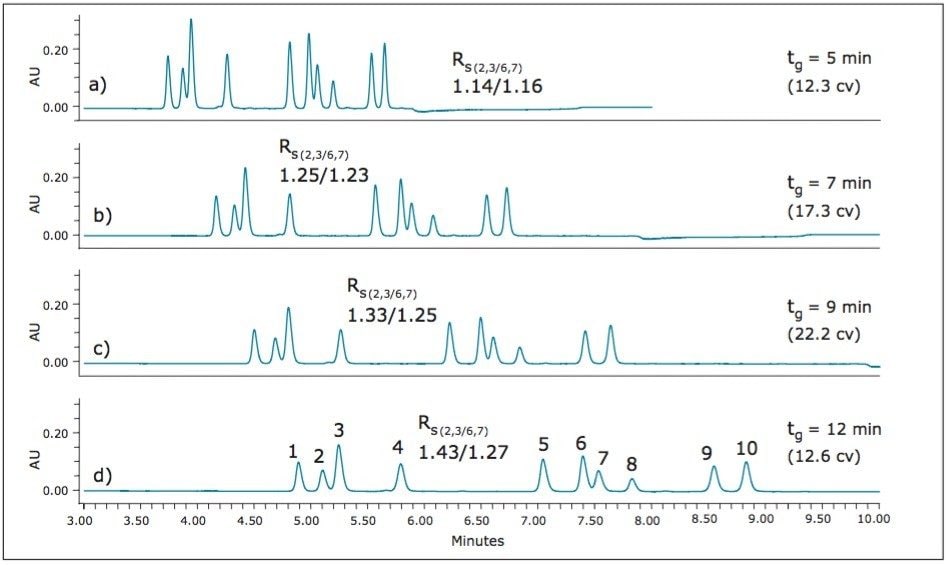
The application of this technology to the separation of sulfated estrogens represents a dramatic improvement over conventional gas chromatographic methods, with greater than 90% reduction in overall analysis time for the synthetic mixture of 10 sulfated estrogens. This is mostly due to the improvement in workflow provided by the elimination of sample desulfation and derivatization requirements prior to analysis. The reduction in the complexity and time requirements for the sample preparation yields increased laboratory efficiency with less opportunity for compounded errors. As demonstrated in this study, the ability of UPC2 technology to separate compounds with very similar structures make it well suited for the analysis of steroid and steroid-related compounds.

References

  1. National Institutes of Health. State-of-the-Science Conference statement: management of menopause-related symptoms. Ann Intern Med. 2005 June 21; 142(12 Pt 1):1003-13.
  2. Ettinger B, Ensrud KE, Wallace R, et al. Effects of ultralow-dose transdermal estradiol on bone mineral density: a randomized clinical trial. Obstet Gynecol. 2004 Sept; 104(3):443-51.
  3. Prestwood KM, Kenny AM, Kleppinger A, et al. Ultra low-dose micronized 17beta-estradiol and bone density and bone metabolism in older women: a randomized controlled trial. JAMA. 2003 Aug.27; 290(8):1042-8.
  4. Soliman NF, Hillard TC. Hormone replacement therapy in women with past history of endometriosis. Climacteric. 2006 Oct; 9(5):325-35.
  5. USP Monograph. Conjugated Estrogens, USP35-NF30 [5481]. The United States Pharmacopeial Convention, official from August 1, 2012.

720004712, August 2013

Back To Top Back To Top