• Application Note

Identification of Multiple Sites of Intra-Molecular Protonation and Different Fragmentation Patterns within the Fluoroquinolone Class of Antibiotics in Porcine Muscle Extracts Using Travelling Wave Ion Mobility Mass Spectrometry

Identification of Multiple Sites of Intra-Molecular Protonation and Different Fragmentation Patterns within the Fluoroquinolone Class of Antibiotics in Porcine Muscle Extracts Using Travelling Wave Ion Mobility Mass Spectrometry

  • Michael McCullagh
  • Sara Stead
  • Jonathan P. Williams
  • Wouter de Keizer
  • Aldert Bergwerff
  • Waters Corporation
  • RnAssays BV
Red and white antibiotic capsules

Abstract

This application note demonstrates the use of High Definition Mass Spectrometry (HDMS) as an important method development tool to support the unequivocal identification of fluoroquinolone antibiotics in crude tissue extract.

Benefits

  • Analysis of complex matrix based samples benefits from the orthogonal separation produced using travelling wave ion mobility.
  • Orthogonal mobility separation enables single component MS and MSE spectra to be produced simultaneously for components in a complex sample.
  • Protomers observed can be uniquely identified and used as an additional identification point.
  • Utilizing HDMSE as an analytical approach has the potential to give greater understanding of differences that occur in intra/inter laboratory studies.

Introduction

The fluoroquinolones are a class of antimicrobial agents that have been administered to livestock for different purposes that include: (a) prevention and control of infections, and (b) growth promotion. Due to the concerns regarding the spread of resistant microorganisms in the human population, the U.S. Food and Drug Administration (FDA) introduced a ban on the use of enrofloxacin and ciprofloxacin in livestock production in September, 2005.1,2 The use of antibiotic growth promoting agents (AGPs) in animal husbandry has been forbidden in the European Union (EU) since 2006, when the final four antibiotics were banned as growth promoters.3
The fluoroquinolones are chemically diverse zwiterionic species, although all posses a basic 4-quinolone ring structure. Various modifications, involving substitution of different functional groups around the quinolone ring (benzopyridone nucleus) have been made to improve the antimicrobial potency and the pharmacokinetic properties. The fluoroquinolones have a fluorine atom at position six on the bicyclic ring structure (Figure 1), and show an expanded spectrum of microbiological activity. EU Maximum Residue Levels (MRLs) currently exist for eight (fluoro)-quinolone compounds ranging from 10 to 1900 μg kg-1 dependant on the species and tissue type.4

The general structure of the fluoroquinolone class of antimicrobial compounds
Figure 1. The general structure of the fluoroquinolone class of antimicrobial compounds, where X and Y can be carbon or nitrogen atoms. R can have a wide variety of different functionalities depending on the specific fluoroquinolone compound, e.g. nitro, amino, halo, piperazinyl, and cyclopropyl groups.

The typical requirements for fluoroquinolone residue analysis are to employ a solvent extraction step, followed by solid phase extraction (SPE) purification and detection using LC coupled to UV, with fluorescence (FL) or mass spectrometry (MS) detection. These methods are often limited to the detection of a small number of target analytes and have low sample throughput.5 Many different types of mass analyzers are routinely utilized for veterinary drug residue (VDR) analysis, including single quadrupole, tandem quadrupole, ion trap, and more recently time-of-flight (Tof) based technologies.6,7,8 Tandem quadrupole mass spectrometry has gained widespread acceptance for quantitative analysis over single-stage mass spectrometry because it can provide significant performance benefits in terms of selectivity and sensitivity. This is attributed to the multiple reaction monitoring (MRM) mode, where a precursor ion is mass selected using the first quadrupole, fragmented in a collision cell when a specific product ion is mass selected and using the second quadrupole for detection. Even with this approach, there is still a small probability that other compounds, unrelated to the analyte, will produce a signal. For this reason, a second MRM transition is monitored and the presence of a compound is only considered to be confirmed if both transitions produce chromatographic peaks with retention times corresponding to that of the investigated analyte in pure standard. In addition, the ratio of the intensities of the two recorded MRM traces have to be equal to those obtained for the analyte in pure standard. This concept has been further refined in the European Commission Decision (2002/657/EEC) which regulates the requirements for analytical methods used to quantify and confirm VDRs in food and animal feed.9

Tandem quadrupole instruments are widely used in residue monitoring programs when low detection limits (typically low μg kg-1 concentrations) are required to be achieved in complex matrices. When choosing to implement a new tandem quadruple-based method for VDR analysis, the selection of the most appropriate MRM transitions is critical and must be performed and validated in accordance with the 2002/657/EC guidelines as previously noted.

This application note explores the use of High Definition Mass Spectrometry (HDMS) as an important method development tool to support the unequivocal identification of fluoroquinolone antibiotics in crude tissue extract. HDMS has been utilized to analyze crude extracts of porcine muscle tissue to determine the presence of antibiotic residues including the fluoroquinolone class. This technique offers some unique advantages for profiling complex matrices. It uses a combination of high resolution mass spectrometry and high efficiency ion mobility-based measurements and separations. Ion mobility spectrometry (IMS) is a rapid, orthogonal, gas phase separation technique that allows another dimension of separation to be obtained within an LC timeframe. Compounds can be differentiated based on size, shape, and charge. In addition, both precursor ion and fragment ion information can be acquired in a single injection in an HDMS experiment, referred to as HDMSE.

Schematic of SYNAPT G2-S and illustration of the mechanism of ion mobility
Figure 2. Schematic of SYNAPT G2-S and illustration of the mechanism of ion mobility.

Experimental

Extract preparation


The extracts of porcine muscle tissue were kindly provided by RnAssays for the purpose of this study. Briefly, known blank porcine muscle was fortified with 25 different antimicrobial compounds (from the fluoroquinolone, tetracycline, and amphenicol classes) at the levels relevant to the EU MRL concentrations prior to extraction. The tissue samples were mechanically homogenized in the presence of an aqueous/ organic extraction solvent, followed by a centrifugation step. An aliquot of the supernatant was removed and placed in autosampler vial for subsequent LC-MS analysis.

UPLC conditions

System:

ACQUITY UPLC

Column:

ACQUITY UPLC BEH C18 1.7 μm, 50 x 2.1 mm

Column temp.:

40 °C

Flow rate:

0.6 mL/min

Mobile phase A:

Water (0.1% formic acid)

Mobile phase B:

MeCN (0.1% formic acid)

Injection volume:

10 μL

Gradient:

Time (min)

Flow rate

%A

%B

Initial

0.600

95.0

5.0

1.00

0.600

95.0

5.0

8.00

0.600

5.0

95.0

9.00

0.600

95.0

5.0

MS conditions

Mass spectrometer:

SYNAPT G2-S

Ionization mode:

ESI positive at 2.0 kV

Cone voltage:

25 V

Desolvation temp.:

550 °C

Reference mass:

Leucine enkephalin, [M+H]+ =556.2771

Acquisition range:

50 to 1200 m/z

Acquisition rate:

4 spectra/s

Collision energy:

15 to 45 eV

Resolution:

20,000 FWHM

IMS T-Wave velocity:

550 m/s

IMS T-Wave pulse height:

40 V

Drift gas:

N2 and CO2

Results and Discussion

The antibiotic, ciprofloxacin, was determined to elute at a retention time of 2.19 minutes using the generic gradient conditions employed, as shown in Figure 3 where the base peak ion chromatogram is presented.

 UPLC HDMSE precursor base peak ion chromatogram
Figure 3. UPLC HDMSE precursor base peak ion chromatogram for a mixture of 25 solvent standard antibiotic compounds.

The resultant conventional accurate mass spectrum generated within MassLynx Software is shown in Figure 4, where accurate mass measurement with zero ppm mass error was observed for the [M+H]+ species at m/z 332.1410. The accurate mass measurement obtained and resultant elemental composition generated using the elemental composition calculator within MassLynx enabled complete confidence in the identification of the chromatographic peak at 2.19 minutes.

Conventional UPLC HDMSE accurate mass precursor ion spectrum
Figure 4. Conventional UPLC HDMSE accurate mass precursor ion spectrum obtained for the standard flouroquinolone ciprofloxacin at retention time of 2.19 minutes, illustrated within MassLynx.

The conventional data of Figures 3 and 4 suggest the fluoroquinolones analyzed are single components. However, analysis using ion mobility reveals that the fluoroquinolones are comprised of two ionized species, as shown in Figures 5 and 6. These gas phase components, although they only differ with site of protonation, in the case of ciprofloxacin have been separated by 1.14 milliseconds using ion mobility. The mobility separation can be seen within DriftScope in Figure 5, where the plot of drift time versus retention time for a mixture of veterinary drug standards is shown. Figure 5 shows the drift time separated, and multiple ion intensities obtained for the all fluoroquinolones analyzed. In the case of ciprofloxacin, a pair of ion intensities is highlighted. More specific data for this pair are shown in Figure 6, where the respective sites of acid/basic group protonation and drift times are highlighted.10

Plot of drift time versus retention time
Figure 5. Plot of drift time versus retention time for a mixture of veterinary drug standards, where the drift time separated, multipleion intensities obtained for  the fluoroquinolones standards analyzed can be seen, and in the case of ciprofloxacin a pair of ion intensities obtained is highlighted.
Intensity versus drift time for the protomers
Figure 6. Intensity versus drift time for the protomers of ciprofloxacin with the respective sites of acid/basic group protonation and drift times highlighted.

Each protomer has, therefore been treated as a single component, which has allowed the individual fragmentation spectra to be obtained (Figure 7). From the single component MSE fragmentation spectra, it was possible to determine that the two mobility separated species resulting from protonation takes place on both the acidic and basic groups for ciprofloxacin. The fragments at m/z 314 and m/z 231 (Figure 7) could only form from a species where ionization had taken place on the acidic group of ciprofloxacin. The fragments observed at m/z 288 and m/z 245 could only result if protonation had taken place on the basic group. The fragment m/z 231 is observed to form for both protomers. Further investigations have been performed regarding the fragmentation and will be presented in a separate study.

accurate mass fragmentation spectrum
Figure 7. Conventional ciprofloxacin (m/z 332) MS accurate mass fragmentation spectrum and individual accurate mass fragmentation spectra for ciprofloxacin protomers comprising the conventional fragmentation spectrum.

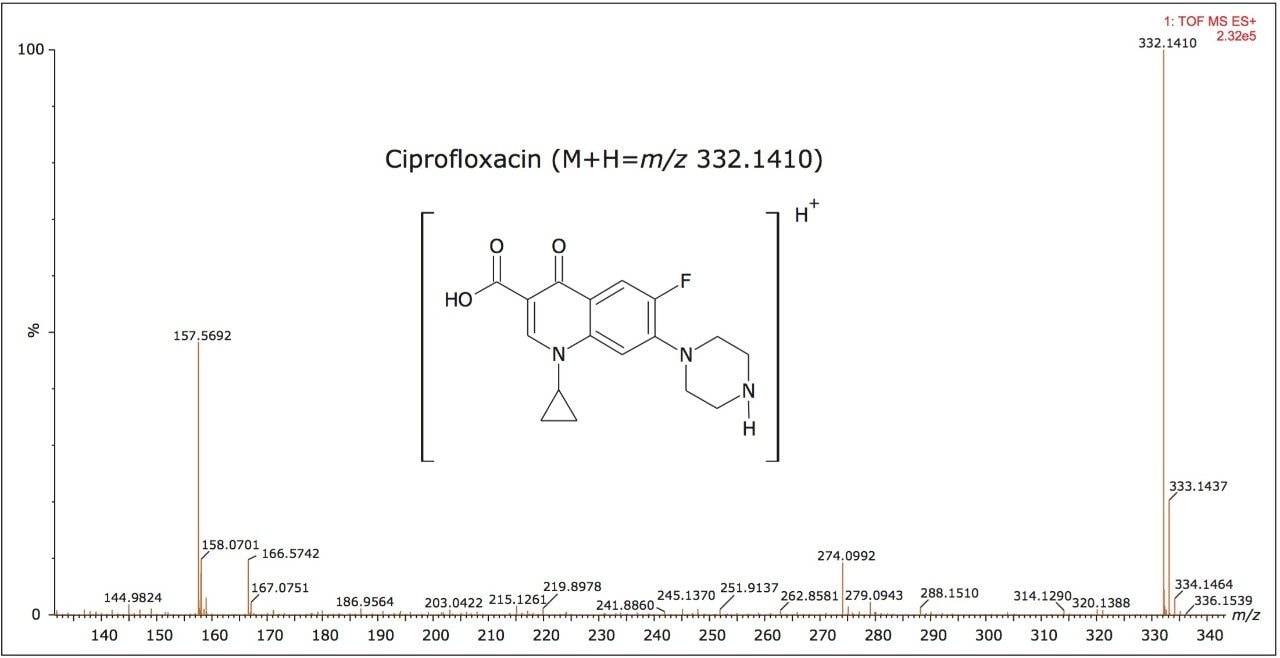
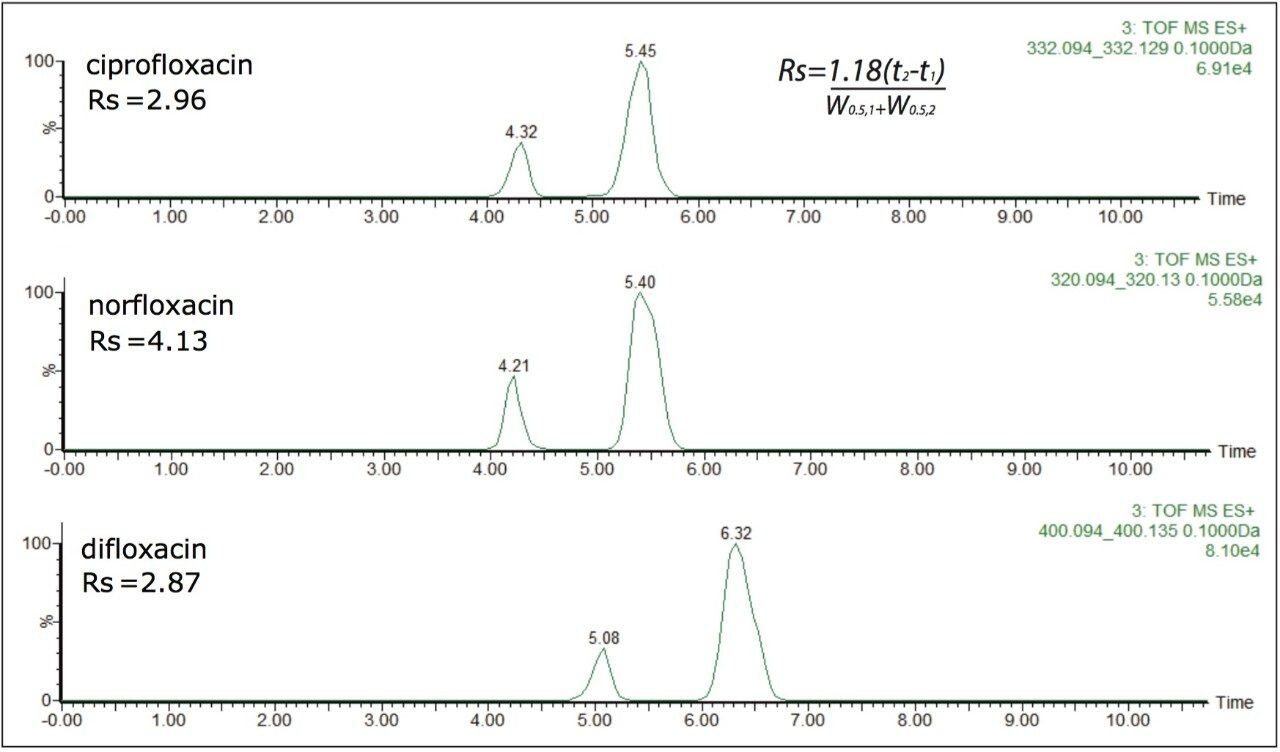
In Figure 4, the conventional MS spectrum generated in the UPLC HDMSE experiment is shown. At m/z 157 and m/z 166, two small, doubly charged ions of ciprofloxacin are apparent, indicating that ciprofloxacin did indeed also form a doubly charged species. Using ion mobility, it has been possible to separate and confirm that this small molecule does form a doubly charged species. The formation of the doubly charged species is dependent on the MS parameters used, especially the cone voltage. If the cone voltage is too high, the doubly charged species is not observed, only the [M+H]+.

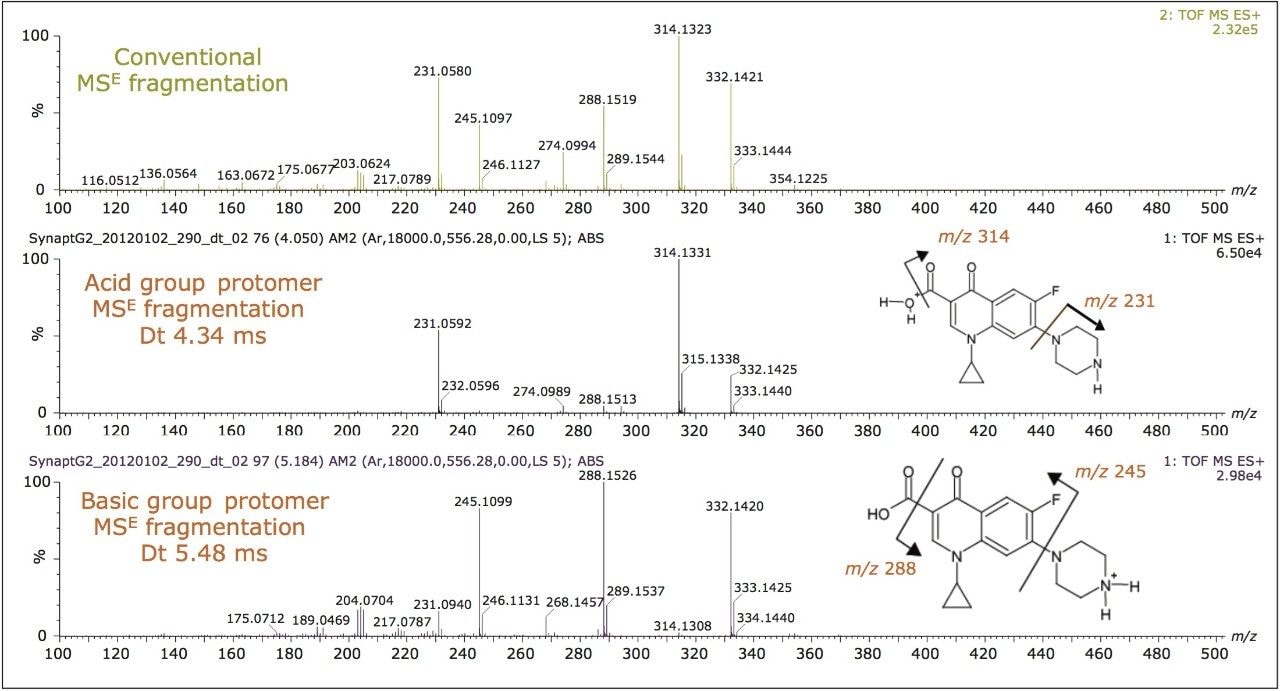
The data confirm that further consideration should be given to method development and the means of analysis chosen, since the ratio and formation of the protomers varies with eluent flow rate, capillary voltage, cone voltage, and matrix. If MRM is the method of choice, consideration of the experimental conditions used and the specific transitions selected is imperative. The data illustrate that consistency in MRM transitions in inter- and intra-laboratory studies could easily be misinterpreted within and between different laboratories, explaining the challenges of achieving reproducible results for these types of compounds. Ion mobility is a valuable tool for method development to ensure method robustness and consistent results.

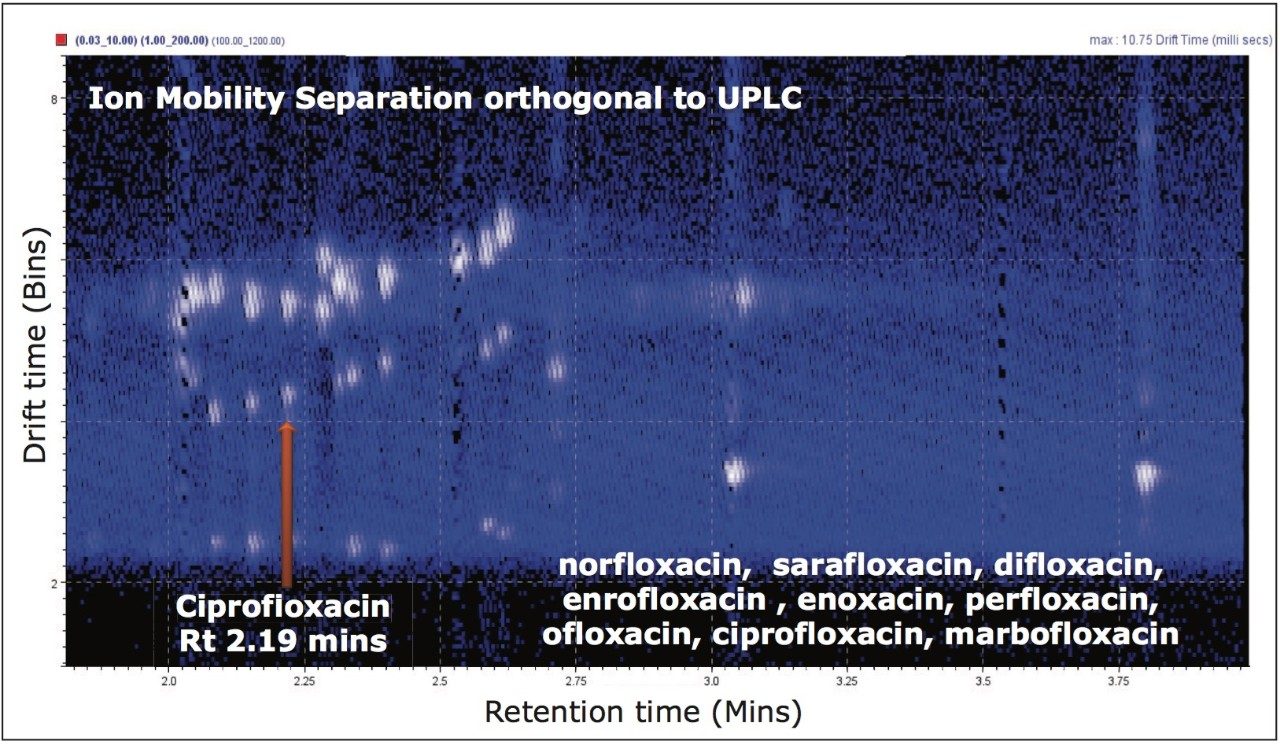
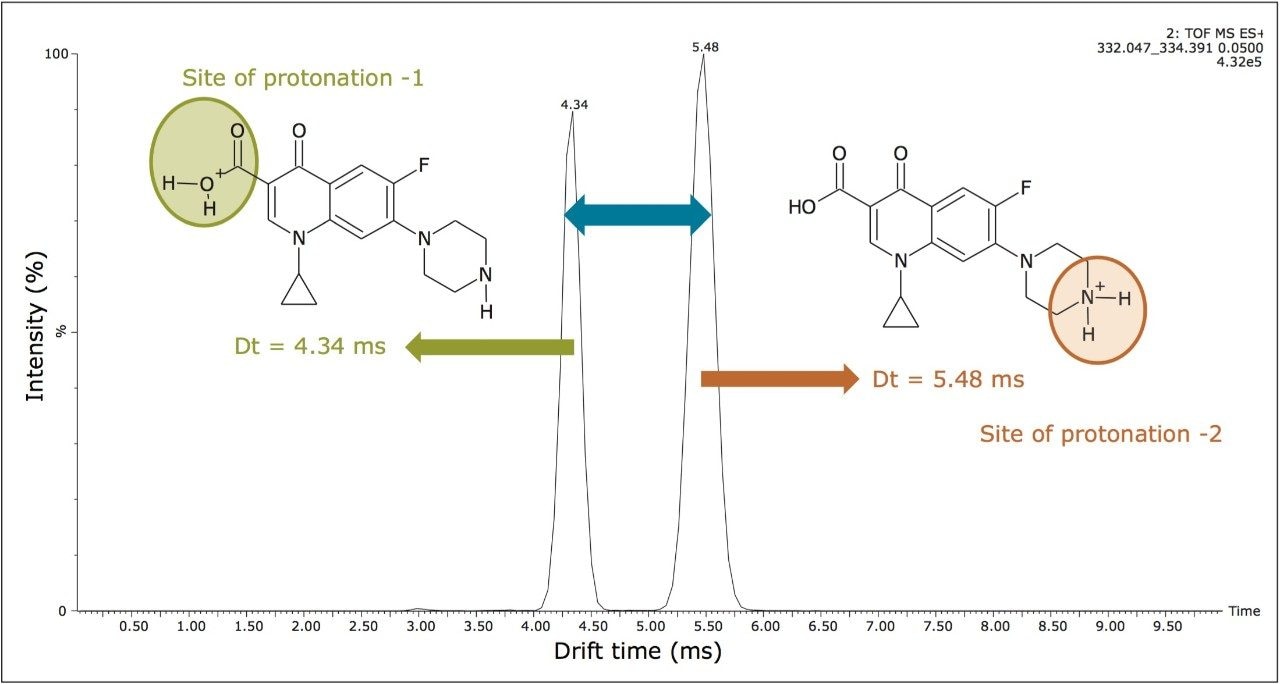
In addition to the scope of more specific and reliable method development, the drift times generated for the components analyzed can be used to produce an additional identification point. This application note described retention time, precursor ion accurate mass measurement, fragment ion accurate mass measurement, and two drift time values can be used as identification points for ciprofloxacin.

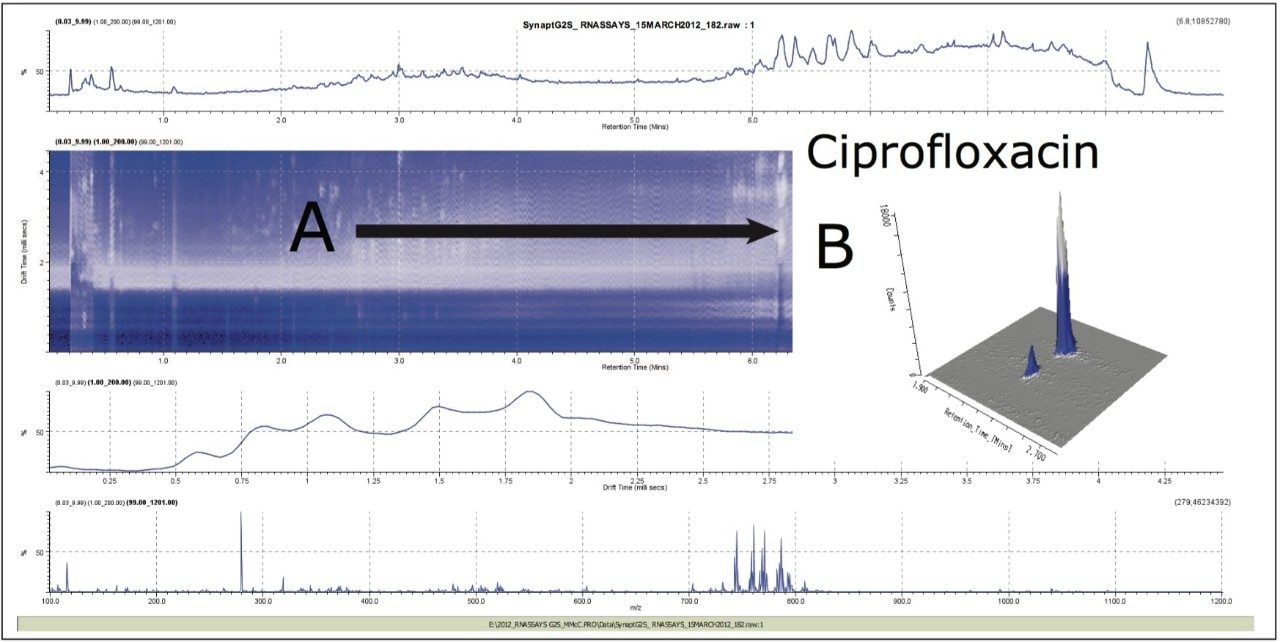
In addition to utilizing ion mobility to provide a new identification point, the orthogonal separation produced by ion mobility can be used for spectral cleanup. The plot of drift time versus retention time (Figure 8A) shows the ion intensity, represented by white pixels. The extent of the presence of matrix ions is shown by the expansive white color. The more intense analyte and matrix components are represented by the more vibrant white spots. However, it is difficult to see the low level target analytes due to the large amount of ion intensity produced by the matrix. In Figure 8B, the ciprofloxacin protomers have been extracted from the porcine matrix. Single component MS and fragmentation spectra can be produced from this clear, selective separation resulting from the use of ion mobility. The ratio of the acidic site protomer to the basic site protomer in the porcine matrix was determined to be 5:1 under these conditions. This is affected by capillary voltage, cone voltage, probe position, flow rate, and matrix. During infusion experiments, it was possible to vary the ratio of acidic/basic protomers and even change which was the most abundant protomer.

Illustration of matrix removal for ciprofloxacin in porcine extract
Figure 8. Illustration of matrix removal for ciprofloxacin in porcine extract, where the 3D display of the protomers of ciprofloxacin are shown for the injection of 1 μl of 2 x MRL.

Figures 9 and 10 illustrate the protomer arrival time distributions for ciprofloxacin, norfloxacin, and difloxacin,  as well as the calculated peak-to-peak resolution using N2 and CO2 drift gas, respectively. Although acceptable resolution was obtained using both gases, peak-to-peak values of Rs > 1.5 are considered to be fully resolved. Previous studies have considered the use of alternate drift gases to increase the ion mobility resolution.10-14

 Illustration of ion mobility separation
Figure 9. Illustration of ion mobility separation achieved for fluoroquinolone antibiotics using UPLC IMS with N2 drift gas. Peak-to-peak resolution was calculated at half height using the equation shown.
Illustration of ion mobility separation
Figure 10. Illustration of ion mobility separation achieved for fluoroquinolone antibiotics using UPLC IMS with CO2 drift gas. Peak-to-peak resolution was calculated at half height using the equation shown.

When performing IMS, the ion separation occurring in the travelling wave ion mobility (TWIM) drift cell is determined by the charge state, mass, shape, drift gas polarizability, as well as interaction between ion and neutral gas molecules. Increasing the polarizability of the drift gas increased the separation power (peak capacity) of TWIM in this application. As a result, the peak-to-peak resolution could be improved with consideration of the polarizability of the drift gas used, in this case CO2. The summary of the peak-to-peak resolution (Rs=1.18(ta-tb)/W0.5,a+W0.5,b) obtained using N2 or CO2 is shown in Table 1 (where Rs is the calculated resolution, the peak widths of peak A and B at half height are W0.5,a and W0.5,b respectively, and ta and tb are the respective drift times of peaks a and b). It can be seen that when using CO2 as the ion mobility drift gas, all the fluoroquinolone protomer pairs are fully resolved with peak-to-peak Rs between 2.61 and 4.13. The enhanced peak capacity using CO2 further improves the quality of the single component precursor ion and corresponding single-component fragmentation ion spectra obtained.

A comparison of peak-to-peak resolution for the protomers
Table 1. A comparison of peak-to-peak resolution for the protomers of nine fluoroquinolones separated using ion mobility with N2 and CO2 drift gases.

Conclusion

  • Based on the observations of the characteristic ionization for the fluoroquinolone compounds included in this study, using UPLC IMS MSE for method development purposes is warranted.
  • Separation of different intra-molecular protonated species has been uniquely achieved using ion mobility.
  • Multiple sites of protonation have been shown and identified from the different single-component fragmentation spectra.
  • Single-component precursor ion MS and MSE fragmentation spectra were simultaneously generated for all components.
  • The HDMSE observations have the potential to explain the differences that are sometimes observed in inter-laboratory studies where participants report results obtained from monitoring specific MRM transitions.
  • Drift time values can be used as an identification point in addition to retention time, precursor ion accurate mass, and accurate mass fragmentation spectra.
  • Ion mobility separations can be effectively utilized to resolve analyte peaks from matrix interferences and eliminate the need for complex sample cleanup and chromatographic separations.

References

  1. Final Decision of the Commissioner, Docket # 2000N-I 57 1 October 24, 2000, Withdrawal of the approval of the new animal drug application for enrofloxacin in poultry. Department of Health and Human Services, U.S. Food and Drug Administration.
  2. FDA Center for Veterinary Medicine, June 2, 1997, FDA Order Prohibits Extralabel Use Of Fluoroquinolones And Glycopeptides.
  3. Official Journal of the European Union, L268:29-43, Regulation (EC) No 1831/2003 of the European Parliament and of the Council of 22 September 2003 on additives for use in animal nutrition.
  4. Official Journal of the European Union, L24:1-8 Annex I, Council Regulation (EEC) No 2377/90 of 26 June 1990 laying down a Community procedure for the establishment of maximum residue limits of veterinary medicinal products in foodstuffs of animal origin.
  5. Verdon E, Couedor P, Roudaut B, Sandérs PJ. Multiresidue Method for Simultaneous Determination of Ten Quinolone Antibacterial Residues in Multimatrix/Multispecies Animal Tissues by Liquid Chromatography with Fluorescence Detection: Single Laboratory Validation Study. AOAC Inter. 2005; 88:1179-1192.
  6. Kaufmann A, Butcher P, Maden K, Widmer M, Giles K, Uria D. Are liquid chromatography/electrospray tandem quadrupole fragmentation ratios unequivocal confirmation criteria? Rapid Commun. Mass Spectrom. 2009; 23: 985-998.
  7. Mol HG, Zomer P, de Koning M. Qualitative aspects and validation of a screening method for pesticides in vegetables and fruits based on liquid chromatography coupled to full scan high resolution (Orbitrap) mass spectrometry. Anal Bioanal Chem. 2012; 403:2891-2908.
  8. Croley TR, White KD, Callahan JH, Musser SM. The chromatographic role in high resolution mass spectrometry for non-targeted analysis. J Am Soc Mass Spectrom. 2012; 23:1569. 
  9. Commission Decision (2002/657EEC) Official Journal of the European Communities 2002.
  10. Lalli PM, Iglesias BA, Toma HE, de Sá GF, Daroda RJ, Silva Filho JC, Szulejko JE, Araki K, Eberlin MN. Protomers: formation, separation and characterization via travelling wave ion mobility mass spectrometry. J Mass Spectrom. 2012; 47(6):712-9.
  11. Eberlin MN, Lali PM, Nachtigall FM, Riccio MF, de Sa GF, Daroda RJ, de Souza V, Campuzano I, Souza GHMF. SYNAPT HDMS: Improving Ion Mobility Separation by Increasing Drift-Gas Polarizability. Waters Technical Note 720003201en. 2009 October.
  12. Jurneczko E, Kalapothakis J, Campuzano IDG, Morris M, Barran PE. Effects of drift gas on collision cross sections of a protein standard in linear drift tube and traveling wave ion mobility mass spectrometry. Anal Chem. 2012; 84(20):8524-31.
  13. Asbury GR, Hill HH. Using different drift gases to change separation factors (alpha) in ion mobility spectrometry. Anal. Chem. 2000; 72(3): 580-4.
  14. Fasciotti M, Sanvido GB, Santos VG, Lalli PM, McCullagh M, de Sá GF, Daroda RJ, Petera MG, Eberlina MN. J Mass Spectrom. 2012; 47(12):1643-7.

720004720, June 2013

Back To Top Back To Top