Structural Analysis of an O-Glycopeptide Derived from Recombinant Erythropoietin by SYNAPT™ High Definition Mass Spectrometry (HDMS™ )
Abstract
This application note demonstrates that the SYNAPT HDMS System is a powerful tool for the detailed characterization on glycosylated therapeutic protein.
Introduction
Many therapeutic proteins contain carbohydrate moieties (glycans) on the side chain of an amino acid as a result of post-translational modifications (PTMs). The glycosylation on a protein drug can play an important role in in vivo activity, molecular stability, solubility, serum half-life, and immunogenicity.
The existence of multiple glycans on the same polypeptide backbone creates a mixture of “glycoforms” of a therapeutic protein. It is well acknowledged that certain degree of glycosylation heterogeneity occurs to most natural and recombinant glycoproteins.1 Therefore, knowledge about the glycosylation structures of the biomolecule is crucial from both a regulatory and business standpoint. The glycosylation heterogeneity must be shown to a regulatory agency to be consistent within specifications and between manufacturing batches. On the other hand, glycan differences between expressed versions of the same recombinant glycoprotein may raise questions on whether the drug is patentable.
Due to the high structural diversity of glycans and the amino acid sequence variations of proteins, glycosylation characterization is a complex task that involves many different analytical techniques. A successful analytical strategy for glycosylation characterization needs to reveal the glycosylation sites of both N- and/or O-linked glycans and to identify the types of carbohydrate structures present at each glycosylation site. To address this site-specific carbohydrate heterogeneity, mass spectrometry has become the method of choice.
Compared to N-glycosylations, site-specific characterization of O-glycosylation by mass spectrometry is inherently more challenging. The analytical difficulties arise from many intrinsic factors associated with this type of glycosylation, such as no consensus amino acid sequence for O-glycan attachment, varied glycan chain length and branching pattern, and lack of common carbohydrate core types at the attachment sites.
Traditional methods that involve the analysis of the released O-glycans after chemical or enzymatic deglycosylation may provide a detailed structural characterization for the glycans derived from a protein, but information on the original attachment sites of the glycans and the micro-heterogeneity of each occupation site is lost. Although this critical information can be obtained by the analysis of the deglycosylated peptides, the method is time consuming and the information is difficult to confirm by an orthogonal analytical method.
Direct analysis of glycopeptides by tandem mass spectrometry (MS/MS) represents a rapid and sensitive method to obtain site-specific characterization on O-glycosylation. It can provide information on glycan structure, glycan attachment site, and peptide sequence within one single experiment. However, direct fragmentation of O-glycopeptides normally generates very complex mass spectra that contain fragment peaks from the intact or truncated glycan chains as well as the deglycosylated peptide backbones (after the complete loss of O-glycan chain). This heterogeneity, together with the superimposition of various charge states, makes the MS/MS spectra interpretation difficult. As a result, the successful application of this approach to the site-specific O-glycosylation is rather limited. Here we present a study that uses a novel MS system that combines high-efficiency ion-mobility based separations (IMS) with highperformance tandem mass spectrometry, utilizing the Waters SYNAPT High Definition MS (HDMS) System to characterize an O-linked glycopeptide from recombinant Erythropoietin (EPO).
The approach takes advantage of Triwave™ Technology (which utilizes a unique dual-collision-cell design combined with ion-mobility separations) to perform a time-aligned-parallel (TAP) fragmentation (Figure 1) of O-glycopeptides, in which information on the glycan sequence and the glycosylation site is simultaneously obtained.2
The results demonstrate the benefit of enabling dual-stage fragmentation where the independently-controlled collision induced dissociation provides an increase in the information obtained to describe site-specific characterization of the glycopeptide.
Experimental
Recombinant Erythropoietin (Human, CHO cells) was purchased from EMD Biosciences, Inc (La Jolla, CA). The protein was reconstituted at a concentration of 0.5 mg/mL in 50 mM ammonium biocarbonate (pH 8.0) with 0.1% RapiGest™. The sample was incubated at 60 °C for 30 min, then reduced with 5.0 mM DTT at 37 °C for 30 min, and alkylated with 10mM of Iodoacetamide (IAA) in the dark for 45 min. Trypsin digestion was performed overnight at 37 °C (trypsin/protein ratio, 1:20, w/w). The digest was diluted to 0.15 mg/mL with 0.1% formic acid (FA) prior to injection.
LC Conditions
|
LC system: |
Waters nanoACQUITY UPLC® |
|
Column: |
Atlantis® dC18 3 µm, 300 µm x 100 mm |
|
Column temp.: |
40 °C |
|
Flow rate: |
5 µL/min |
|
Mobile phases: |
Eluent A: Water with 0.1% FA Eluent B: ACN with 0.1% FA |
|
Gradient: |
1% to 50% B in 30 min |
|
Sample inj. vol.: |
5 µL |
MS Conditions
|
MS system: |
Waters SYNAPT HDMS |
|
Ionization mode: |
ESI + |
|
Capillary voltage: |
3.2 kV |
|
Cone voltage: |
33 V |
|
Desolvation temp: |
250 °C |
|
Desolvation gas: |
200 L/Hr |
|
Source temp.: |
105 °C |
|
Acquisition range: |
100 to 2100 m/z |
|
IMS gas: |
N2 |
|
IMS gas pressure: |
0.5 mbar |
|
Pulse height: |
Variable, 7.5 to 9.5 V |
TAP Fragmentation
|
TRAP T-Wave™ collision energies: |
30 to 50 V |
|
TRANSFER T-Wave CE (alternated): |
5 V (low) 60 to 100 V (high) |
Results and Discussion
The analytical objective is to obtain the glycan sequence and confirm the glycosylation site of an O-glycopeptide from recombinant Erythropoietin using the TAP fragmentation method. To perform TAP fragmentation using the SYNAPT HDMS Mass Spectrometer, O-glycopeptide of interest (m/z 1061.6, MH22+) is first selected by the quadrupole ion filter and subsequently transferred into the TRAP cell of the Triwave (Figure 1). The collision energy of the TRAP T-Wave collision cell is optimized for glycan fragmentation using a CE of 35 V, since more energy is required to achieve efficient fragmentation of the peptide backbone.
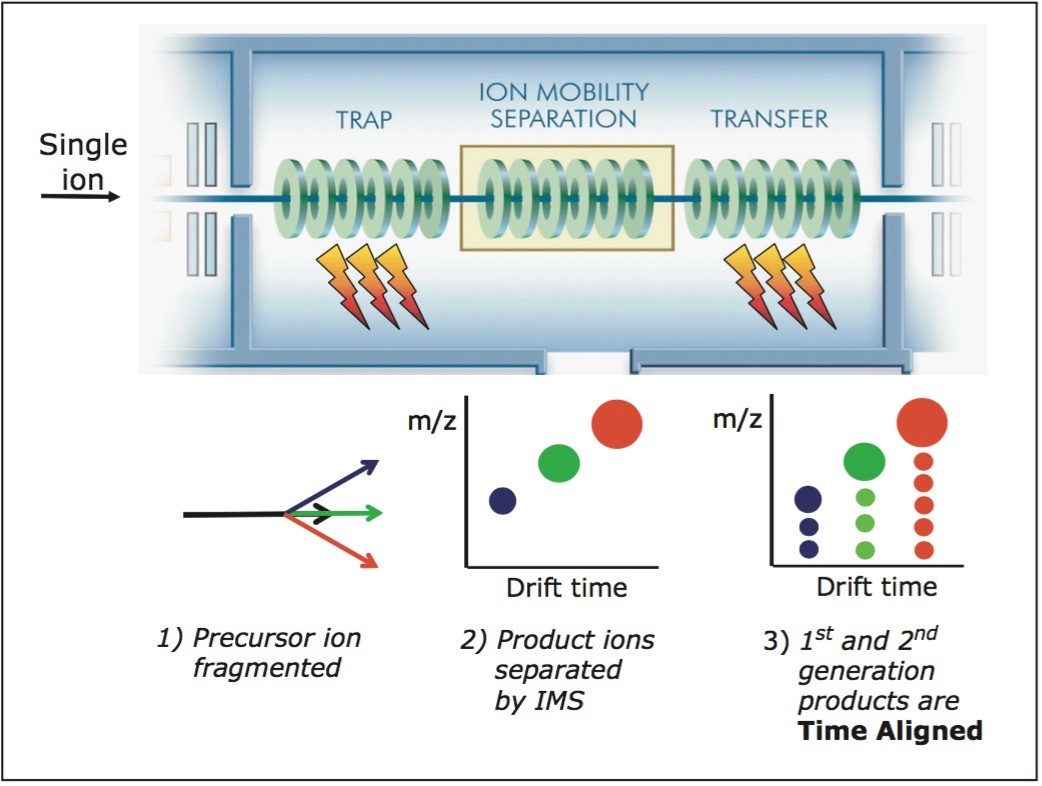
1) Precursor ion of interest is selected by the quadrupole and fragmented in the TRAP T-Wave.
2) The resulting first-generation product ions are separated according to their mobility in the IMS T-Wave.
3) The first-generation product ions are subjected to an additional stage of fragmentation in the TRANSFER T-Wave.
All first-generation product ions are fragmented in the TRANSFER T-Wave, a parallel process; the second-generation product ions are Time Aligned to the original first-generation ions.
The fragment ions generated in the TRAP T-Wave collision cell of SYNAPT HDMS were then transported into the IMS T-Wave where ions were separated into individual packets on the basis of their ion mobility (combination of size, shape, and charge, as well as mass). The ion-mobility-separated fragment ions were subsequently transported through the TRANSFER T-Wave collision cell in which the collision energy was alternated between two settings (high and low).
When the collision energy of the TRANSFER T-Wave is set at a low energy (normally at 5 V), no additional fragmentation takes place in the TRANSFER T-Wave. Fragment ions observed in this scan would only represent the fragments generated in the TRAP T-Wave. Thus MS/MS data recorded in this process would contain information only for the deduction of the glycan sequence of the O-glycopeptides.
Figure 2A shows the ion-mobility-separated fragments (m/z versus drift time displayed in DriftScope™ Software) generated from this process, and the summed mass spectrum is shown in Figure 2B. From Figure 2B, it can be seen that fragmentation of the peptide backbone under the chosen conditions is negligible. After mass analysis of the processed MS/MS data, the glycan sequence of NeuNAc-Hex-HexNAc can be easily deduced (Figure 2C). The glycan sequence matches that which is reported about the O-glycan sequence of Erythropoietin in literature.3
The O-glycopeptide from Erythropoietin contains two potential glycosylation sites at positions 6 and 12 from the C-termini of the peptide (Sequence: EAISPPDAASAAPLR). To define which position is the carbohydrate attachment site, we focus on the fragment ion that has m/z value of 834.84 (Figure 2B). Mass analysis on the fragment suggests that this ion comes from a peptide that contains a single HexNAc attached to the glycosylated residue of the O-glycopeptide. The presence of the extra HexNAc serves as an indicator of a glycosylation site because mass spectral peaks covering the attachment site would ordinarily show a mass increase in the MS/MS spectrum compared to the ones generated from un-modified sites.
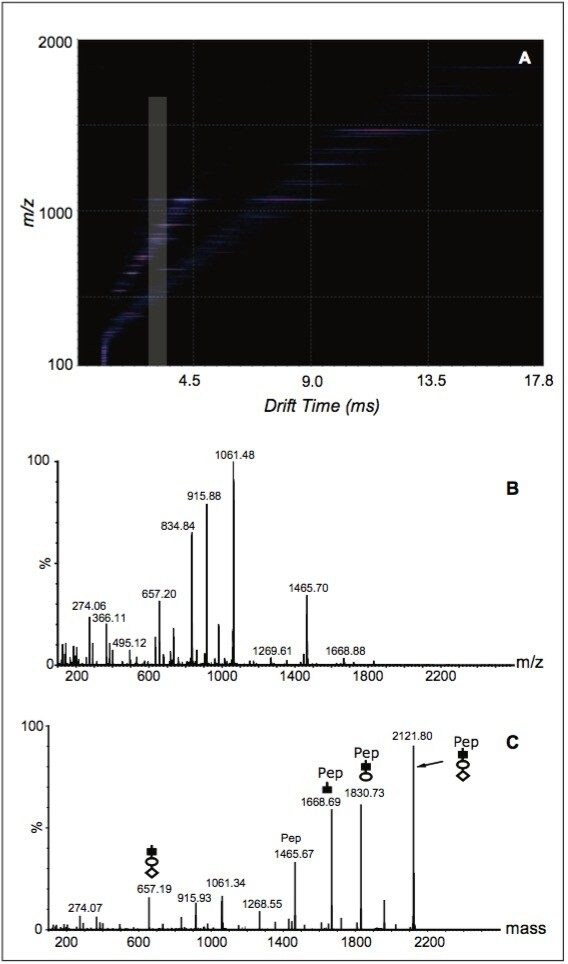
A) m/z versus drift time for the fragments from the O-glycopeptide. The highlighted region shows the drift-time span for the fragment ion with m/z 834.34.
B) Summed raw ESI-IMS-TOF spectrum of all the fragments from the first-stage fragmentation, during which only the cleavages of the O-glycan occurred.
C) MS/MS spectrum from MaxEnt™ 3 deconvolution of the data in Figure 2B. MaxEnt 3 converts peaks with multiply charge states into the singly charged state for easy sequence deduction. Symbols: (▮) HexNAc (○) Hex (◊) NeuNAc.
To obtain the fragmentation of this precursor, the collision energy of the TRANSFER T-Wave is increased to a higher energy (typically 60 to 100V) in the second scan, and the ion-mobility-separated product ions are subjected to a second-generation fragmentation at which peptide backbone cleavage would occur.
Figure 3A shows the corresponding data, in DriftScope Software, obtained from the O-glycopeptide fragments after the collision energy of the TRANSFER T-Wave was raised to 80 V. Figure 3B displays the mass spectrum that is generated by combining all the fragmentation data from drift time 3.45 ms to 3.78 ms.
Since these product ions all share the same drift time as the precursor ion (m/z 834.84, Figure 2A), these fragment ions all come from the same precursor, and the reconstructed spectrum over that range of drift times corresponds to the peptide sequence of the precursor.
In Figure 3B, two series of fragment ion peaks are observed (labeled with red or blue letters). The ion series labeled by red letters correspond to a mass increase of 203 Da when compared to those labeled by blue letters, implying these are the fragments containing the HexNAc at the glycosylation site.
Since the mass difference between y12 (m/z 1355.57) ion and y11 (m/z 1268.67) ion of this ion series is only 87 Da, it can be deduced that the O-glycosylation site is on the serine residue at position 6 not at position 12.
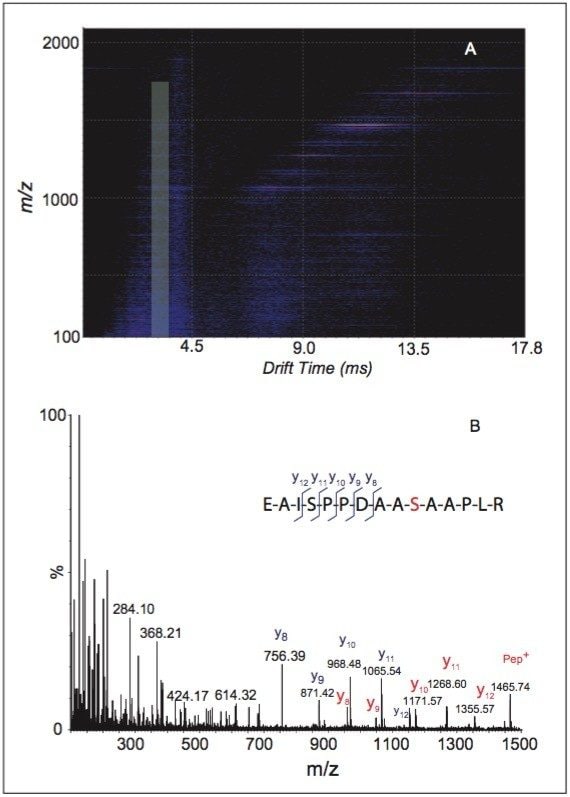
A) HDMS data (m/z versus drift time, DriftScope Software) of the second generation of fragment ions following CID in the TRANSFER T-Wave (CE of 80V). The boxed highlight region represents the distribution of the second-generation product ions from the precursor m/z 834.84 as shown in DriftScope (note the precursor and fragments share the same drift time).
B) Reconstructed MS spectrum from the boxed region in Figure 3A with sequence ions annotated. The red letters annotate the ions from the peptide with an attached HexNAc at position 6 (serine residue in red), whereas the blue letters label the fragments generated by the peptide without any modification (due to the loss of HexNAc before the fragmentation of peptide backbone occurs).
Conclusion
A time-aligned-parallel (TAP) fragmentation approach is applied to site-specific characterization of an O-glycopeptide. Using this method, both the glycosylation site and glycans sequence of the O-glycopeptide from Erythropoietin are obtained in a single experiment.
These results indicate that the SYNAPT HDMS System is a powerful tool for the detailed characterization on glycosylated therapeutic protein, providing critical information:
- to understand the immunogenicity of the drug
- to control the production reproducibility of the drug
- to meet the regulatory approval requirements for the drug
References
- Medzihradszky KF. Methods Enzymol. 405, 116–38.
- The Traveling Wave Device Described Here Is Similar to That Described by Kirchner in U.S. Patent 5,206,506 (1993).
- Sasaki H, Ochi N, Dell A, Fukuda M. Biochemistry 1988; 27, 8618–26.
Featured Products
720002918, August 2022