Shielding Peptides from Light: Optical Filtering Strategies for PDA Detection Coupled with Mass Spectrometry Verification
Corey E. Reed, Paula Hong
Waters Corporation, United States
Published on April 13, 2026
Abstract
Photooxidation within Photodiode Array (PDA) Detector flow cells can compromise the integrity of UV-sensitive analytes, particularly peptides containing oxidation prone aromatic residues. This study evaluates the effectiveness of optical filtration in the Alliance™ iS Bio PDA System for reducing light induced degradation during LC–MS analysis. Two optical filters - a 214 nm long pass (LP) and a 220 nm band pass (BP) - were installed in the PDA Detector and assessed using enolase T35 and enolase T37, peptides known for their susceptibility to photooxidation. Real time mass confirmation with the ACQUITY™ QDa™ II Mass Detector enabled simultaneous monitoring of native and oxidized species.
Both filters significantly improved preservation of the non oxidized peptides and reduced formation of their oxidized counterparts, with the 220 nm BP filter providing the greatest overall protection. The enhanced stability is consistent with the peptides’ physical characteristics: each contains multiple tryptophan or tyrosine residues which absorb strongly in the deep UV region and are highly reactive toward photooxidative pathways. Filtering out high energy wavelengths effectively mitigated photodegradation, maintaining intact peptide signal intensity and suppressing oxidative byproducts.
The Alliance iS Bio PDA System’s integrated filter slot along with in-line mass detection of native and oxidized species offered streamlined method development and enable rapid evaluation of photostability. Overall, this work demonstrates that optical filtration is a simple, practical, and highly effective approach for minimizing photooxidation and improving analytical robustness when working with UV-labile biomolecules.
Benefits
- Alliance iS Bio PDA System offers several optical filters, including the 214 nm LP and 220 nm BP, that reduce photodegradation of UV-sensitive peptides
- The Alliance iS Bio PDA System enables straightforward installation of optical filters directly within the detector
- Real-time mass confirmation with the ACQUITY QDa II Mass Detector for rapid and efficient method development
Introduction
Therapeutic peptide characterization using optical and mass-spectrometric detection is essential for assessing drug safety, efficacy, and overall product quality. Because biologic therapeutics are susceptible to structural modification, they must be rigorously monitored throughout manufacturing and storage. PDA detection plays a particularly important role during analytical method development and optimization. Its full-spectrum acquisition enables precise wavelength selection, verification of peak identity, and detection of structural perturbations through spectral shifts.1 By collecting full spectrum ultraviolet (UV) simultaneously across a defined wavelength range, the PDA generates a three dimensional representation of UV absorbance, providing enhanced insight into analyte behavior. After a method has been fully developed and validated, routine testing may be performed using a Tunable UV (TUV) Detector; however, PDA detection remains indispensable during the initial development phase.
Although implementation of a TUV Detector is often the ultimate objective for routine therapeutic peptide analysis, a critical challenge must be addressed during the method development stage when a PDA Detector is employed. A PDA exposes analytes to substantially higher photon energy within the flow cell compared to fixed wavelength detection methods such as TUV. In a PDA, the full spectrum of light is presented to the sample whereas TUVs filter light via grating prior to reaching the sample. This elevated light exposure increases the energy imparted to analyte molecules as they traverse the optical path, creating the potential for conformational perturbations as well as the formation of light induced impurities, including photodegradation and photooxidation products.2 Such alterations introduced at the detector level may impact the evaluation of purity, potency, and overall safety of the native drug substance, making it essential to evaluate and control these effects during analytical development.
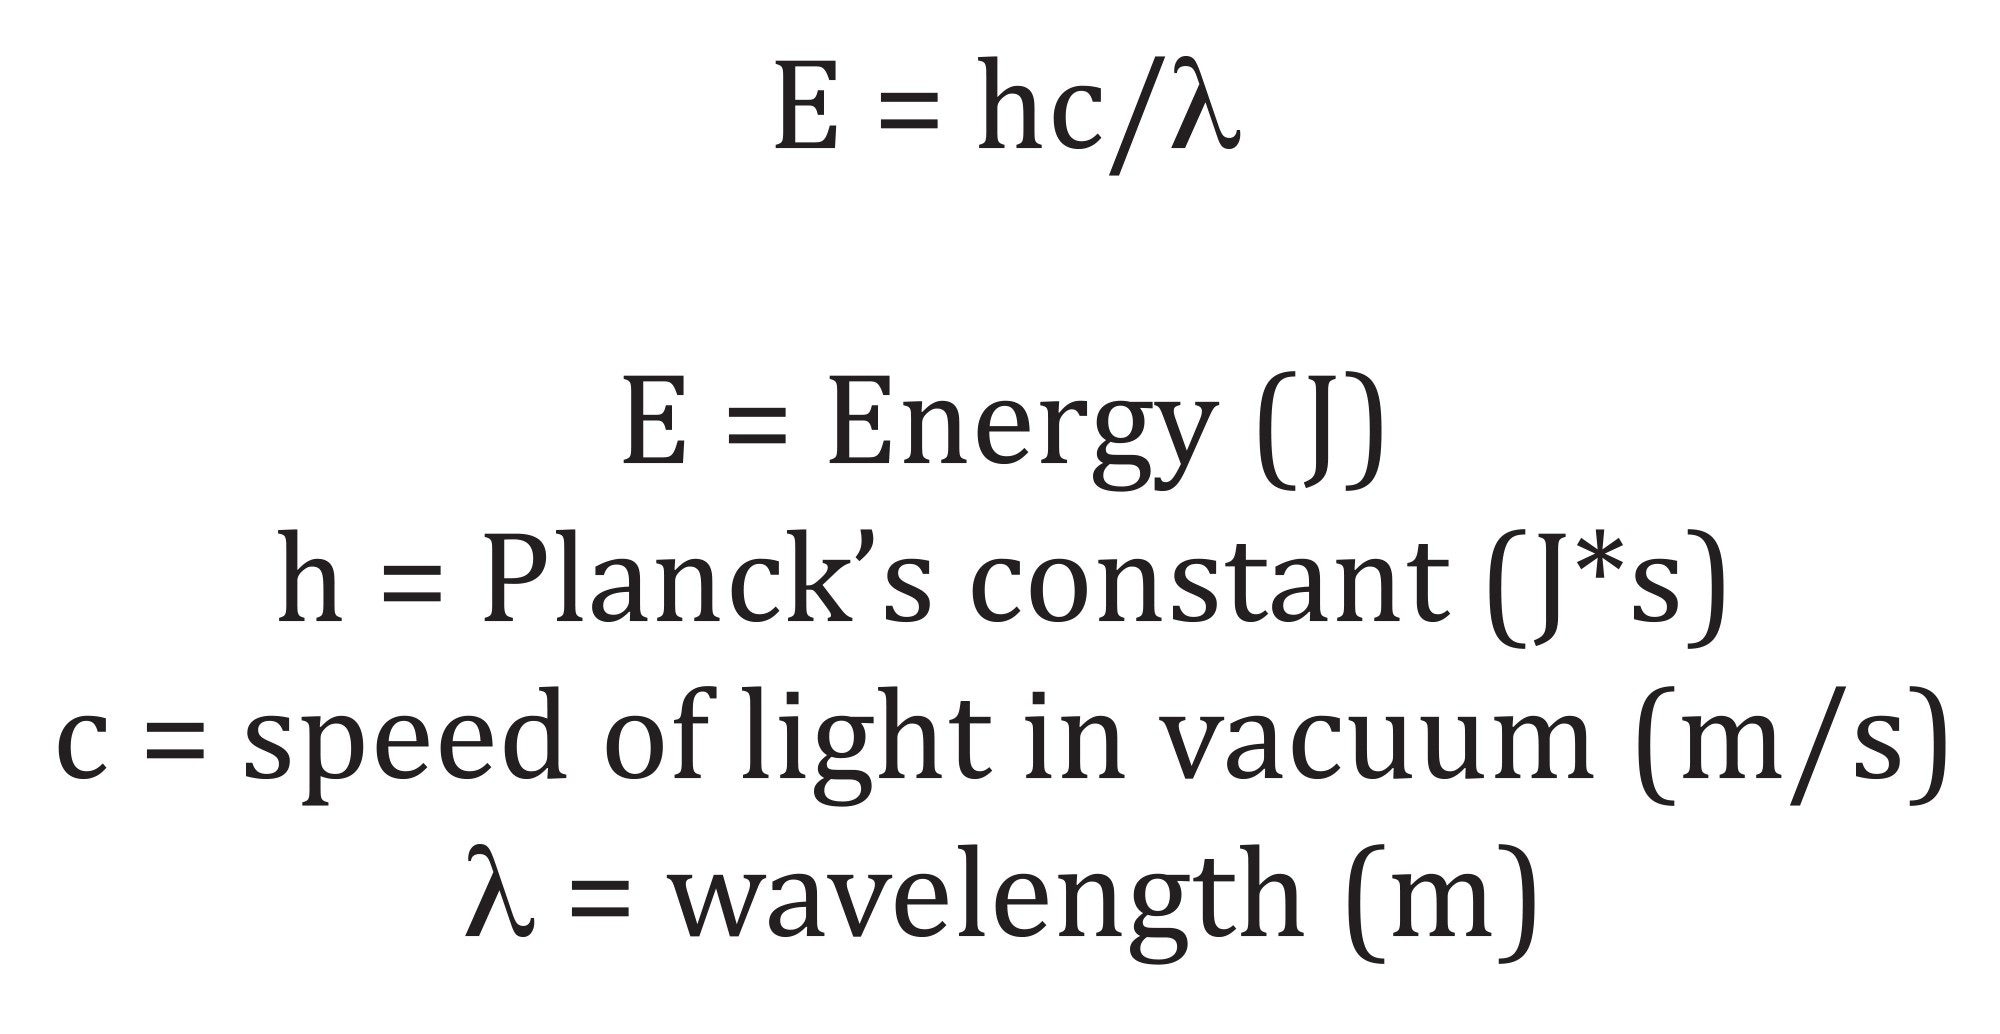
A practical strategy for mitigating light induced artifacts during PDA based method development is the incorporation of an optical filter positioned between the detector’s light source and the flow cell window. By selectively attenuating portions of the emitted spectrum, the filter reduces the photon flux reaching the analyte and thereby decreases the likelihood of instrument induced photodegradation. Because shorter wavelengths carry higher photon energy, filtering out the lower wavelength region of the spectrum (e.g., <214 nm) is generally more effective than attenuating longer wavelengths (e.g., >400 nm), consistent with the energy–frequency relationship described by Planck’s equation (Equation 1).3 Several classes of optical filters are available, each operating through distinct spectral selection mechanisms. In this study, two types of filters were studied: LP filters, which block all wavelengths below a defined cutoff, and BP filters, which transmit only a narrow spectral window while excluding wavelengths both below and above that range.
Evaluating the influence of an optical filter on the formation of degradation adducts or structural modifications introduces an additional chromatographic challenge. Because light induced changes occur within the detector flow cell, no intentional chromatographic separation exists between the parent analyte and any photogenerated degradants at the point of detection. Consequently, an optical detector positioned downstream of the PDA will register a single, coeluting peak containing both species. One possible approach to identify degradants is to collect the eluting fraction and reinject it under modified chromatographic conditions to achieve separation. However, this strategy depends on the degradants possessing sufficient structural or chemical differences to resolve from the main peak and is both labor intensive and time consuming. A more direct and analytically robust solution is to incorporate mass spectrometric detection in-line, enabling simultaneous observation of both the intact analyte and any light induced degradation products via differences in mass-to-charge ratio (m/z), regardless of chromatographic coelution.
In this study, an Alliance iS Bio PDA System coupled with an ACQUITY QDa II Mass Detector was employed to evaluate the impact of optical filtering on the formation of photooxidation byproducts within the PDA flow cell. A full spectrum scan was utilized in the PDA Detector to maximize photon exposure as peptide analytes passed through, thereby promoting the highest degree of light induced oxidation. Two peptides known to be susceptible to oxidative modification were monitored using the ACQUITY QDa II Mass Detector, along with their corresponding oxidized species. Subsequently, a 214 nm LP filter and a 220 nm BP filter were introduced, and the resulting changes - specifically, the increase in non oxidized analyte and the reduction in photooxidation products - were quantitatively assessed.
Experimental
LC Conditions
|
LC system: |
Alliance iS Bio PDA System |
|
Sampling rate: |
10 Hz |
|
2D channel: |
220 nm, 4 nm resolution |
|
3D channel: |
190–800 nm, 1 nm resolution |
|
Vials: |
QuanRecovery with MaxPeak™ HPS Vial (p/n: 186009168) |
|
Column(s): |
XSelect™ CSH™ C18 Column, 130 Å, 2.5 µm, 4.6 X 150 mm (p/n: 186006729) |
|
Column temperature: |
60 ˚C w/ active pre-heater enabled |
|
Sample temperature: |
6 ˚C |
|
Injection volume: |
25 µL |
|
Mobile phase A: |
0.1% Formic Acid in Water |
|
Mobile phase B: |
0.1% Formic Acid in Acetonitrile |
|
Wash solvents: |
90/10, Water/Methanol |
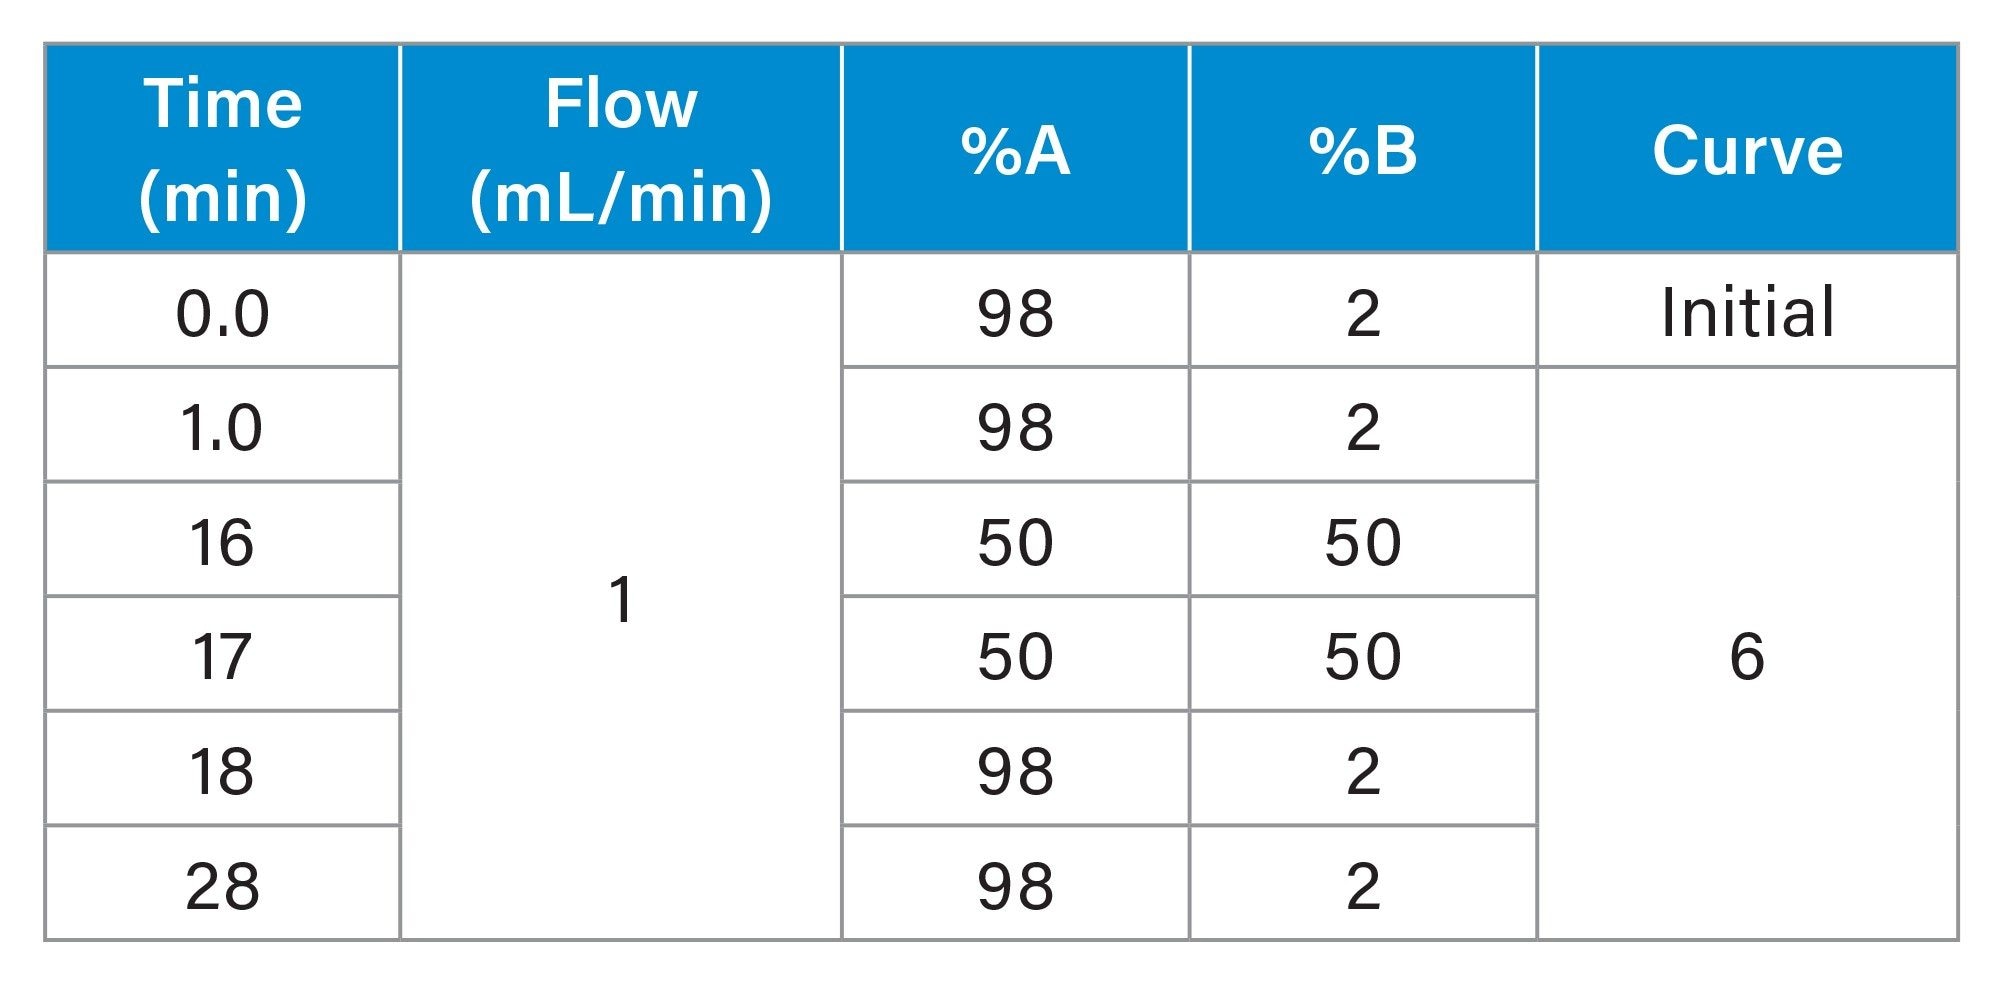
Gradient Table
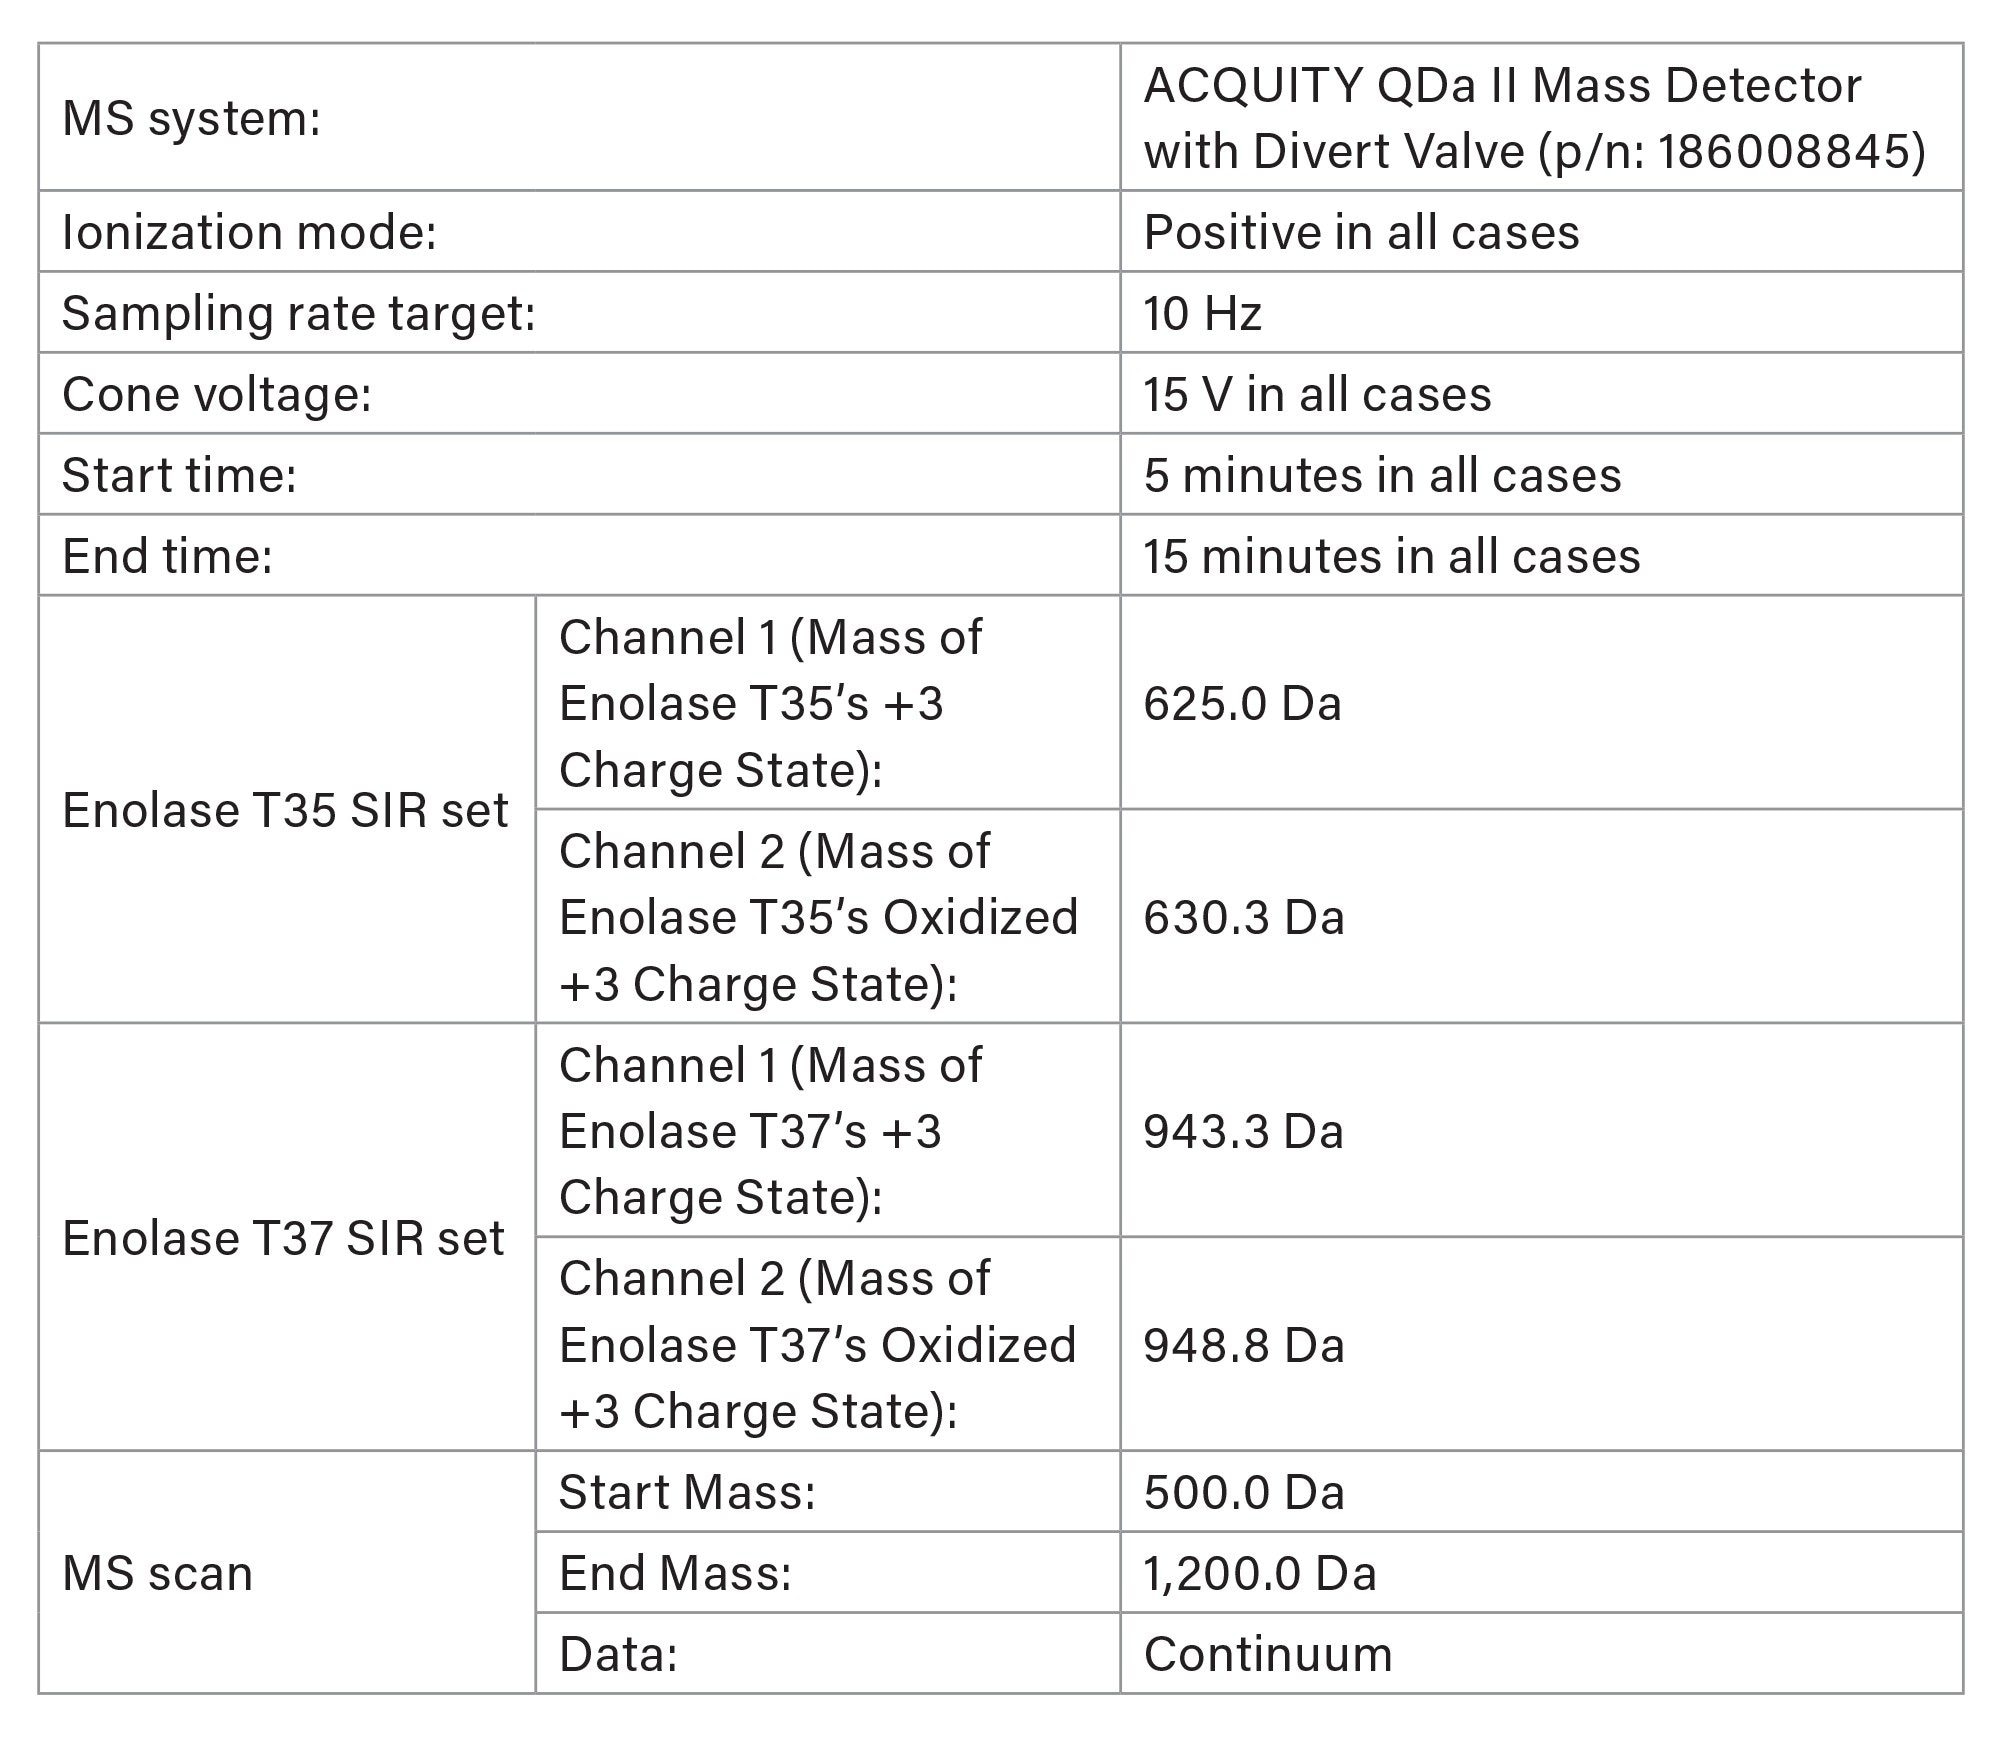
MS Conditions
Data Management
|
Data Management: |
Empower™ 3.10 Chromatography Data System |
Results and Discussion
Shorter wavelengths of light carry higher photon energy, and as analytes pass through the PDA Detector flow cell, this energy can promote photochemical reactions that alter molecular structure. Optical filters that attenuate the lower-wavelength region of the spectrum therefore have the potential to better preserve analytes that are susceptible to photodegradation. The 214 nm LP filter blocks all wavelengths below 214 nm, whereas the 220 nm BP filter transmits only a narrow window between 215 nm and 225 nm. Because both filters reduce exposure to high energy deep UV light, each may mitigate photodegradation, although the relative degree of protection depends on the analyte’s absorption characteristics and the spectral distribution of the detector’s light source.
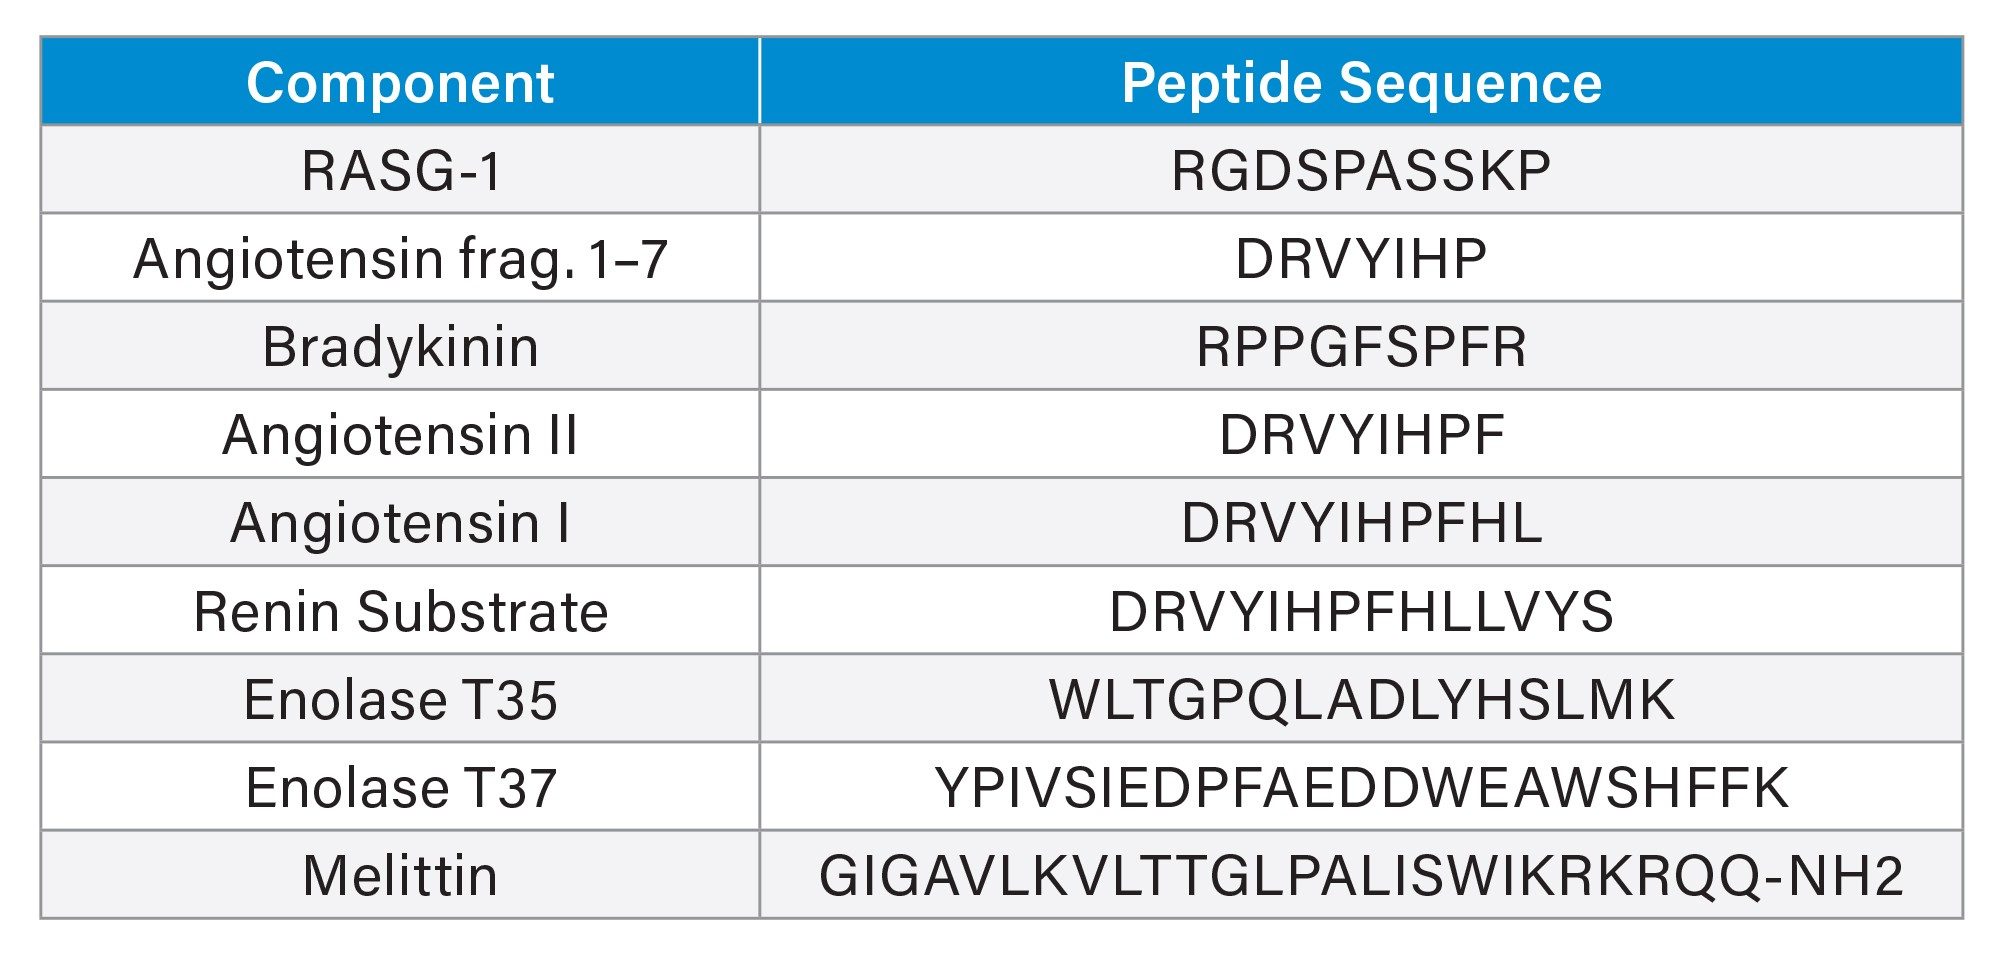
The MassPREP Peptide Standard includes two peptides - enolase T35 and enolase T37 - that are well known for their propensity to undergo photooxidation. Examination of their sequences (Table 1) provides insight into this behavior. These peptides contain the amino acids methionine (M), tryptophan (W), and tyrosine (Y) which are highly susceptible to photooxidation due to the electronic structure and reactivity of their side chains.4 When these residues occur at or near the termini of short peptides, they are more solvent exposed and less sterically hindered, increasing their interaction with UV light and reactive oxygen radicals generated within the PDA flow cell.
Figures 1 and 2 compare the extracted +3 charge state chromatograms for the non oxidized (Native) and oxidized forms of the Enolase T35 and T37 peptides under each filtering condition. In both peptides, the unfiltered condition produced markedly diminished response for the non oxidized species accompanied by a pronounced increase in the corresponding oxidized peaks, consistent with substantial photoinduced degradation in the PDA flow cell. Introduction of the 214 nm LP filter improved preservation of the native peptides and reduced formation of the oxidized products, although the extent of protection was modestly lower than that achieved with the 220 nm BP filter. The BP filter yielded the highest relative abundance of the native peptide and the greatest suppression of the oxidized species, indicating more effective reduction of overall light exposure. Quantitative summaries of these chromatographic trends are presented in Figures 3 and 4.
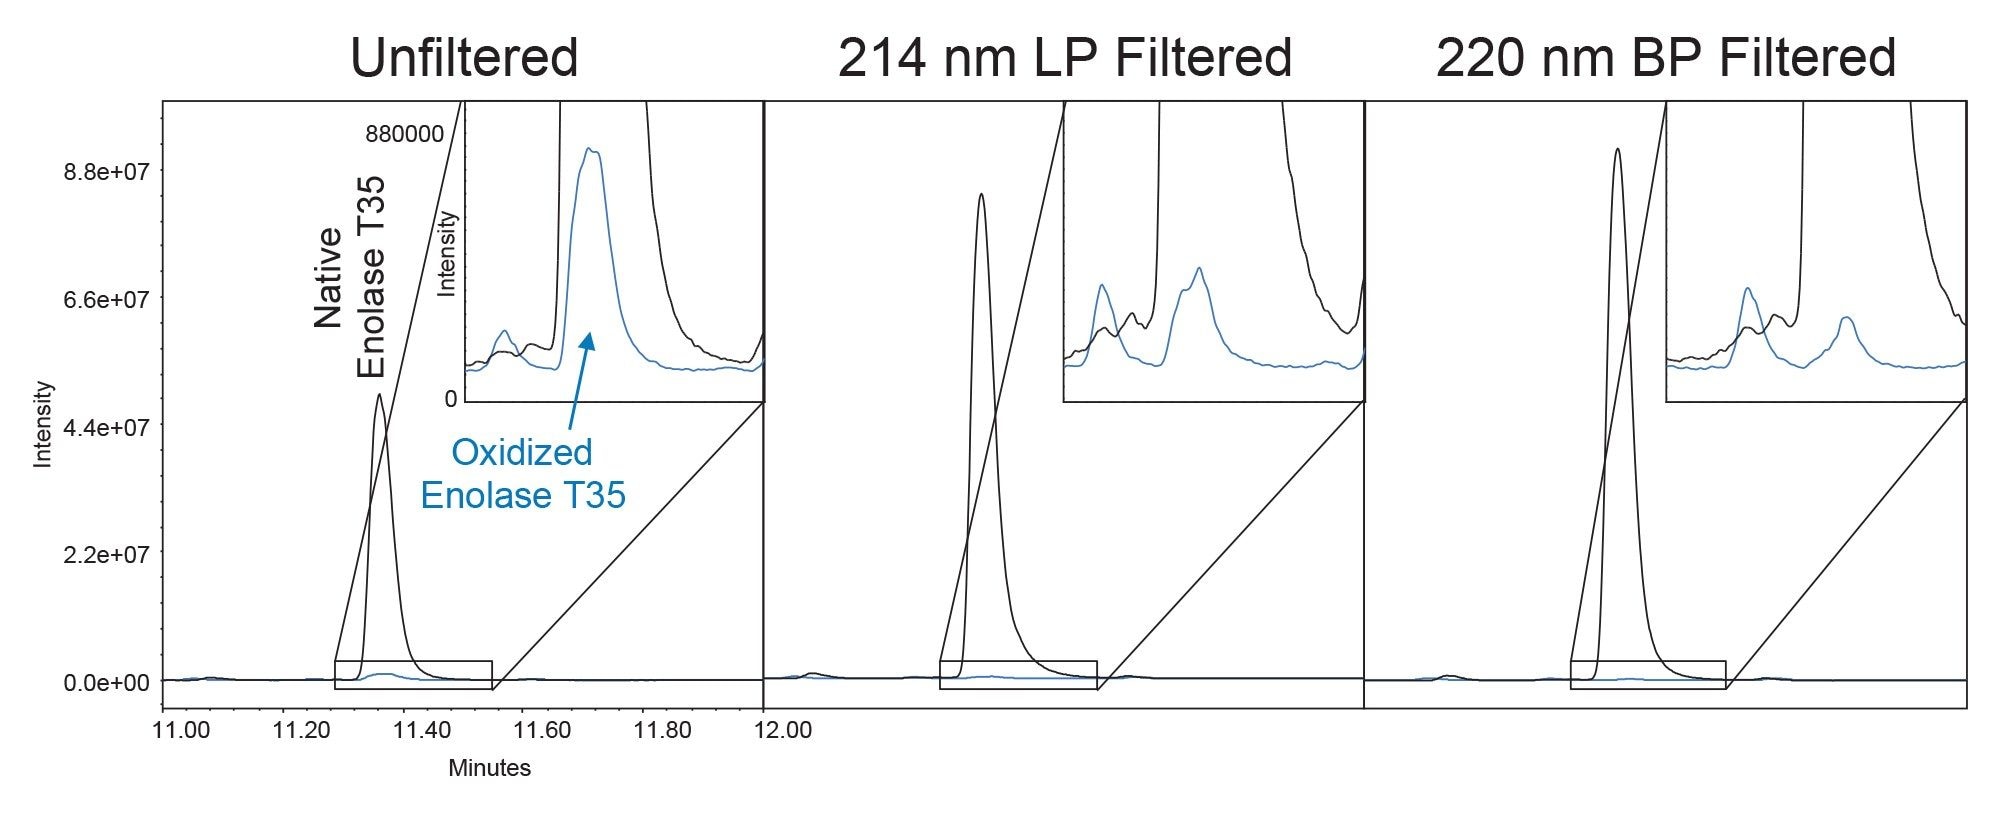
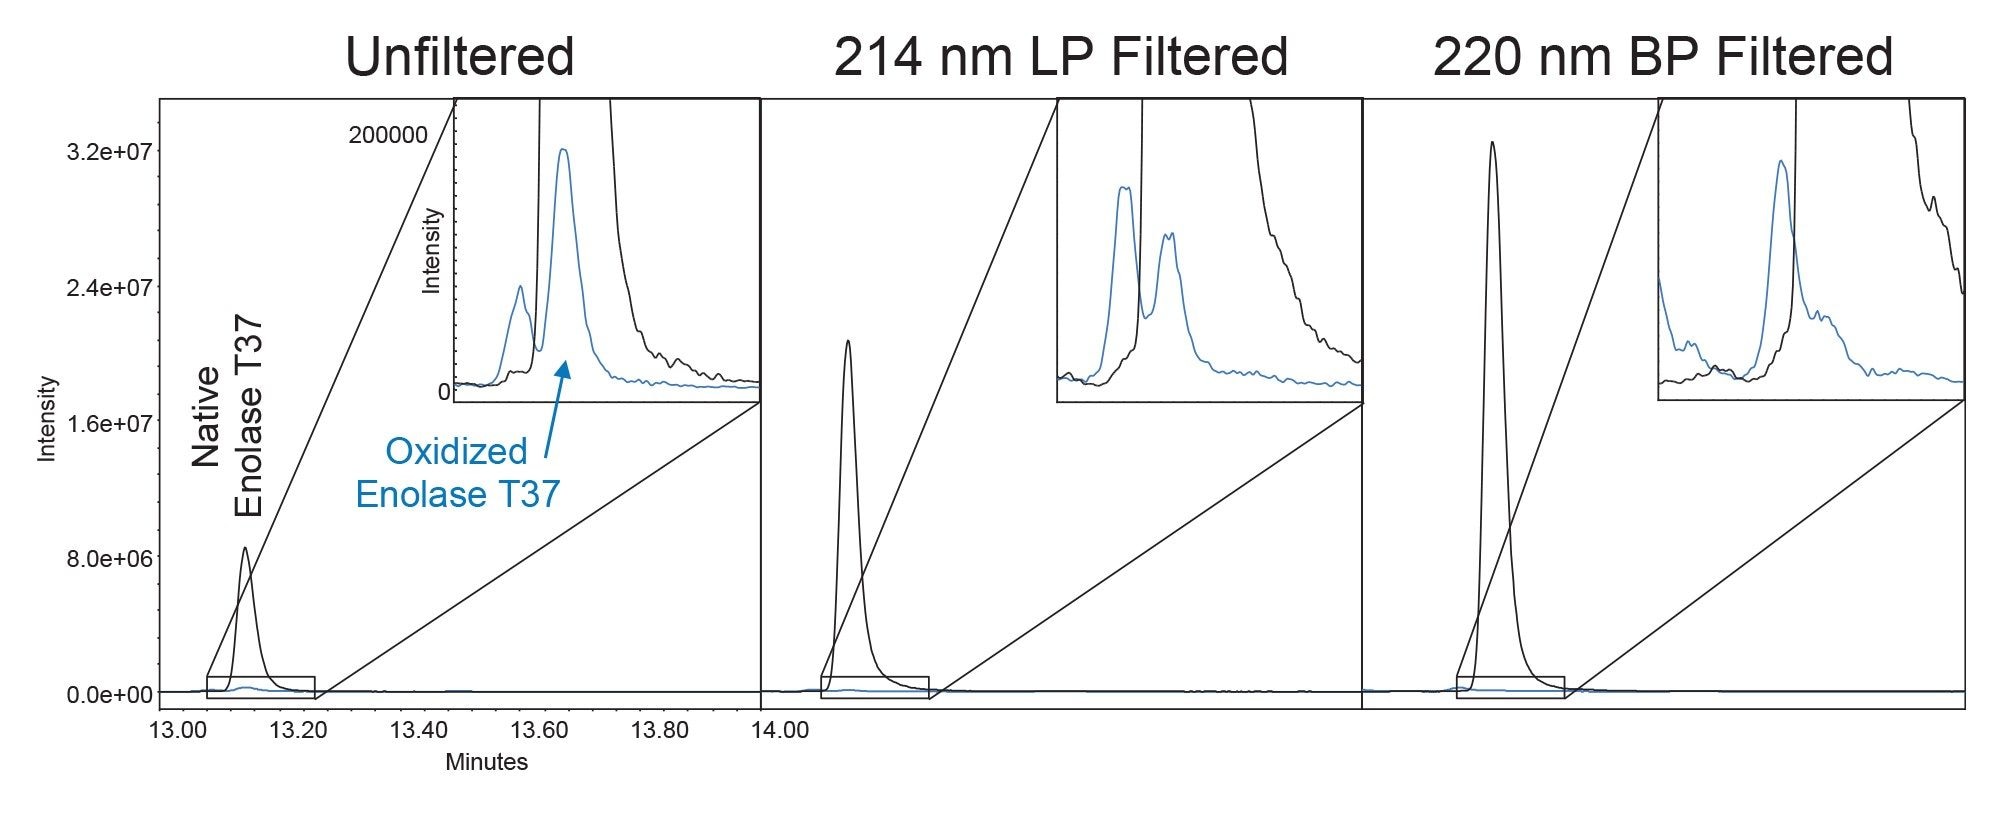
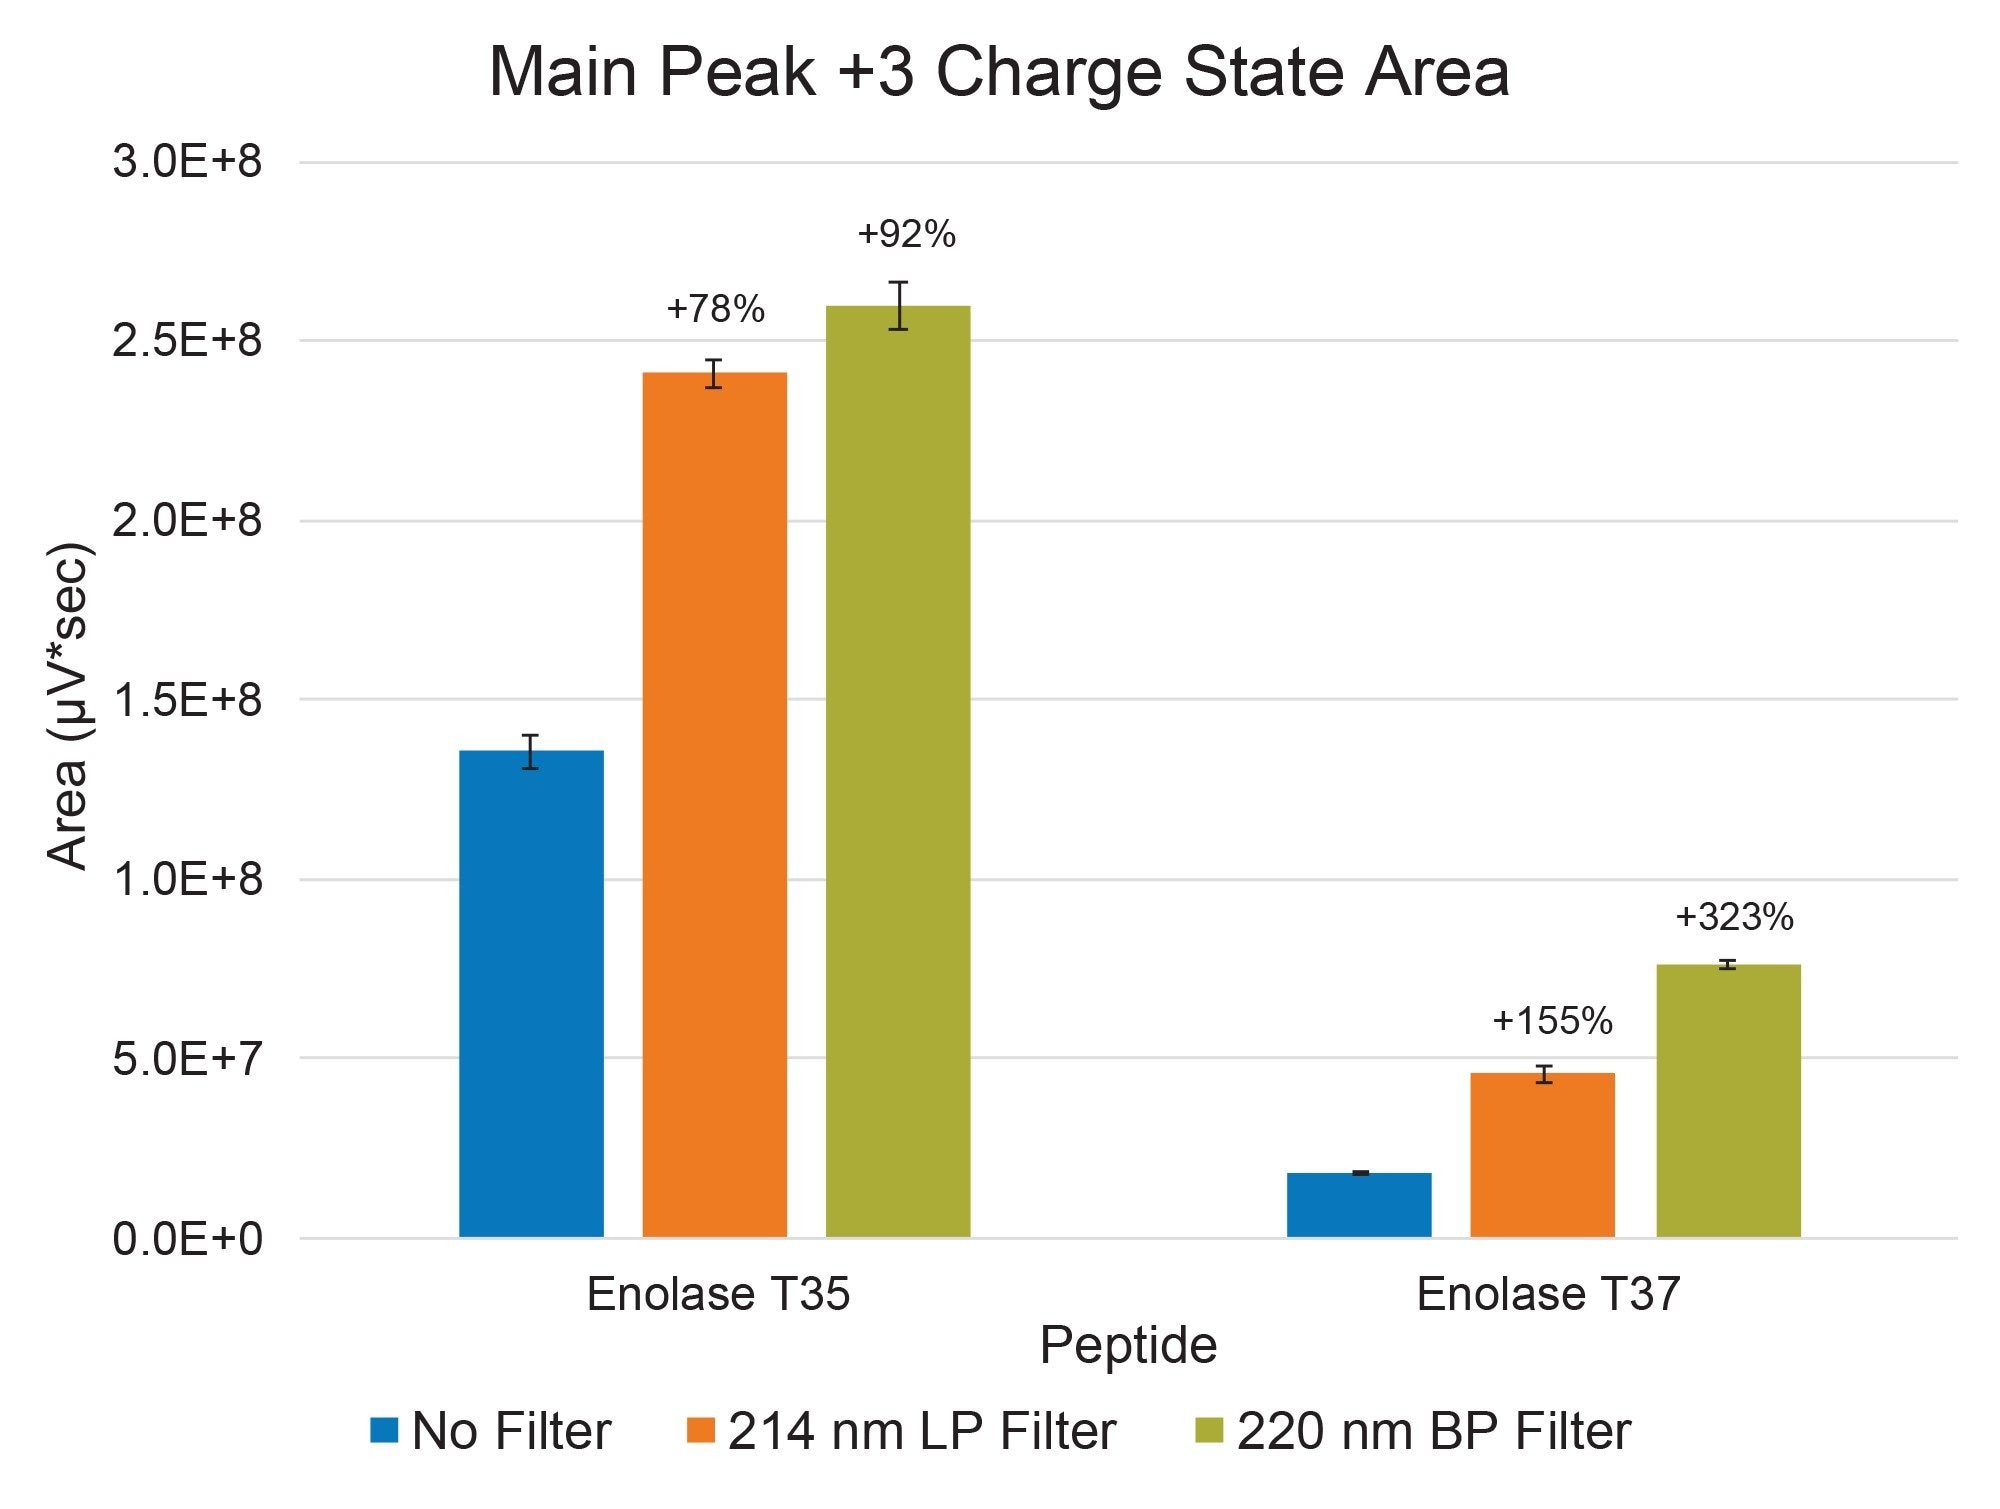
Figure 3 summarizes the average total area counts for the native SIR peaks of enolase T35 and enolase T37 under the three filtering conditions. Relative to the unfiltered control, the 214 nm LP filter increased the abundance of the intact T35 and T37 peptides by 78% and 155%, respectively. The 220 nm BP filter produced even greater enhancements, yielding increases of 92% for T35 and 323% for T37. The dramatic response observed for T37 reflects the extent to which its unfiltered signal was suppressed; even modest attenuation of deep‑UV light resulted in substantial recovery of the non‑oxidized form.
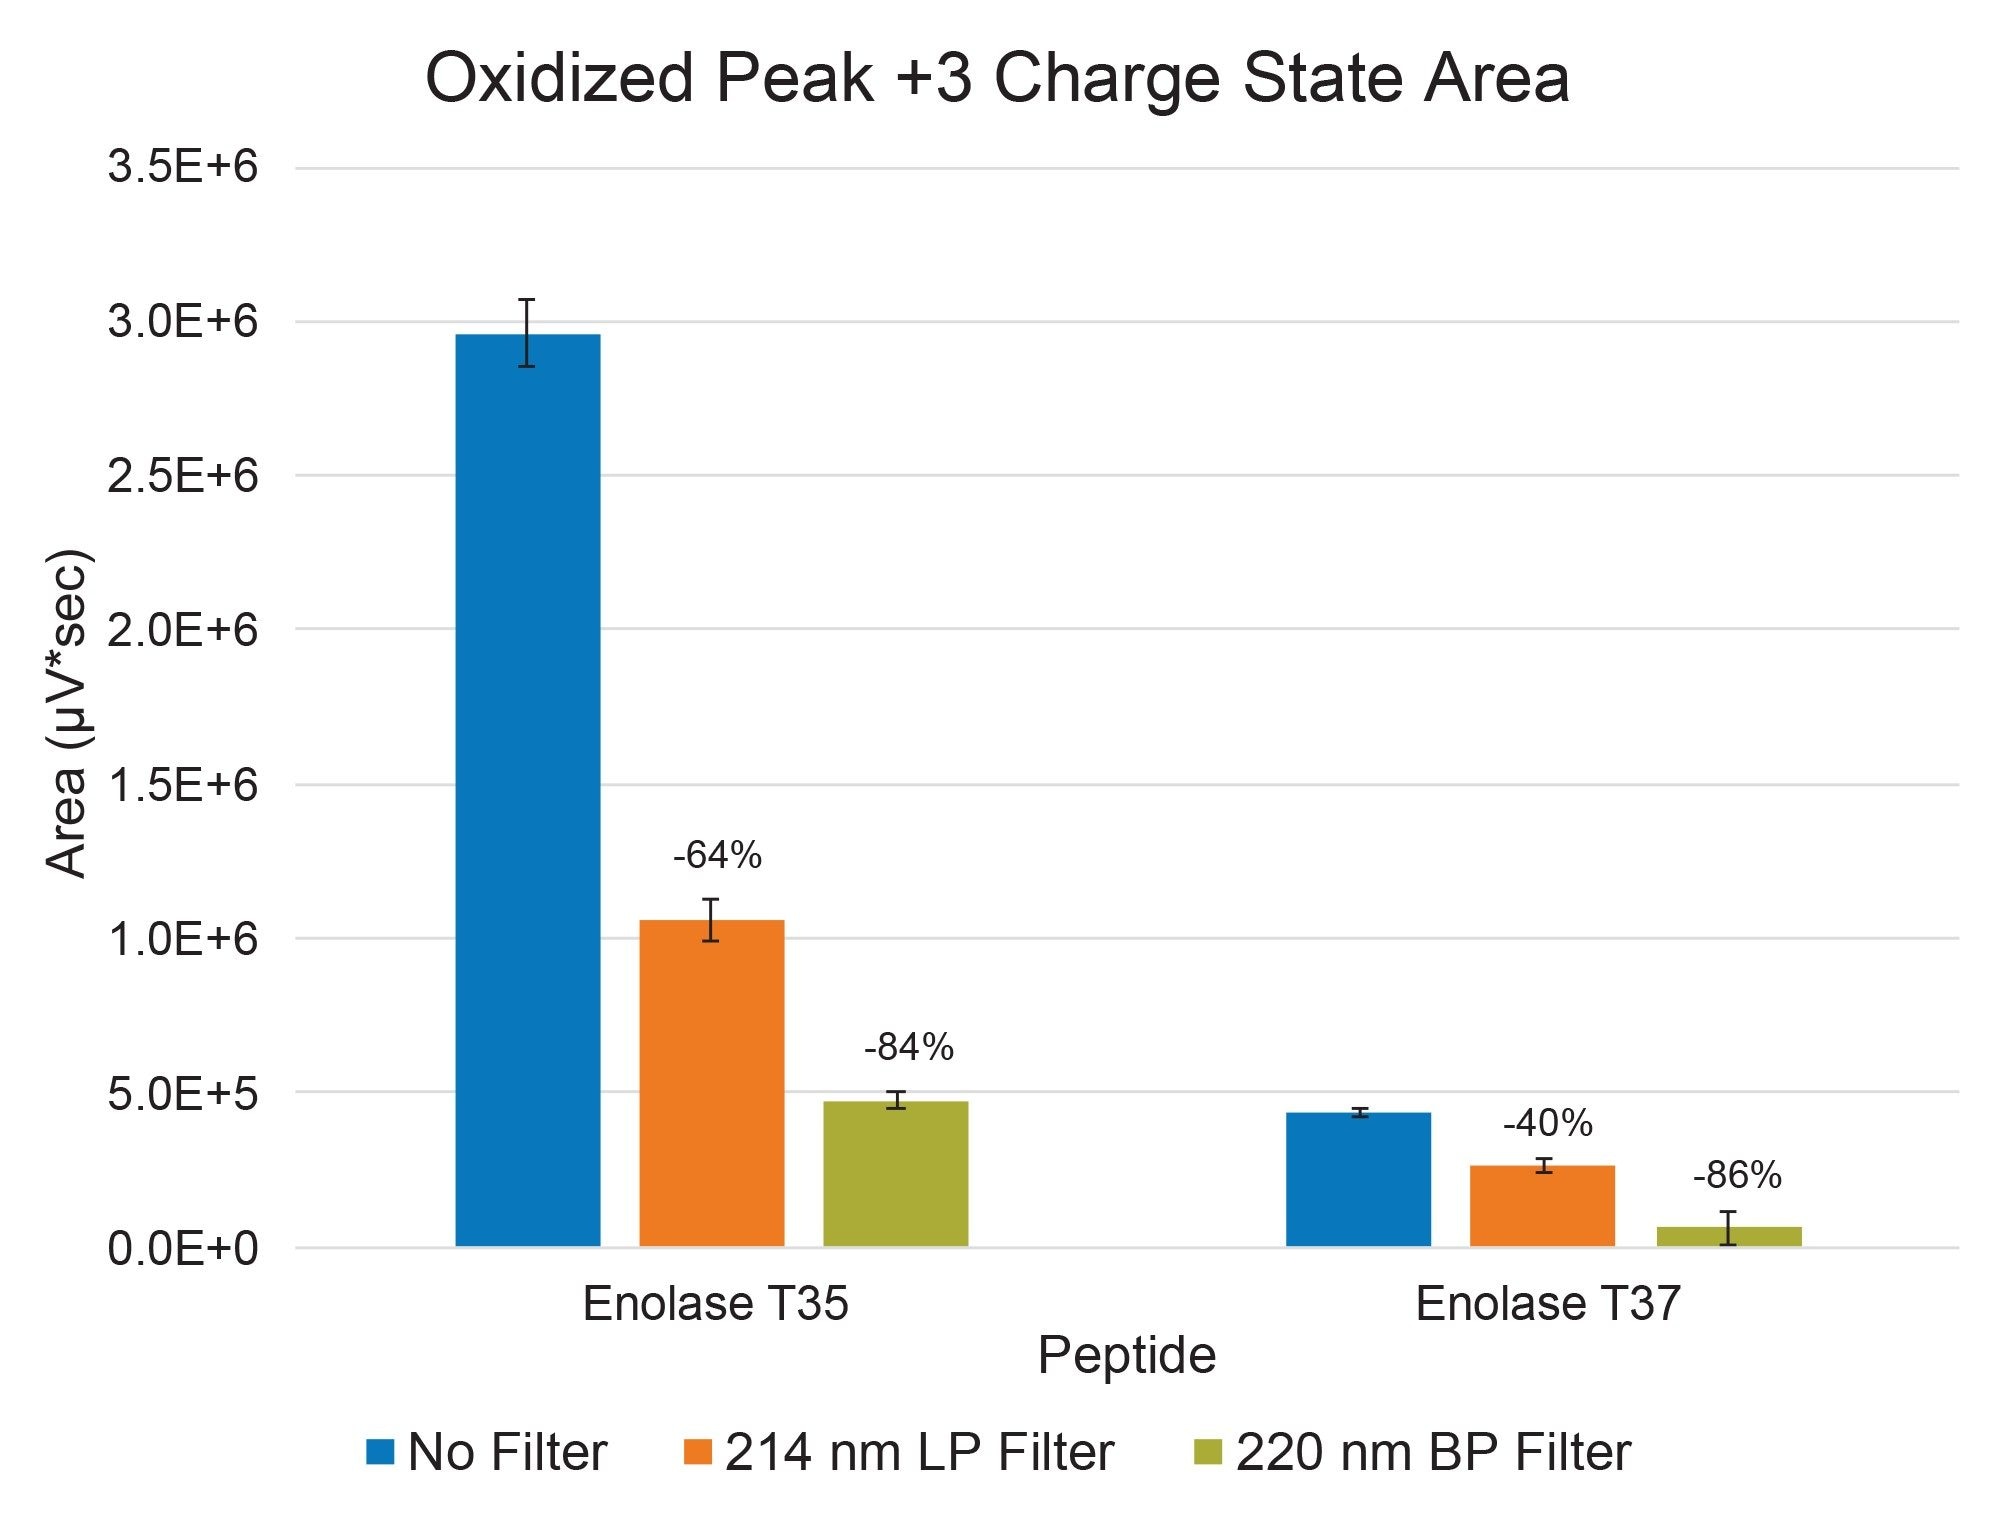
Figure 4 presents the corresponding oxidized SIR traces for the same +3 charge states. As anticipated, improvements in the abundance of the unmodified peptides were accompanied by proportional decreases in their oxidized counterparts. The 214 nm LP filter reduced the oxidized forms of T35 and T37 by 64% and 40%, respectively, whereas the 220 nm BP filter achieved more pronounced reductions of 84% and 86%. Collectively, these data demonstrate that limiting exposure to high‑energy UV light within the PDA flow cell significantly suppresses photooxidation of these peptides, confirming optical filtration as an effective strategy for protecting photosensitive analytes during analysis.
Conclusion
This study demonstrates that integrating optical filtration into the Alliance iS Bio PDA System is an effective strategy for reducing photooxidation of UV sensitive analytes during chromatographic analysis. Because the PDA Detector exposes analytes to the full spectral capacity of the detector and therefore an increased amount of photon energy the analytes are susceptible to light induced structural modification within the flow cell. Impurities introduced post-manufacturing must be kept to a minimum to evaluate the true amount of bioprocess induced impurity. Installing optical filters that attenuate the deep UV region substantially mitigates this effect. In this work, a 214 nm LP filter and a 220 nm BP filter were individually positioned between the light source and the flow cell of the Alliance iS Bio PDA System. Using the QDa II Mass Detector for in-line mass confirmation enabled direct monitoring of two peptides - enolase T35 and enolase T37 - along with their corresponding photooxidized forms. The BP filter demonstrated a larger impact on reducing photodegradation than the LP filter as more light is filtered and therefore lower energy is imparted to the sample.
A key advantage of the Alliance iS Bio PDA System is its ability to rapidly switch between unfiltered and filtered configurations through a dedicated filter slot, allowing users to tailor the optical environment to the needs of their analytes. Three band pass filters are offered and focus on the major biomolecule response wavelengths of 220 nm, 254 nm, and 280 nm. The system’s seamless compatibility with secondary detectors such as the ACQUITY QDa II Mass Detector further enhances method development efficiency by enabling real time mass confirmation of both native and degradant species. This capability was essential for quantifying the protective effects of each filter and for characterizing the extent of photooxidation under different optical conditions.
Overall, these results highlight optical filtration as a simple, practical, and highly effective means of minimizing light induced degradation during PDA assisted chromatographic analysis. For laboratories working with photosensitive peptides or other UV-labile analytes, the ability to incorporate optical filters into the Alliance iS Bio PDA System offers a powerful approach to improving data quality, enhancing method robustness, and ensuring more accurate characterization of molecular species.
References
- Méndez, E.; Escribano, J.; Gonzalez, G. Direct Characterization of Proteins and Peptides in HPLC by Photodiode Array UV-VIS Detection: A New Approach in the Detection and Characterization of Polypeptides. In Methods in Protein Sequence Analysis: Proceedings of the 7th International Conference, Berlin, July 3–8, 1988; Wittmann-Liebold, B., Ed.; Springer Berlin Heidelberg: Berlin, Heidelberg, 1989; pp 293–300. https://doi.org/10.1007/978-3-642-73834-0_39.
- Kawabata, K.; Uchikata, T.; Matsumoto, K.; Nishi, H. UV Cut-Off Filter of a Photodiode Array Detector Improves the Quantitativity of L-Ascorbic Acid Through Its Photoprotection. Chromatography 2020, 41 (3), 141–145. https://doi.org/10.15583/jpchrom.2020.013.
- Boya, L. J. The Thermal Radiation Formula of Planck (1900). ArXiv Prepr. Physics0402064 2004.
- Davies, M. J. Protein Oxidation and Peroxidation. Biochem. J. 2016, 473 (7), 805–825. https://doi.org/10.1042/BJ20151227.
- MassPREP Peptide Mixture Care and Use Manual, 2025. https://help.waters.com/content/dam/waters/en/support/usermanuals/2014/715001703/715001703vA.pdf (accessed 2026-01-23).
720009279, April 2026