
Quantification of Inorganic Counterions Using Hydrophilic Liquid Chromatography Coupled with Charged Aerosol Detection (CAD)
Margaret Maziarz, Stephanie Harden, Paul Rainville
Waters Corporation, United States
Published on July 16, 2026

Abstract
Analysis of counterions during pharmaceutical development is critical to ensure proper salt formation, drug solubility, stability and bioavailability. In this application note, a hydrophilic liquid chromatography (HILIC) method coupled with a charged aerosol detector was developed for the analysis of inorganic pharmaceutical counterions in drug substances. Chromatographic separation of both anionic and cationic counterions including chloride (Cl-), nitrate (NO3-), sodium (Na+), phosphate (PO43-), potassium (K+), calcium (Ca2+), and magnesium (Mg2+) was achieved using an Atlantis™ Premier BEH™ Z-HILIC Column. The impact of CAD parameters, including evaporator temperature, ion trap voltage and power function value on the chromatographic separation, method performance, and linearity was systematically evaluated. A linear response was obtained for all counterions using a linear fit with 1/x weighting, with correlation coefficients ≥ 0.998. The inter-day method performance was assessed through replicate injections (n = 10) of a standard mixture across multiple days, yielding relative standard deviations (RSD) of peak areas ≤ 1.15%. Recovery of counterions from the drug substances ranged from 99 to 103%, with excellent repeatability of RSD ≤ 0.80% (n = 6).
Benefits
- Simultaneous analysis of anionic and cationic pharmaceutical counterions using an Atlantis Premier BEH Z-HILIC Column on an Arc™ HPLC System with charged aerosol detection.
- Accurate quantification of counterions in drug substances with recoveries between 99–103%, enabling reliable quality testing in pharmaceutical development and manufacturing.
- Seamless integration of CAD with Empower™ Software, enabling compliance-ready workflows for efficient data processing, reporting, and management.
Introduction
Pharmaceutical drug substances are often developed in salt forms to enhance key attributes such as solubility, physicochemical stability, dissolution rate, impurity profiles and polymorphic behavior.1,2 Accurate identification and quantification of counterions are essential for establishing stoichiometry, demonstrating drug substance purity and mass balance. The determination of counterion content plays a vital role across drug discovery, development, and manufacturing, as well as release testing of drug substances.
Counterions lack chromophores, making alternate detection techniques to UV necessary for their analysis. Several approaches have been employed for counterion determination, including potentiometric titration, liquid chromatography with evaporative light scattering detector (ESLD), capillary electrophoresis (CE), and ion chromatography (IC). 2,3 While IC with conductivity detection is a common technique, it typically requires separate columns and mobile phase conditions for the analysis of cations and anions, which can increase method complexity and analysis time. ELSD provides an LC-based approach for the analysis of counterions lacking chromophores, but its limited linearity and variable response can restrict quantification accuracy and reproducibility.
CAD has emerged as a valuable analytical tool for the detection of a wide range of non-volatile and semi-compounds, including those lacking UV chromophores. Waters CAD is designed for seamless integration with Waters LC systems and Empower Software, delivering a compliance-ready solution for regulated workflows. Robust CDS communications help minimize downtime, while acquisition, processing, and reporting can be managed within a single system to support streamlined workflows, consistent data review, and traceable records. This application note presents a HILIC-CAD method on the Arc HPLC System using an Atlantis Premier BEH Z-HILIC Column for the quantitative analysis of pharmaceutical counterions in drug substances.
Experimental
LC/MS grade acetonitrile, formic acid, and ammonium formate were purchased from Sigma-Aldrich (Milwaukee, USA). High purity grade magnesium chloride, potassium phosphate monobasic, calcium nitrate tetrahydrate, potassium chloride, sodium bromide and sodium sulfate were obtained from Sigma-Aldrich (Milwaukee, USA). The drug substances including losartan potassium, metformin hydrochloride (HCl), memantine HCl, and ranitidine HCl were obtained from Sigma-Aldrich (Milwaukee, USA). De-ionized water (>18.2 MΩ) was purified using a Milli-Q™ Purification System.
Standard Solutions
Individual stock solutions of inorganic salts including magnesium chloride, potassium phosphate monobasic, calcium nitrate tetrahydrate, sodium sulfate, sodium bromide, and potassium chloride were prepared at 2 mg/mL in water/acetonitrile (50:50, v/v) diluent. The stock solutions were diluted to contain 100 µg/mL of each salt. For analysis of counterions, standard mixture solutions containing seven counterions (nitrate, potassium, sodium, chloride, phosphate, magnesium, and calcium) were prepared in the range of 10 to 160 µg/mL.
Drug Substance Samples
Losartan potassium, memantine HCl, metformin HCl, and ranitidine HCl drug substances were dissolved in water/acetonitrile (50:50, v/v) diluent and diluted to the working concentration of 0.2 mg/mL.
Method Conditions
|
LC system: |
Arc HPLC System with column heater/cooler and active pre-heater |
|
Detection: |
Waters Charged Aerosol Detector |
|
Vials: |
LCMS Maximum Recovery 2 mL volume (Waters, p/n: 600000670CV) |
|
Column: |
Atlantis Premier BEH Z-HILIC Column, 5 µm, 4.6 mm x 150 mm (Waters, p/n: 186010008) |
|
Column temperature: |
45 °C |
|
Sample temperature: |
20 °C |
|
Injection volume: |
10 µL |
|
Flow rate: |
1.3 mL/min |
|
Mobile phase: |
A: Acetonitrile B: Water C: Ammonium formate, 200 mM D: Formic acid in water, 2% (v/v) |
|
Wash solvents: |
Purge/Sample Wash: 50:50 water/acetonitrile Seal Wash: 90:10 water/acetonitrile |
Gradient Table
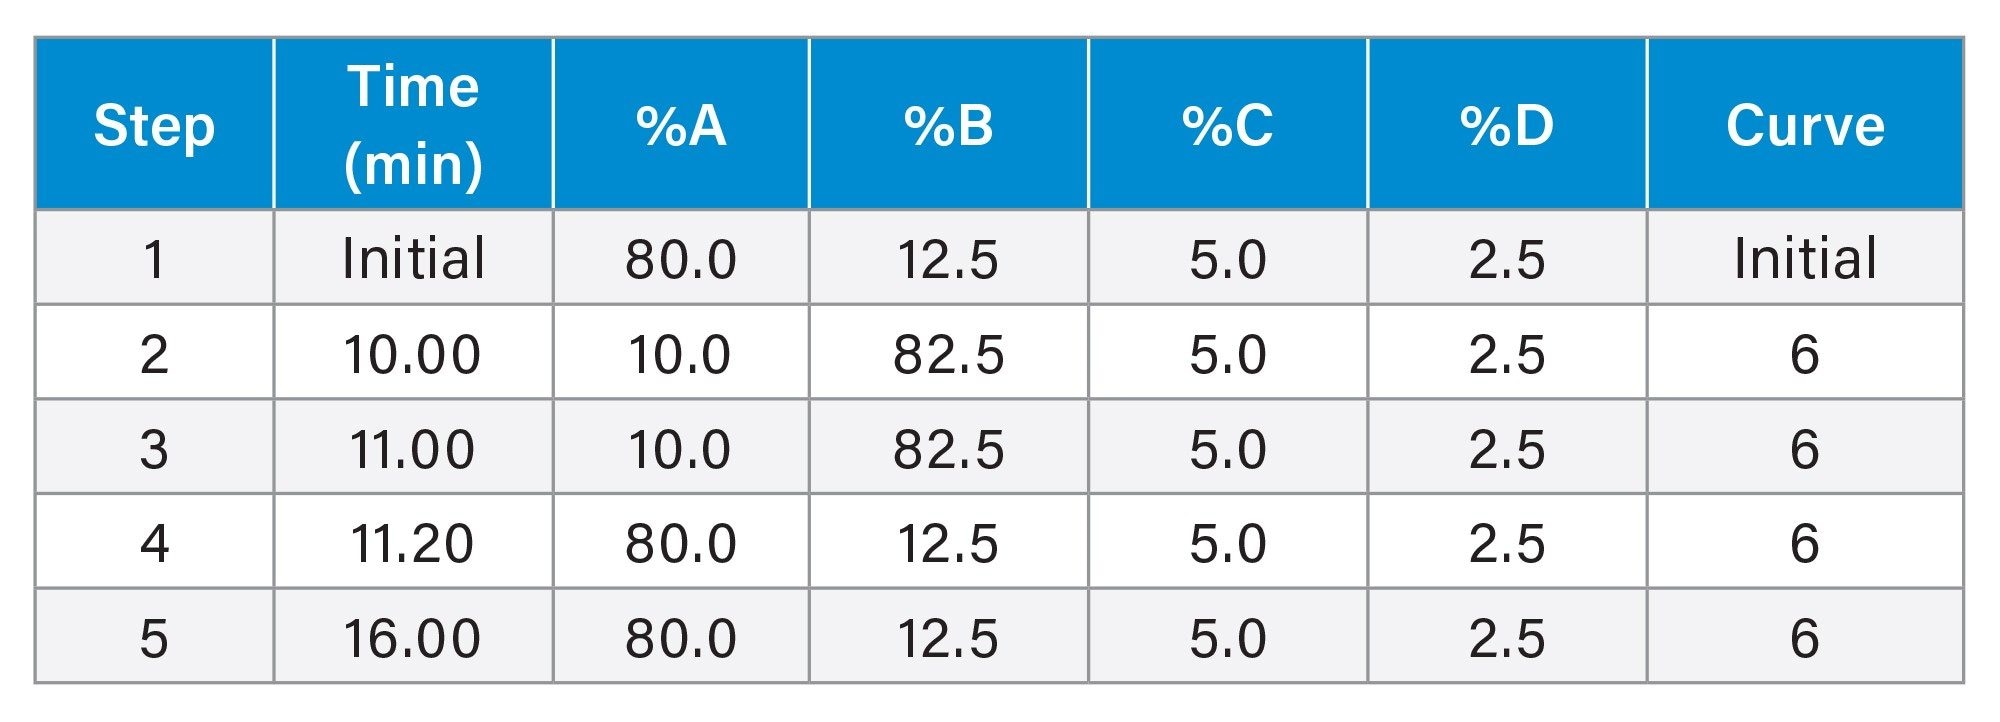
CAD Settings
|
Power function value (PFV): |
1.30 |
|
Sampling rate: |
10 pts/sec |
|
Filter time constant: |
1.00 second |
|
Evaporator temperature: |
45 °C |
|
Ion trap voltage: |
40 Volts |
Data Analysis: Empower Software version 3.6.0 was used for data acquisition, processing, and reporting.
Results and Discussion
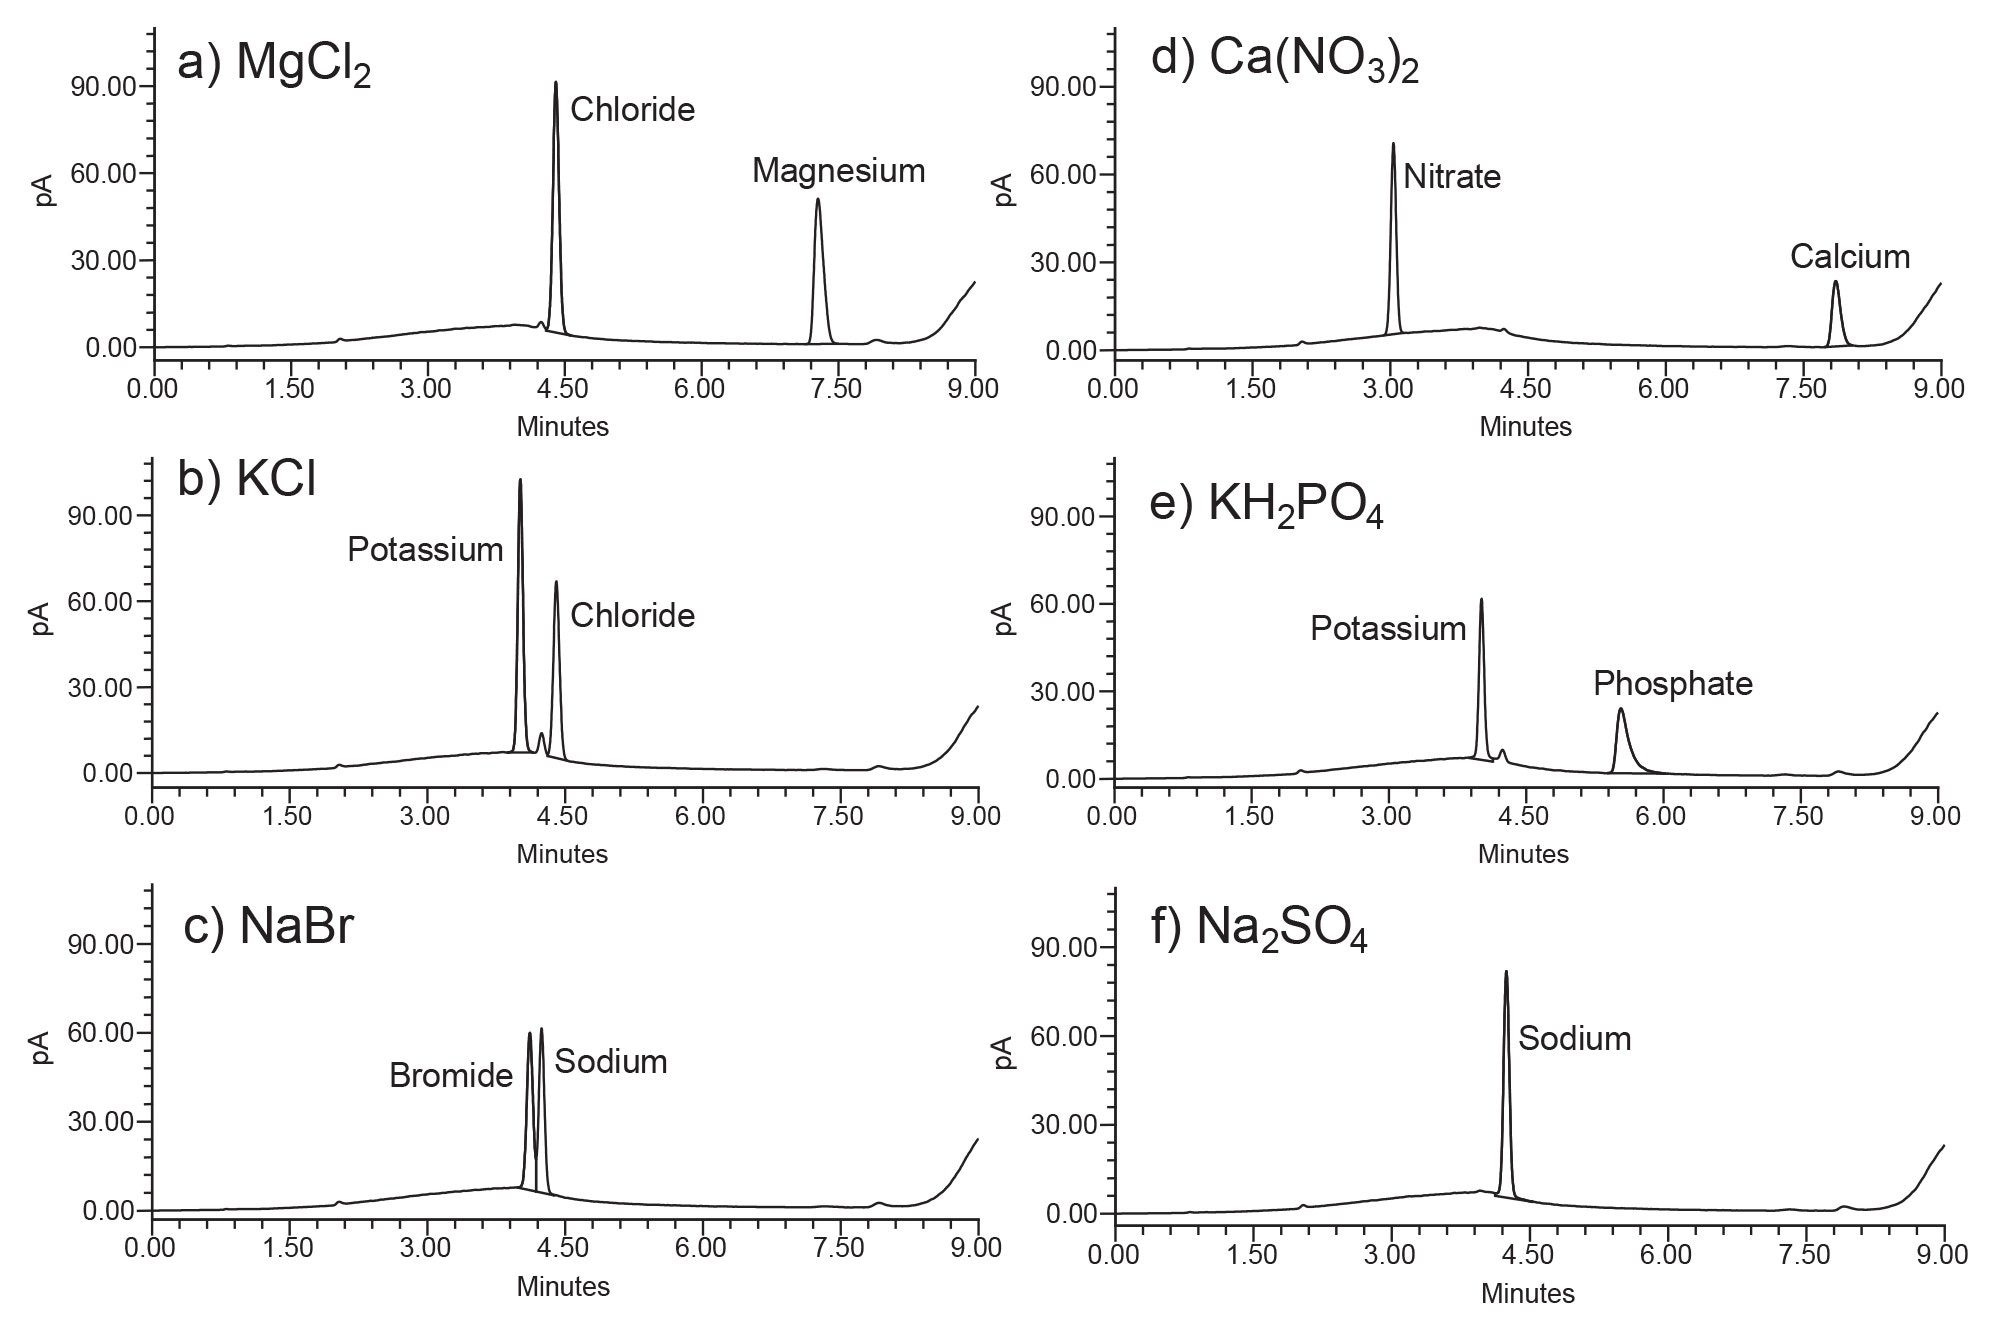
Solutions containing individual inorganic salts, including magnesium chloride, potassium chloride, sodium bromide, calcium nitrate, potassium phosphate, and sodium sulfate were injected onto an Atlantis Premier BEH Z-HILIC Column (Figure 1). The HILIC separation mode, employing a polar stationary phase with aqueous-organic mobile phases, enabled effective separation of both positive and negative counterions. Peak identification was performed based on retention times.
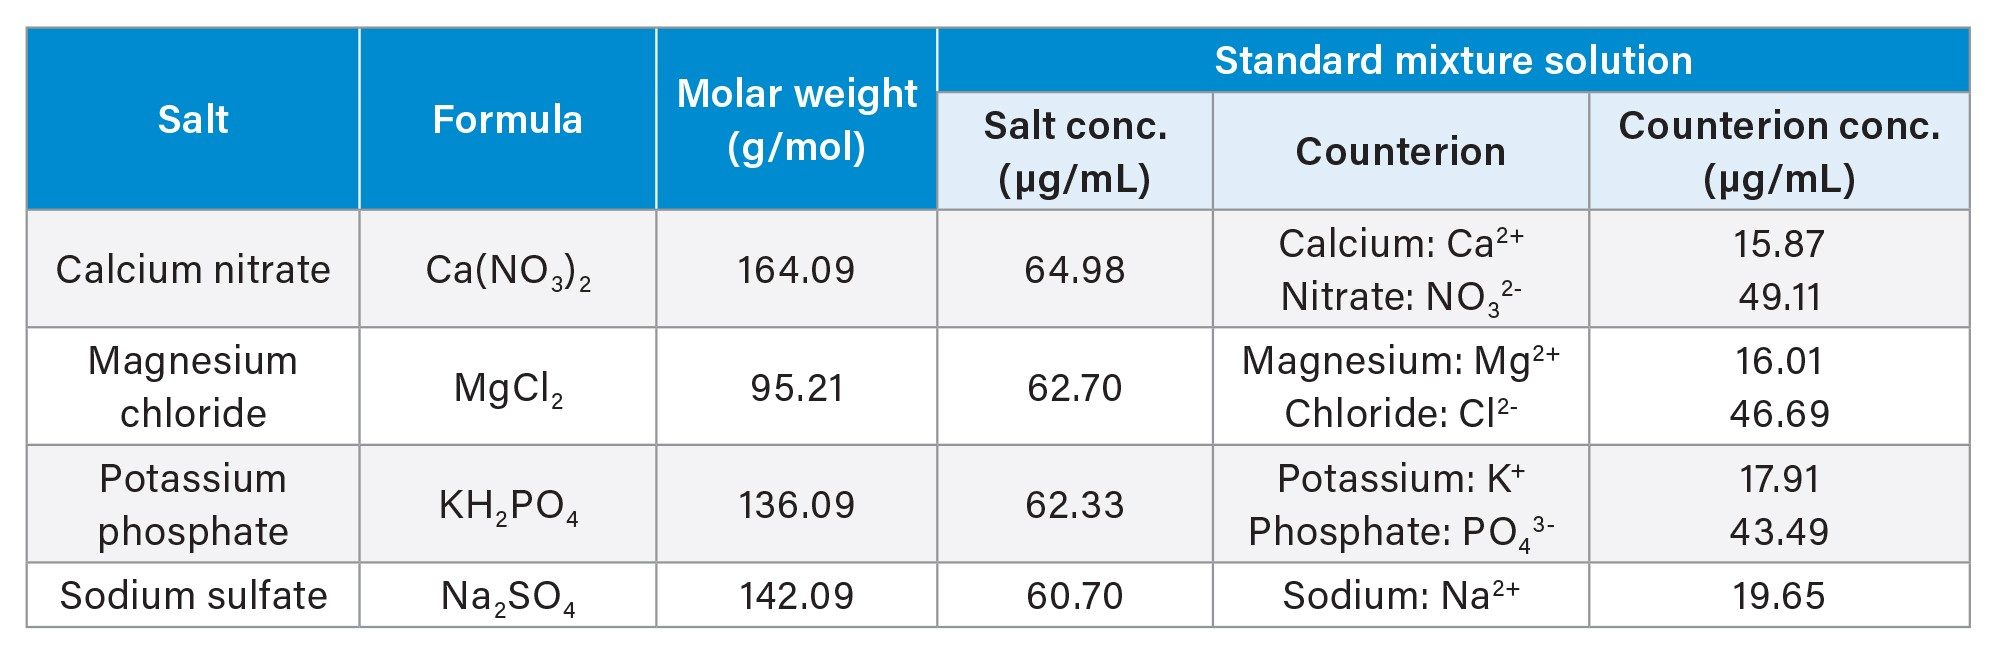
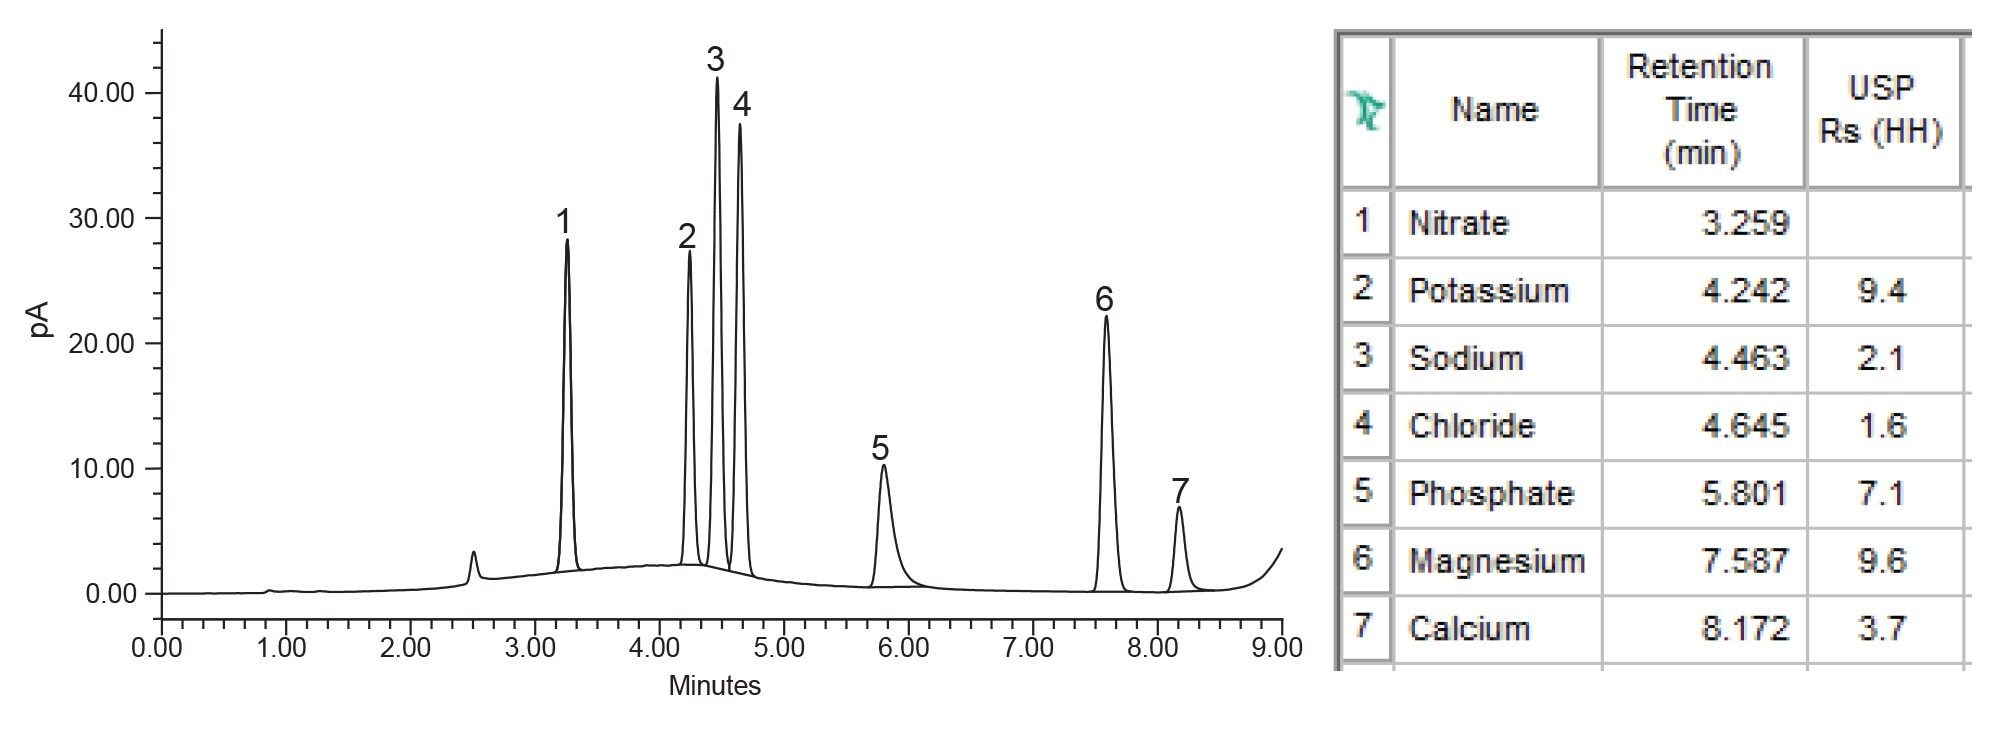
A standard mixture solution prepared from four salts (calcium nitrate, magnesium chloride, potassium phosphate, and sodium sulfate) was used to evaluate the impact of CAD parameters on chromatographic performance and linearity. This salt mixture was comprised of seven counterions: nitrate, potassium, sodium, chloride, phosphate, magnesium, and calcium. The concentration of each counterion was calculated based on its molar ratio in the respective salt and the corresponding molecular weight. An example of these calculations for a standard mixture containing approximately 60 µg/mL of each salt is shown in Table 1. Chromatographic analysis of the standard mixture demonstrated baseline separation of all counterions (Figure 2).
Chromatographic performance and linearity of the method were optimized by evaluating CAD parameters, including evaporator temperature, ion trap voltage, and power function value. These parameters were systematically assessed through experimental studies by varying settings in the Empower Software instrument method.
CAD Evaporator Temperature
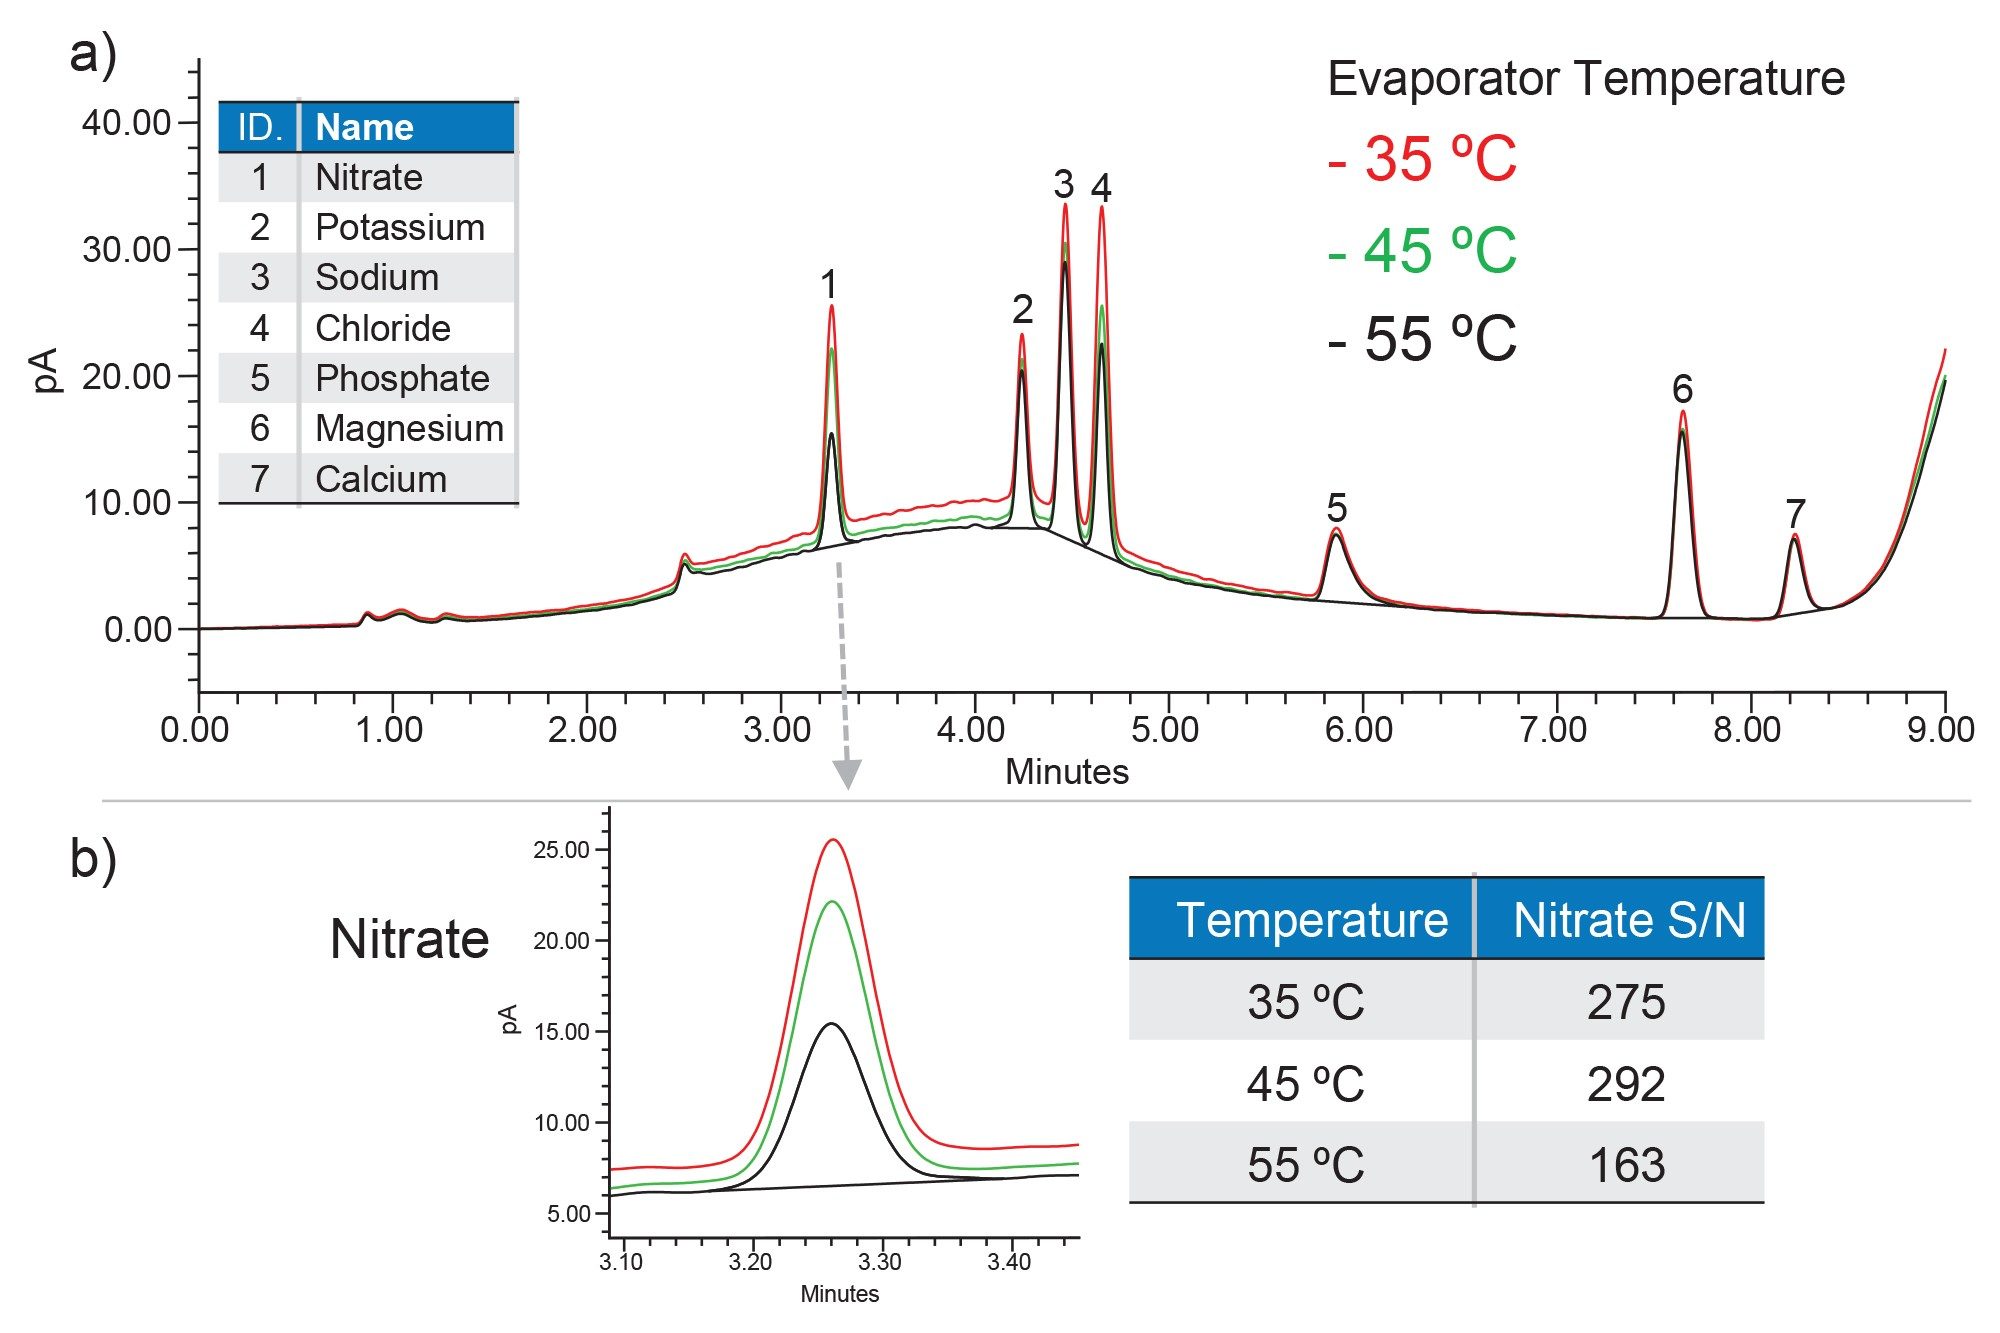
The impact of evaporator temperature on chromatographic performance and counterion signal intensity was evaluated over the range of 25–80 °C. An example of evaporator temperature optimization is shown in Figure 3. While increasing the evaporator temperature reduced the baseline noise, a decline in the signal-to-noise (S/N) was observed. The temperature of 45 ºC provided the highest signal and was therefore chosen for the counterion analysis.
Ion Trap Voltage
The CAD ion trap applies electrical voltage to selectively remove smaller, high mobility gas ions, ideally allowing only the charged analyte particles to reach the detector. However, increasing the ion trap voltage can lead to the removal of larger ions and charged particles, which may also include analytes of interest.
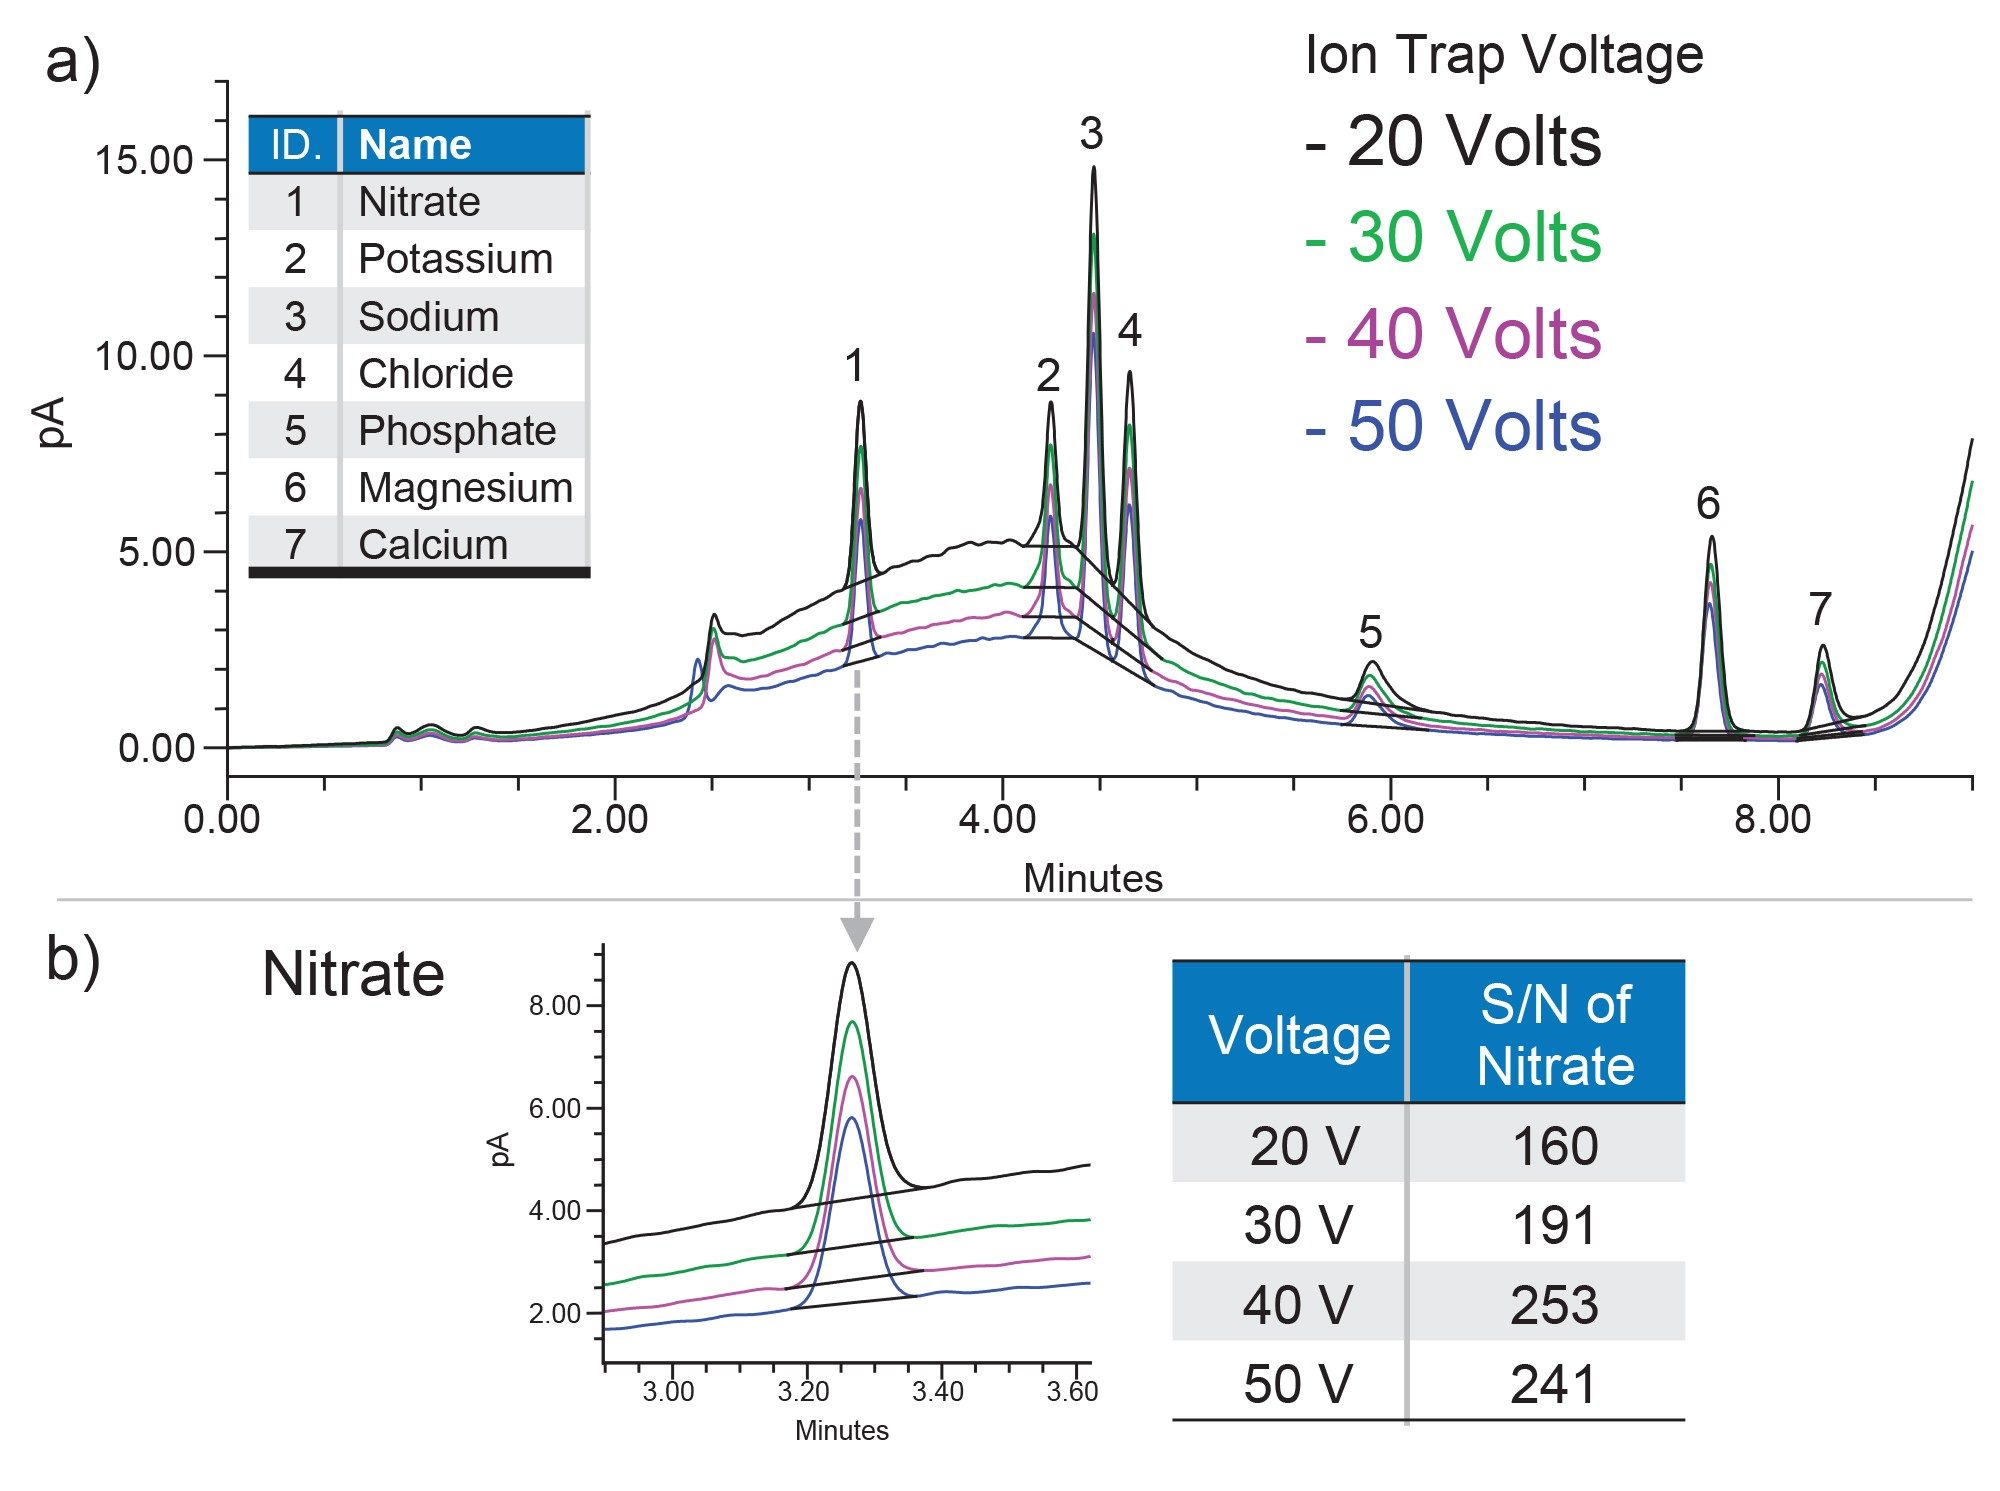
The impact of ion trap voltage on the counterion signal response was investigated over the range of 20-100 Volts. As shown in an example in Figure 4, an ion trap voltage of 40 V reduced the baseline noise while providing best signal intensity for nitrate and was therefore selected for the counterion analysis.
Power Function Value: Linearity
The CAD non-linear response can be effectively optimized using a power function value (PFV), which applies digital signal processing to improve linearity across a calibration range.
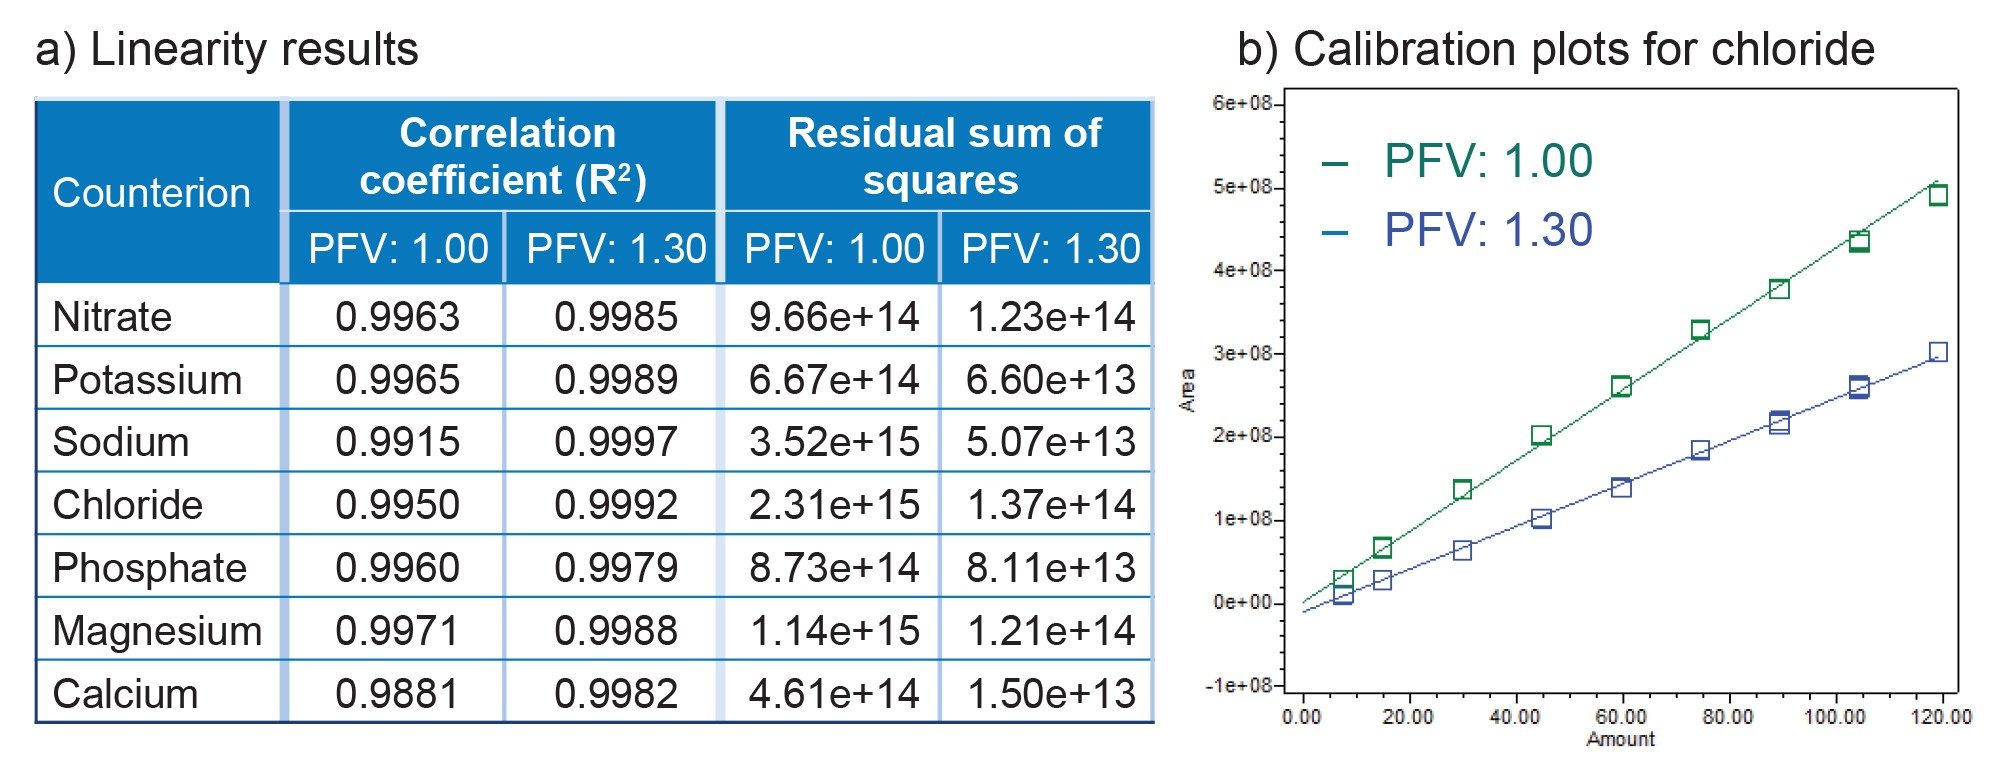
To establish the optimum PFV for achieving linear response of counterions, calibration curves were generated using standard mixtures across nine concentration points ranging from 10 to 160 µg/mL of inorganic salts, using a 1/x linear fit and no weighting. The calibration performance was assessed using correlation coefficients (R2) and residual sum of squares obtained from plots of peak areas versus counterions concentrations. Applying a PFV of 1.30 improved linearity relative to the default PFV value of 1.00, as evidenced by the higher R2 values and reduced residuals (Figure 5).
Additional parameters including the filter time constant and sampling rate were evaluated during the study (data not shown). A filter time constant of 1.00 sec. and sampling rate of 10 pts/second were selected for best chromatographic separation and signal for the counterions.
Inter-day Performance
Demonstrating inter-day performance ensures that the analytical method produces consistent and reliable results, which is critical to the quality control and safety of pharmaceutical products.
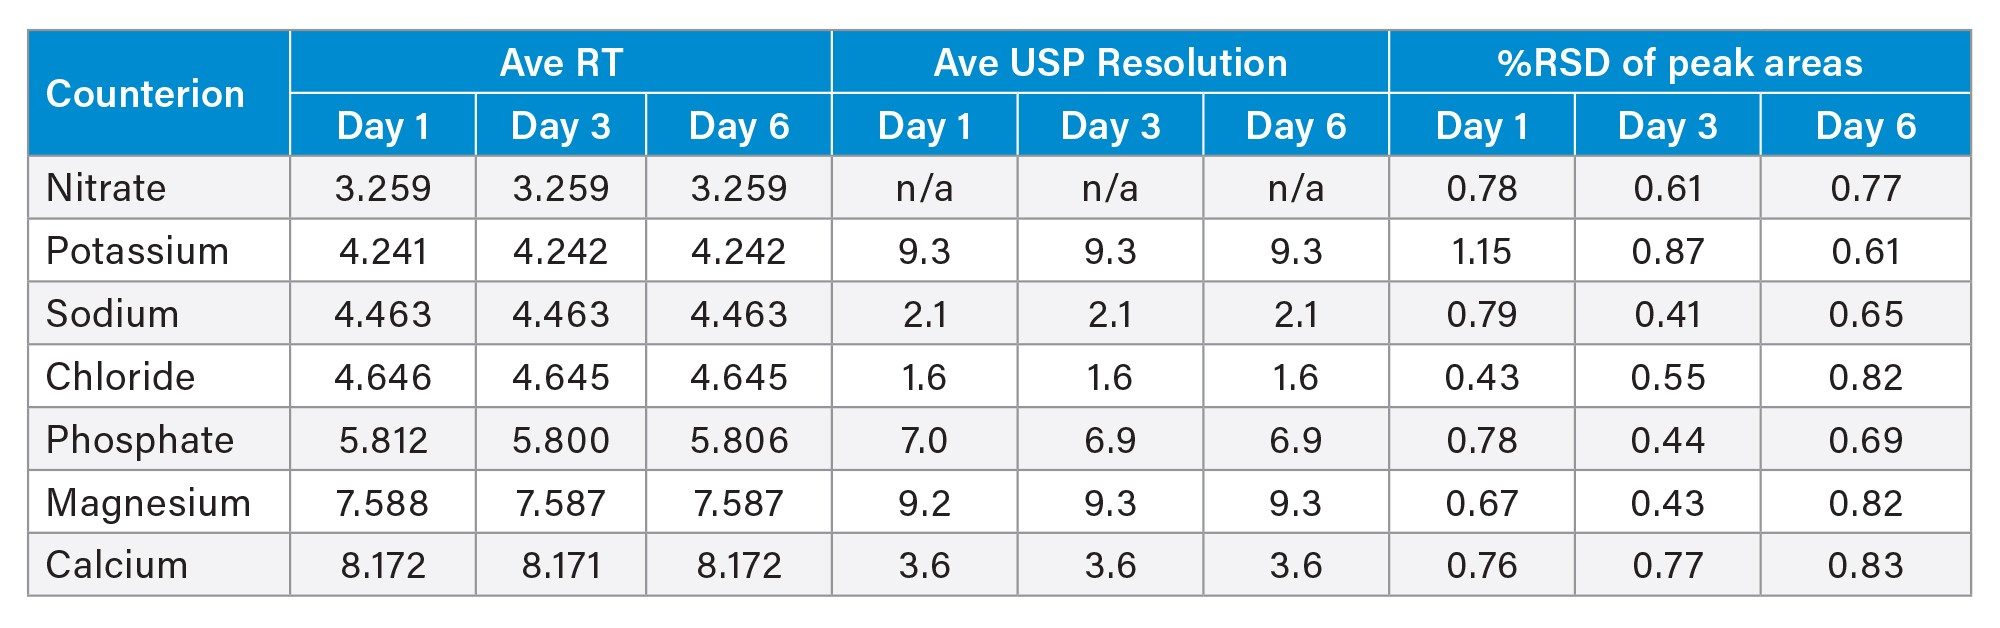
For the counterions method, inter-day performance was evaluated by performing 10 replicate injections of a standard mixture at 60 µg/mL on three different days (days 1, 3, and 6). Method performance was assessed based on average retention times, RSD of peak areas, and United States Pharmacopeia (USP) resolution values (Table 2). The results were consistent across all days evaluated, demonstrating excellent inter-day reproducibility of the method.
Counterions Analysis in Drug Substances
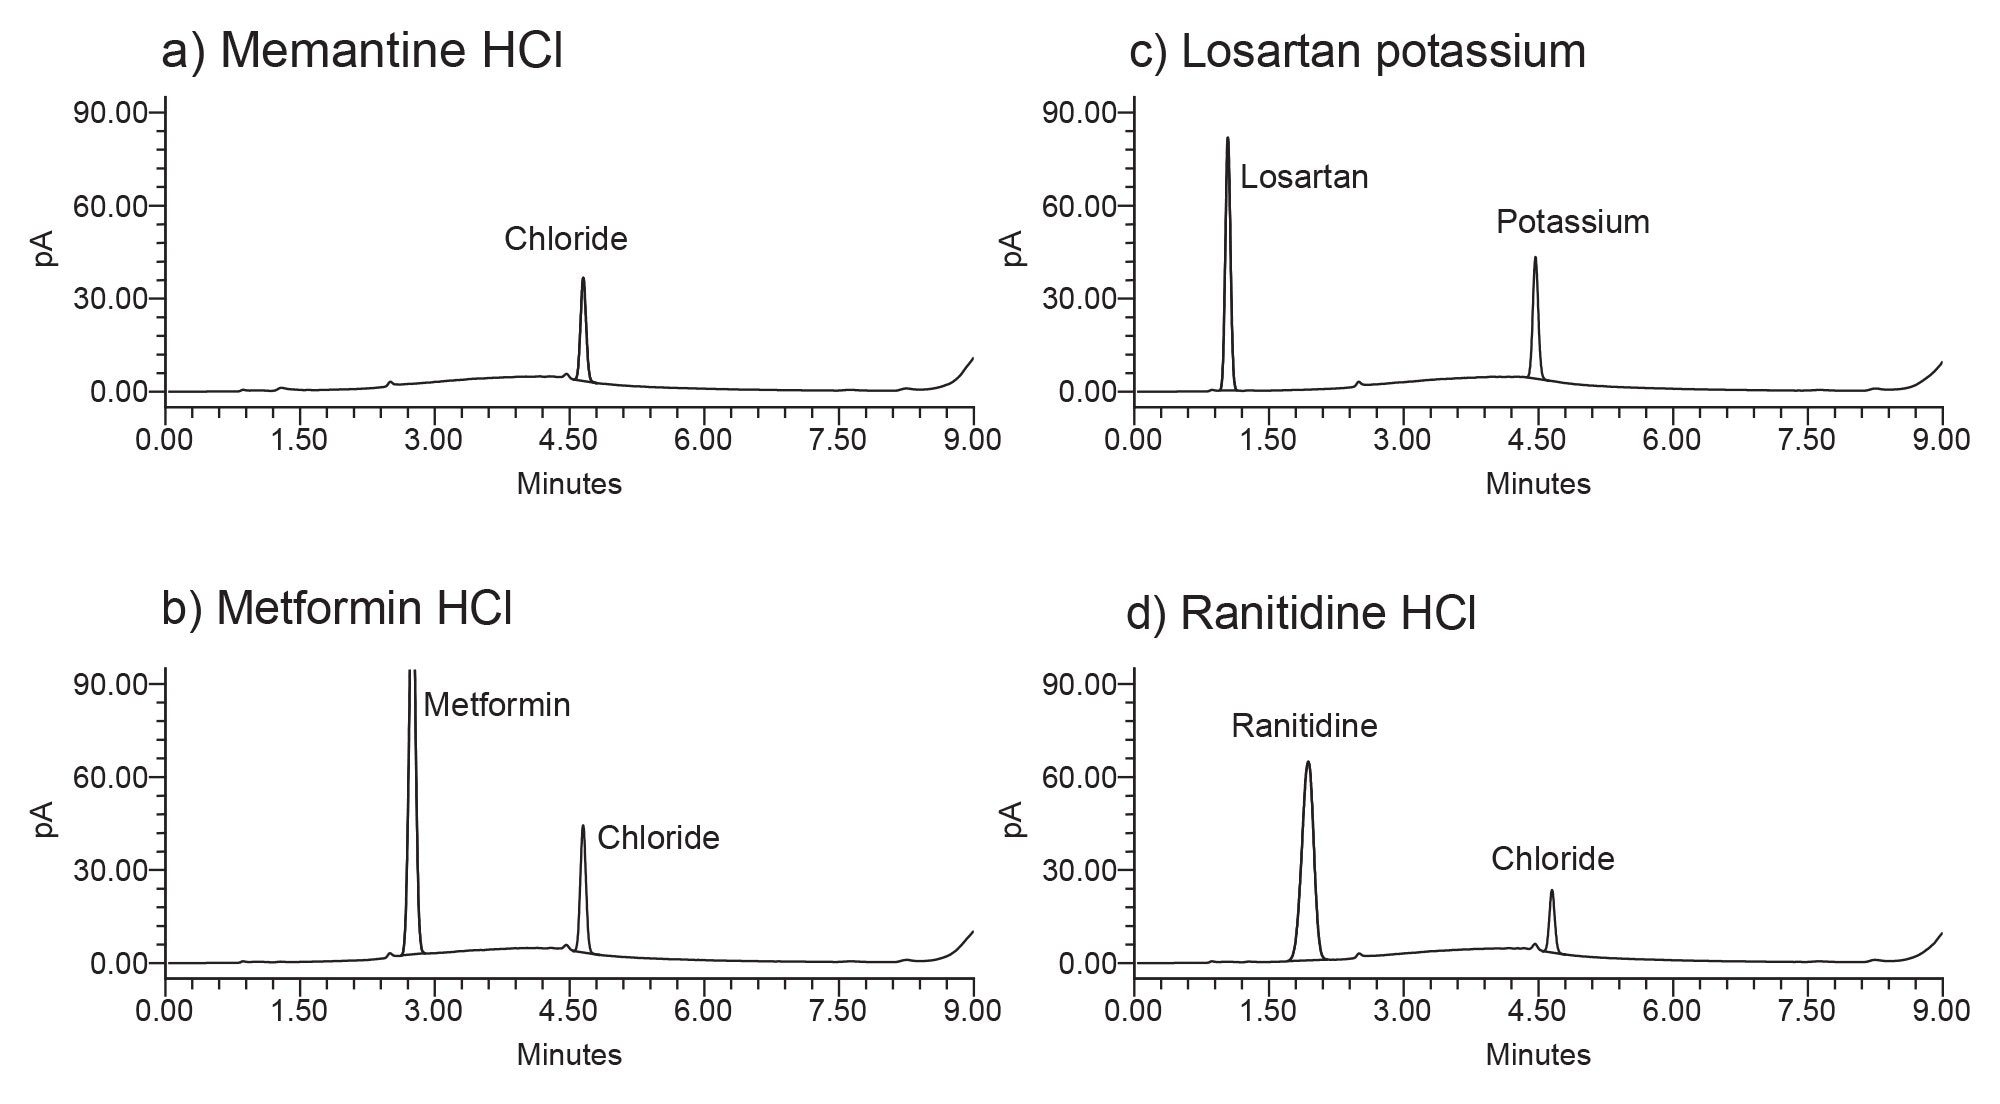
A number of drug substances were analyzed for the counterion content and quantified using calibration curves generated for the respective counterions with 1/x weighting, processed using a PFV value of 1.30. The drug substance peaks including memantine, metformin, losartan and ranitidine were well separated from the counterions peaks (Figure 6). Memantine is not detectable by CAD, due to its high volatility. Counterions recovery and composition in the drug substances were calculated (Table 3). The recovery of each counterion was determined by comparing the experimentally calculated amount against the theoretical amount. The percentage (%) recoveries for counterions in memantine HCl, metformin HCl, losartan potassium, and ranitidine HCl ranged from 99 to 103%. The % RSD of the recoveries ranged from 0.39 to 0.80%, demonstrating excellent method precision. The amount (%) of each counterion in the drug substance was determined by comparing the calculated amount of the counterion to the total amount of drug substance in its salt form (Table 3.)

Conclusion
An HPLC-CAD method was developed on the Arc HPLC System with Waters CAD under Empower Software control for the quantitative analysis of pharmaceutical counterions in drug substances. The Atlantis Premier BEH Z-HILIC Column enabled simultaneous separation of anionic and cationic counterions, as well as free base drug substances. Optimization of detector parameters, including evaporator temperature, ion trap voltage, and power function value were critical to improving method performance and linearity. The resulting method demonstrated excellent inter-day performance, reproducibility, accuracy, and precision for counterion analysis.
Waters CAD, seamlessly integrated with Waters HPLCs and Empower Software, delivers a compliant-ready and reliable solution for the quantification of pharmaceutical counterions in drug substances, supporting drug development and manufacturing processes.
References
- Mithu, M.S.H.; Economidou, S; Trivedi, V.; Bhatt, S.; Dourouis, D. Advanced Methodologies for Pharmaceutical Salt Synthesis. Crystal Growth Design, 21 (2021) 1358-1374.
- Bouchot, P.; Foulon, C.; Lecoeur, M. Determination of the stoichiometry between a drug and its counter-ion by supercritical fluid chromatography using ultra-violet and evaporative light scattering detections: Application to ondansetron hydrochloride. Talanta, 210 (2020) 121166.
- Streuli, A.; Coxon, C.R.; Steuer, C. Simultaneous Quantification of Commonly Used Counter Ions in Peptides and Active Pharmaceutical Ingredients by Mixed Mode Chromatography and Evaporative Light Scattering Detection, Journal of Pharmaceutical Sciences, 110 (2021) 2997-3003.
Atlantis, BEH, Arc, and Empower are trademarks of Waters Corporation or its affiliates. Milli-Q is a trademark of Merck KGaA.
Featured Products
720009498, July 2026


