Purification of Chicoric Acid from Echinacea Tea Using a Waters MaxPeak™ Premier OBD™ Preparative Column
Jo-Ann Jablonski, Kathy Lawrence
Waters Corporation, United States
Published on May 13, 2026
Abstract
In this study, the feasibility of using an XSelect™ HSS T3 MaxPeak Premier OBD Preparative Column is demonstrated for the isolation of chicoric acid from echinacea tea. MaxPeak Premier Preparative Columns have inert surfaces which reduce undesirable interactions between certain compounds and the stainless steel or other metals present in typical columns. For compounds which have strong acidic groups like sulfates, phosphates, or carboxylic acids, reducing the interaction between the compound and the column surfaces promotes increased peak area and greater sensitivity, as well as improved fraction triggering. MaxPeak Premier Columns packed with smaller 3.5 μm particles also increase efficiency by reducing run times, fraction volumes, and dry-down times. The principles outlined here are applicable to any preparative purification where the target compound detection and collection may be compromised by interactions with the stainless steel column components.
Benefits
- Reduce interactions between certain compounds and the stainless steel (or other metal) components in the column, promoting enhanced target compound detection and improved peak shape for precise fraction triggering, leading to improved compound isolation
- Provide full scalability from Ultra performance liquid chromatography (UPLC™) to prep for predictable target collection using Waters highly controlled OBD (Optimum Bed Density) column packing process, ensuring that preparative columns are of similar bed density to analytical columns of the same chemistry
- Save time and organic solvent and increase efficiency by employing columns with smaller 3.5 μm particles
Introduction
Although lab scale purifications in which tens to hundreds of milligrams of target compound are isolated from crude mixtures are still performed routinely, the trend toward smaller scale purification is becoming more prevalent. Laboratories are increasingly opting to isolate only a few milligrams of target compound for preliminary studies. Successful target candidates are then isolated in greater amounts to satisfy ensuing experiments. Whether the goal is to isolate a small amount of target compound for exploratory studies, or to purify greater amounts for more experiments, a column which can resolve closely eluting impurities efficiently is required.
Echinacea, or purple coneflower, is an herbaceous flowering plant in the daisy family1,2 and is one of the most important medical herbs widely used to treat the common cold and other infectious diseases.3 One of the most abundant compounds in echinacea is chicoric acid, a phenylpropanoid and caffeic acid derivative.4,5 Chicoric acid, in combination with caffeic and rosmarinic acids, has high antioxidant properties and can also protect against cancer, aging, and cardiovascular diseases.6,7 Many factors, including location, growing conditions, and sample handling influence how much chicoric acid is found in natural product extracts.
A crude echinacea extract was chosen as an example to demonstrate the benefits of inert column hardware packed with 3.5 μm stationary phase particles using OBD Technology. The crude echinacea extract was first analyzed by UPLC, then the separation was optimized to improve the chicoric acid resolution. Scaling to prep was performed and chicoric acid was isolated using two XSelect HSS T3 MaxPeak Premier OBD Columns with different particle sizes and dimensions – 3.5 μm 10 x 100 mm and 5 μm 10 x 150 mm. The chicoric acid isolated using the 3.5 μm column was of equivalent UV purity to the product isolated using the 5 μm column, with a 34% savings in run time. Smaller particle preparative isolations using columns with inert hardware are a practical option for those laboratories where reduced amounts of target are needed for drug discovery and research which must be completed on accelerated timelines.
Experimental
Sample Description
Four lemon and echinacea herbal tea bags were placed in a 500 mL glass bottle with a stir bar. Sixteen ounces of hot water were added to the bottle, which was then capped. The solution was stirred at room temperature overnight. The tea extract was filtered with a Thermo Scientific Nalgene® Rapid Flow 90 mm Filter Unit. The glass bottle was rinsed two times with ~10 mL Milli-Q® water and the rinses were added to the filtered tea extract. The total volume of tea extract was ~ 300 mL.
LC Conditions
|
LC systems: |
Waters AutoPurification System ACQUITY™ UPLC H-Class System |
|
UV detection: |
AutoPurification System: 2998 Photodiode Array Detector H-Class System: ACQUITY UPLC TUV Detector Wavelength: 254 nm and 330 nm |
|
Columns: |
ACQUITY Premier HSS T3 Column, 2.1 x 50 mm, 1.8 μm (p/n: 186009467) ACQUITY UPLC HSS T3 Column, 2.1 x 50 mm, 1.8 μm (p/n: 186003538) XSelect Premier HSS T3 OBD Prep Column, 5 μm, 10 x 150 mm (custom column) XSelect Premier HSS T3 OBD Prep Column, 3.5 μm, 10 x 100 mm (custom column) XSelect HSS T3 OBD Prep Column, 5 μm, 10 x 150 mm (p/n: 186008227) |
|
Column temperature: |
Ambient |
|
Sample temperature: |
Ambient |
|
Sample loop (prep): |
500 μL; stainless steel |
|
Injection volumes: |
Analytical 5 μL; Preparative 227 μL (10 x 100 mm column); 340 μL (10 x 150 mm column) |
|
Flow rates: |
Analytical 0.35 mL/min; Prep 5.4 mL/min |
|
Mobile phase A: |
Water with 0.1% Formic Acid |
|
Mobile phase B: |
Methanol with 0.1% Formic Acid |
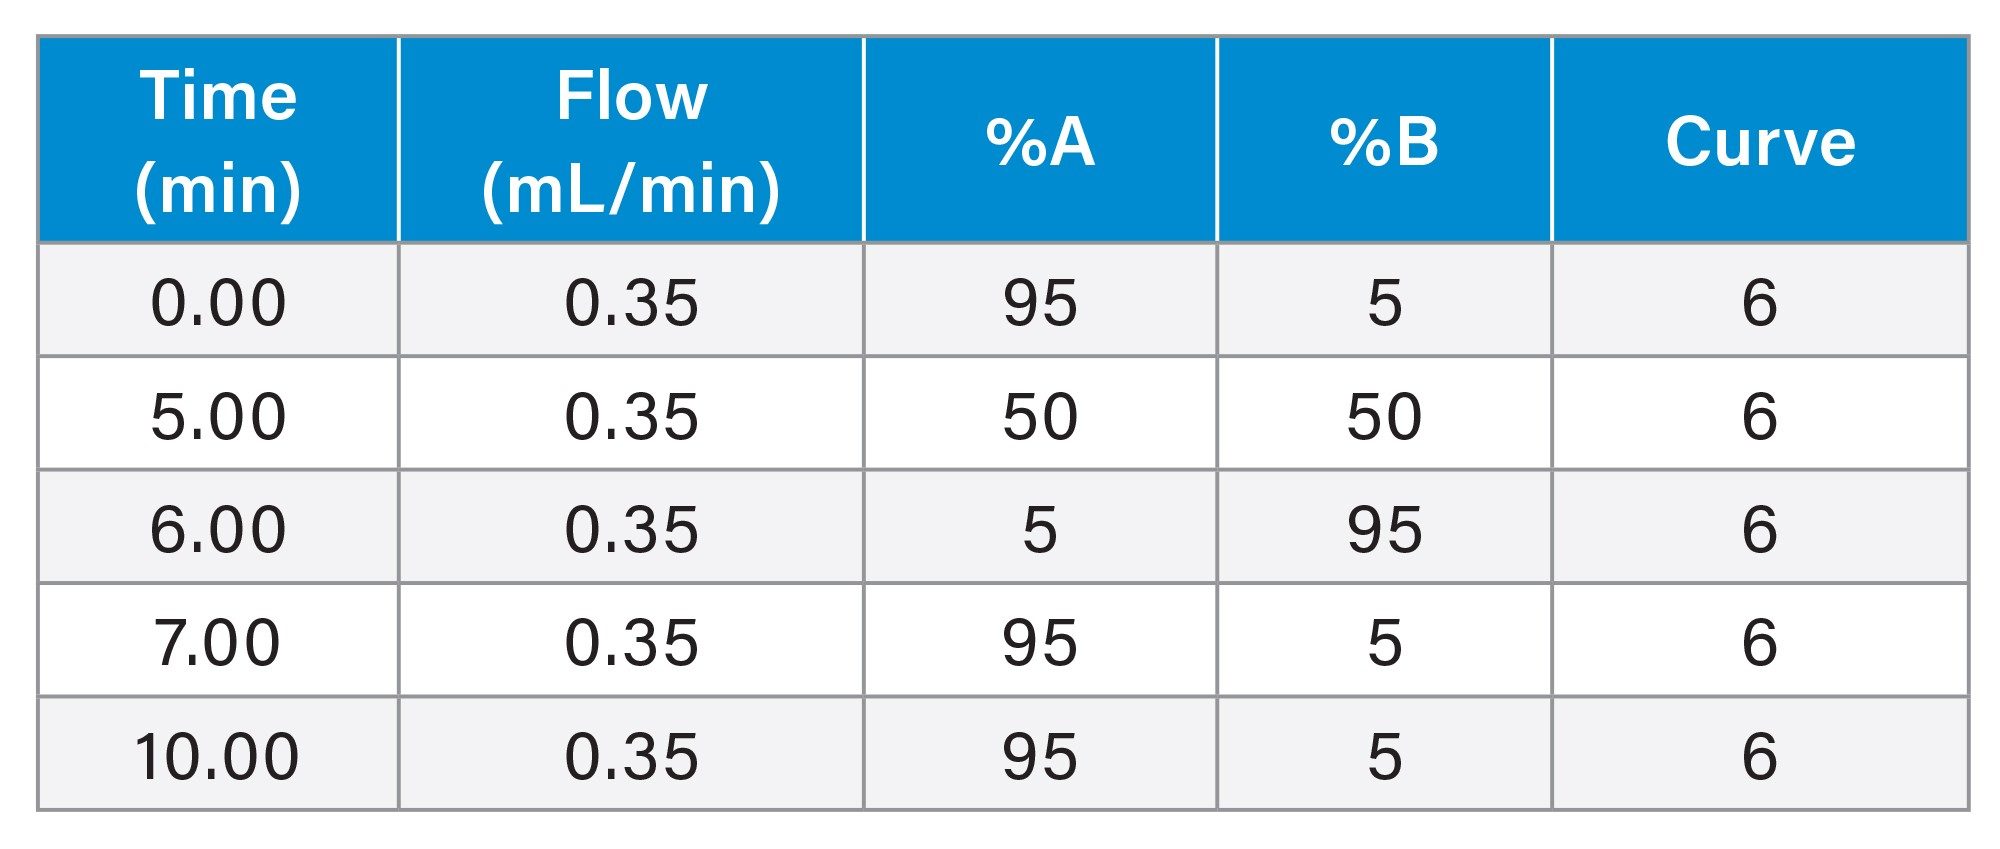
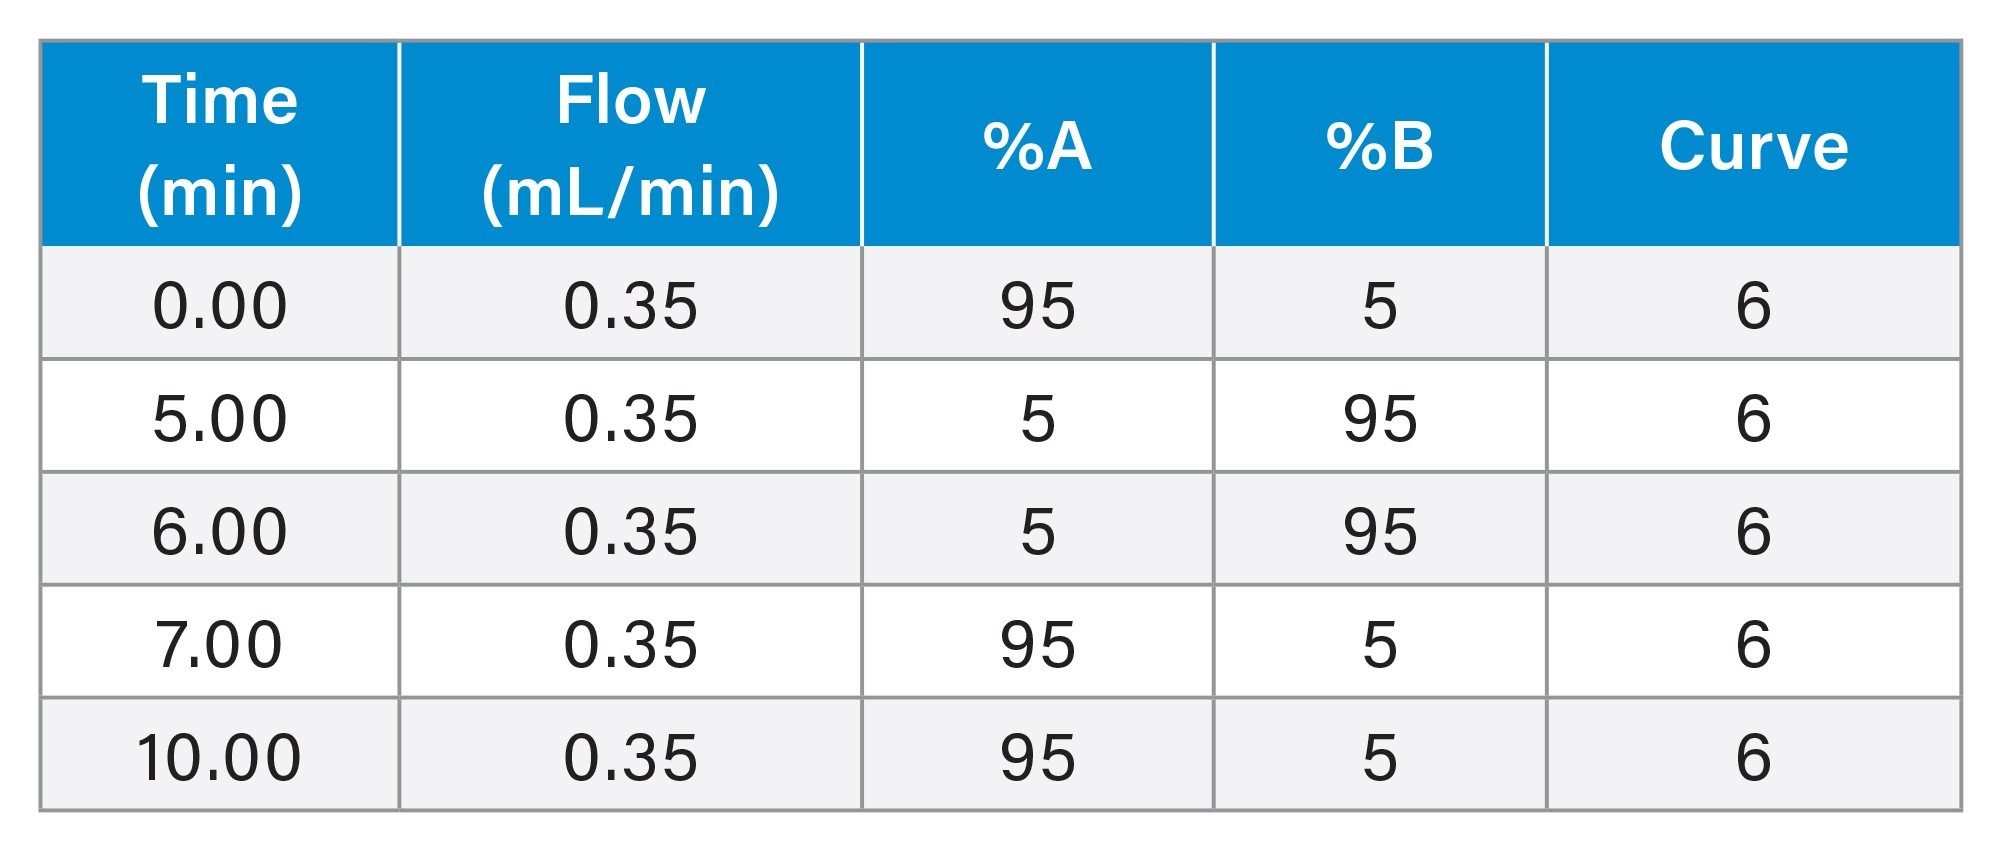
Gradient Table: Analytical Scouting Method
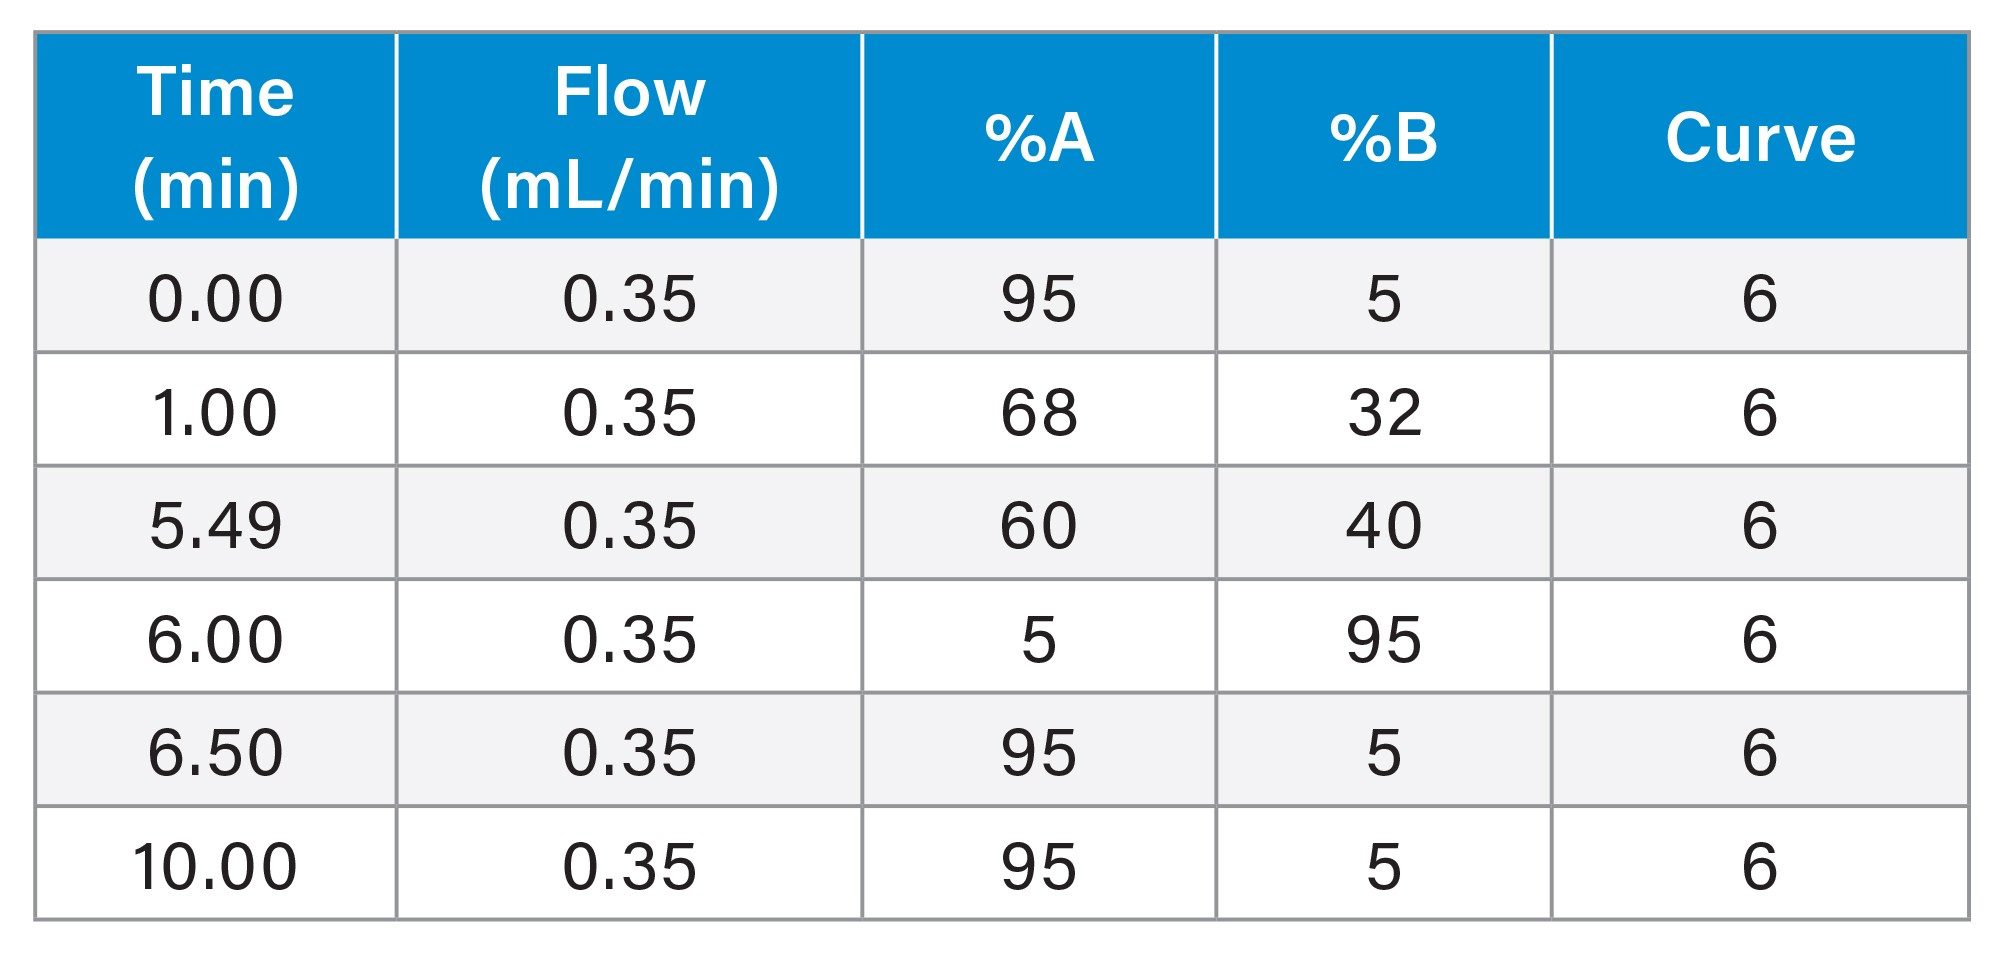
Gradient Table: Analytical Focused Method
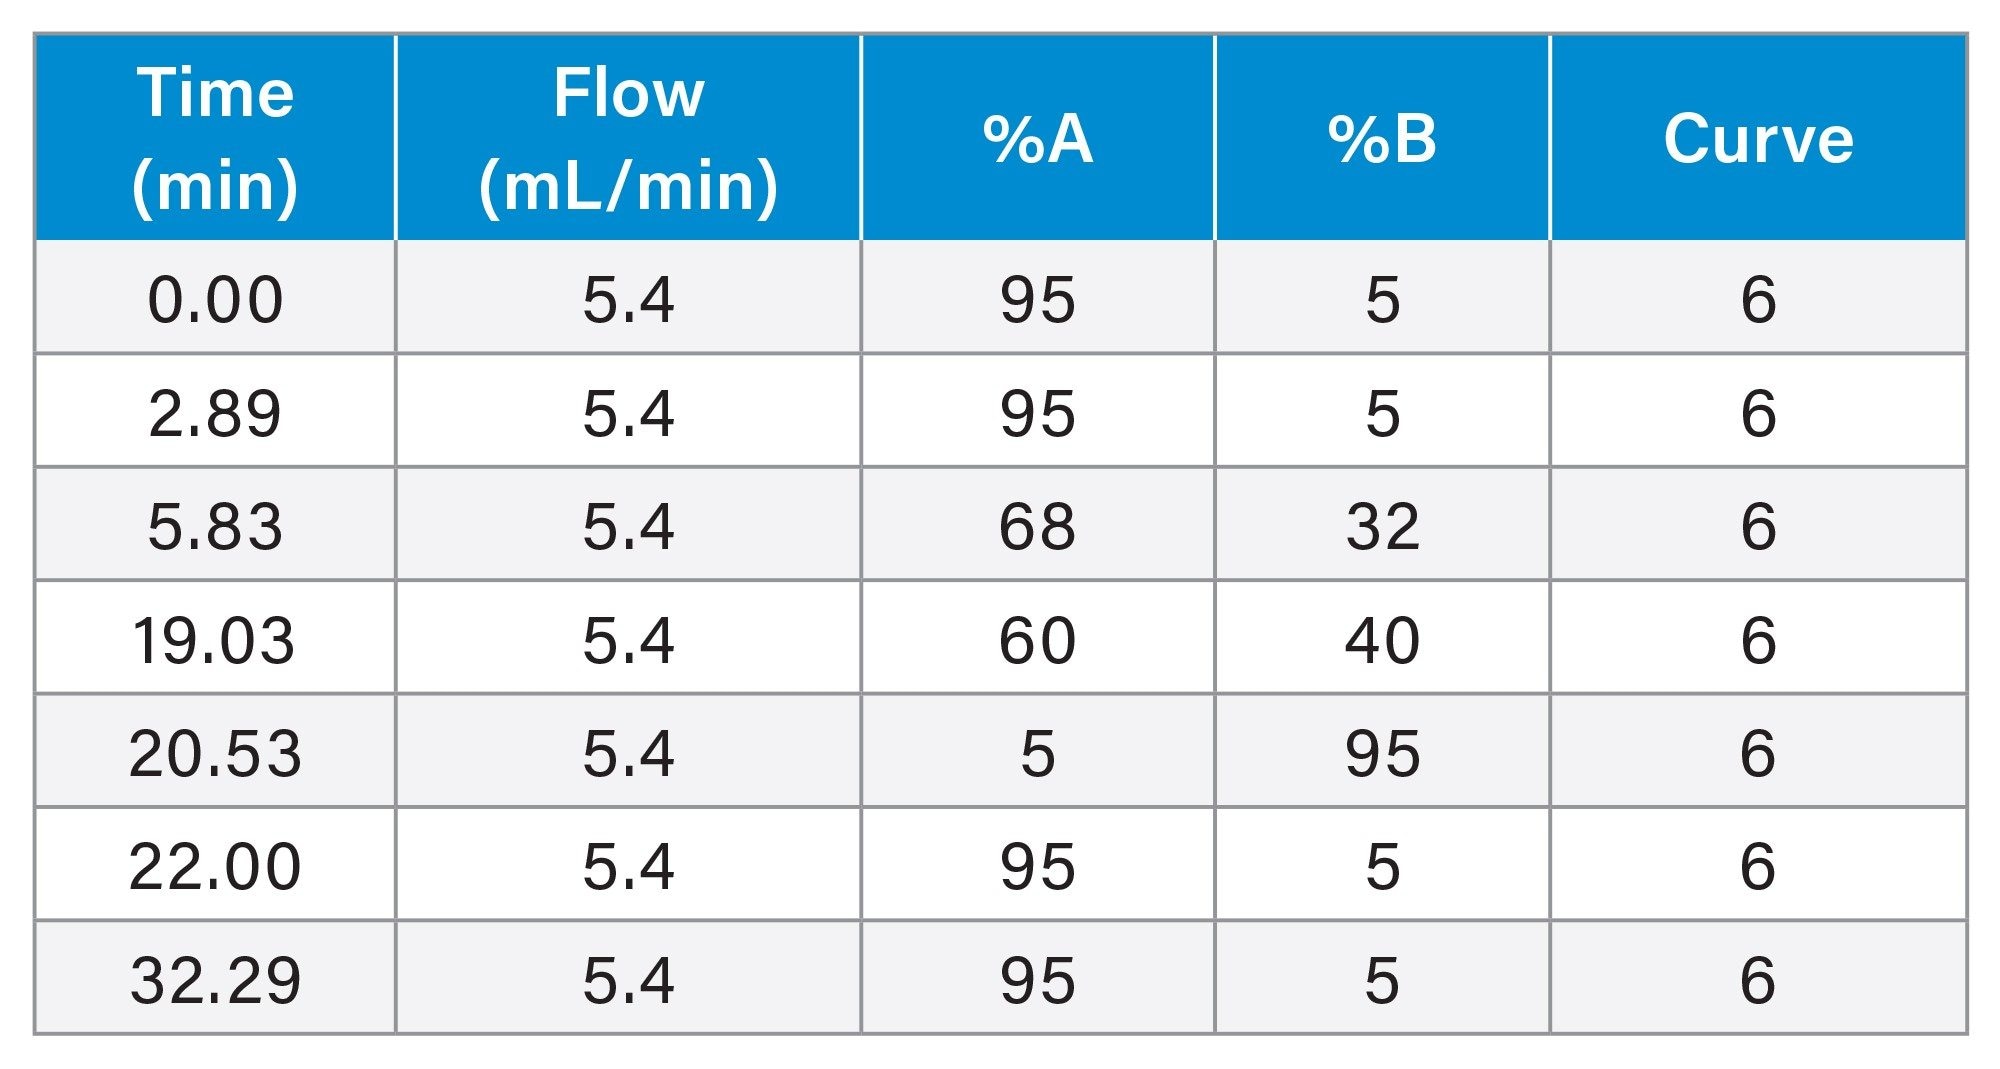
Gradient Table: Preparative Method for 3.5 μm Column
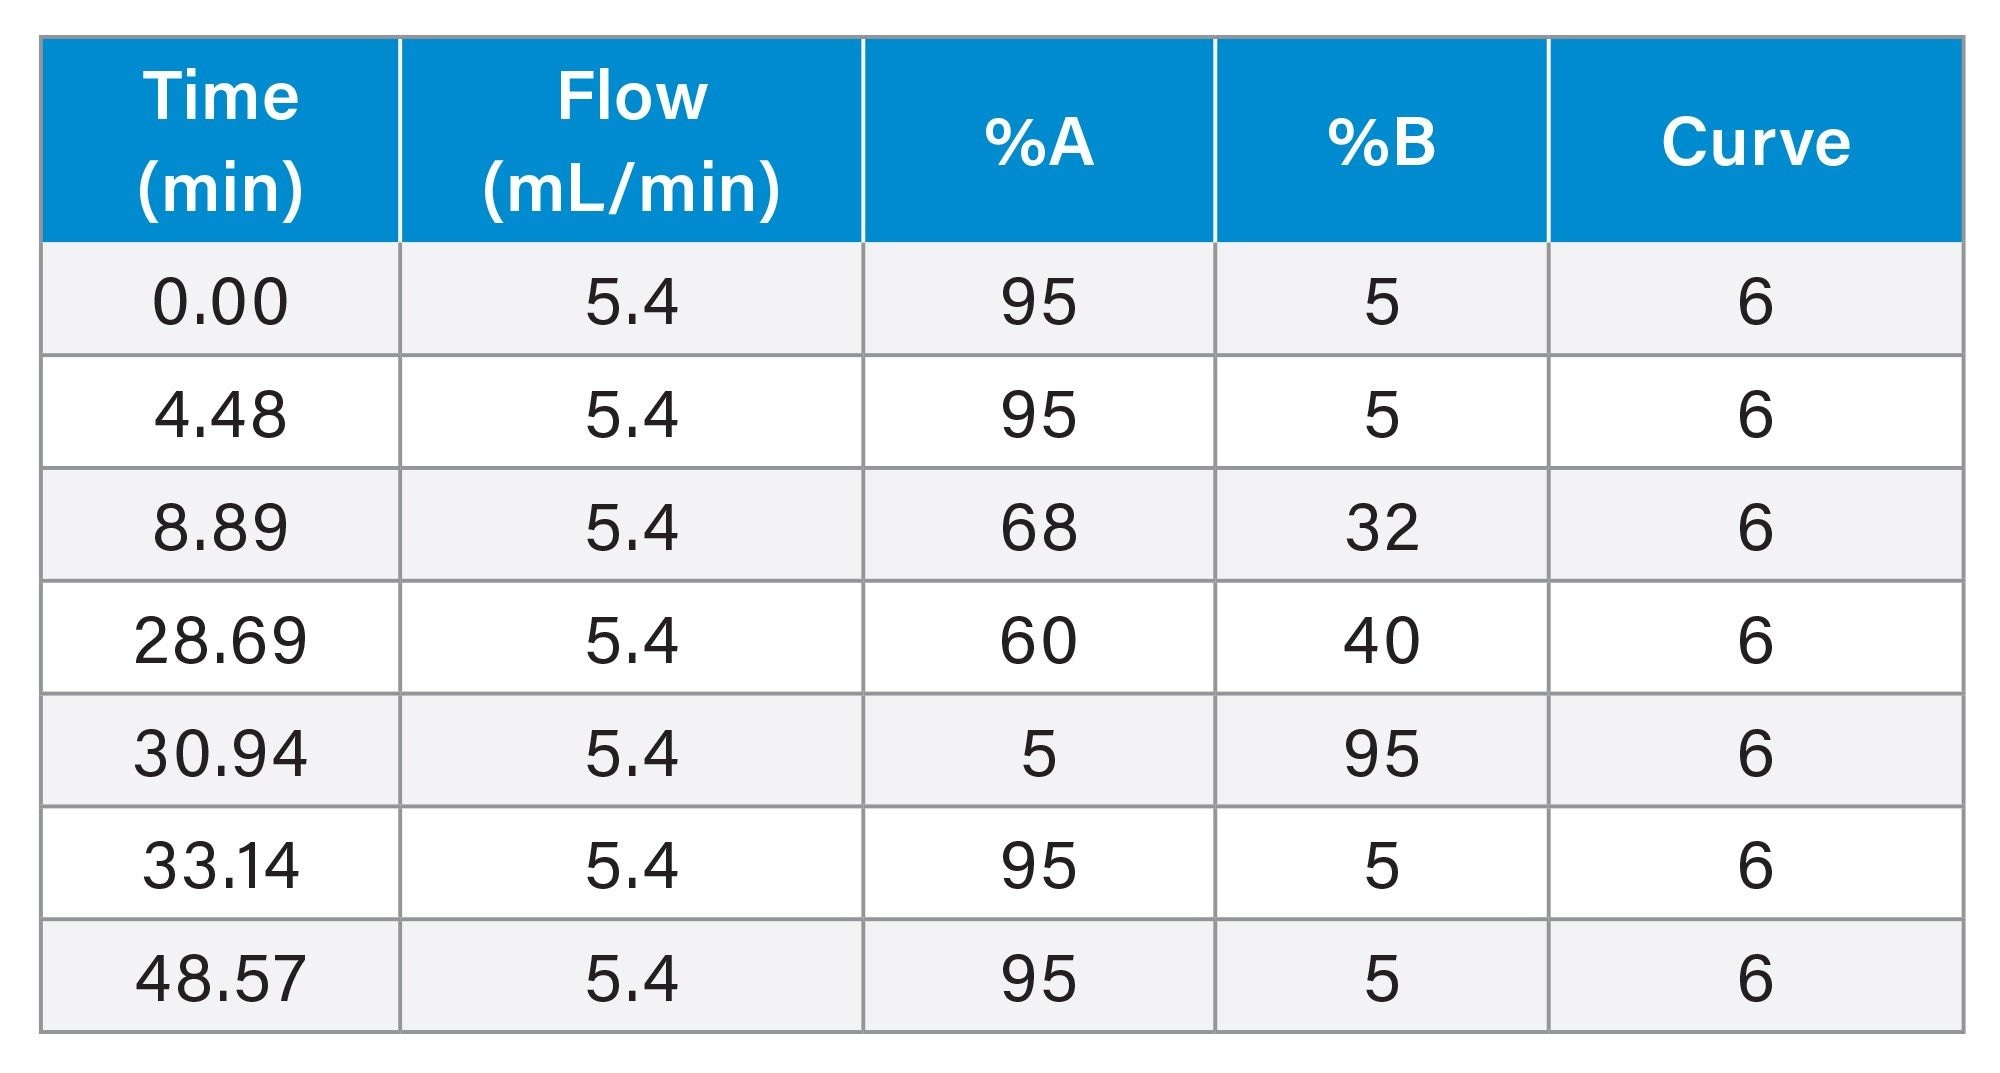
Gradient Table: Preparative Method for 5 μm Column
Gradient Table: Fraction Analysis Method
Data Management
|
Chromatography software: |
MassLynx™ version 4.2 |
|
Application manager: |
FractionLynx |
Results and Discussion
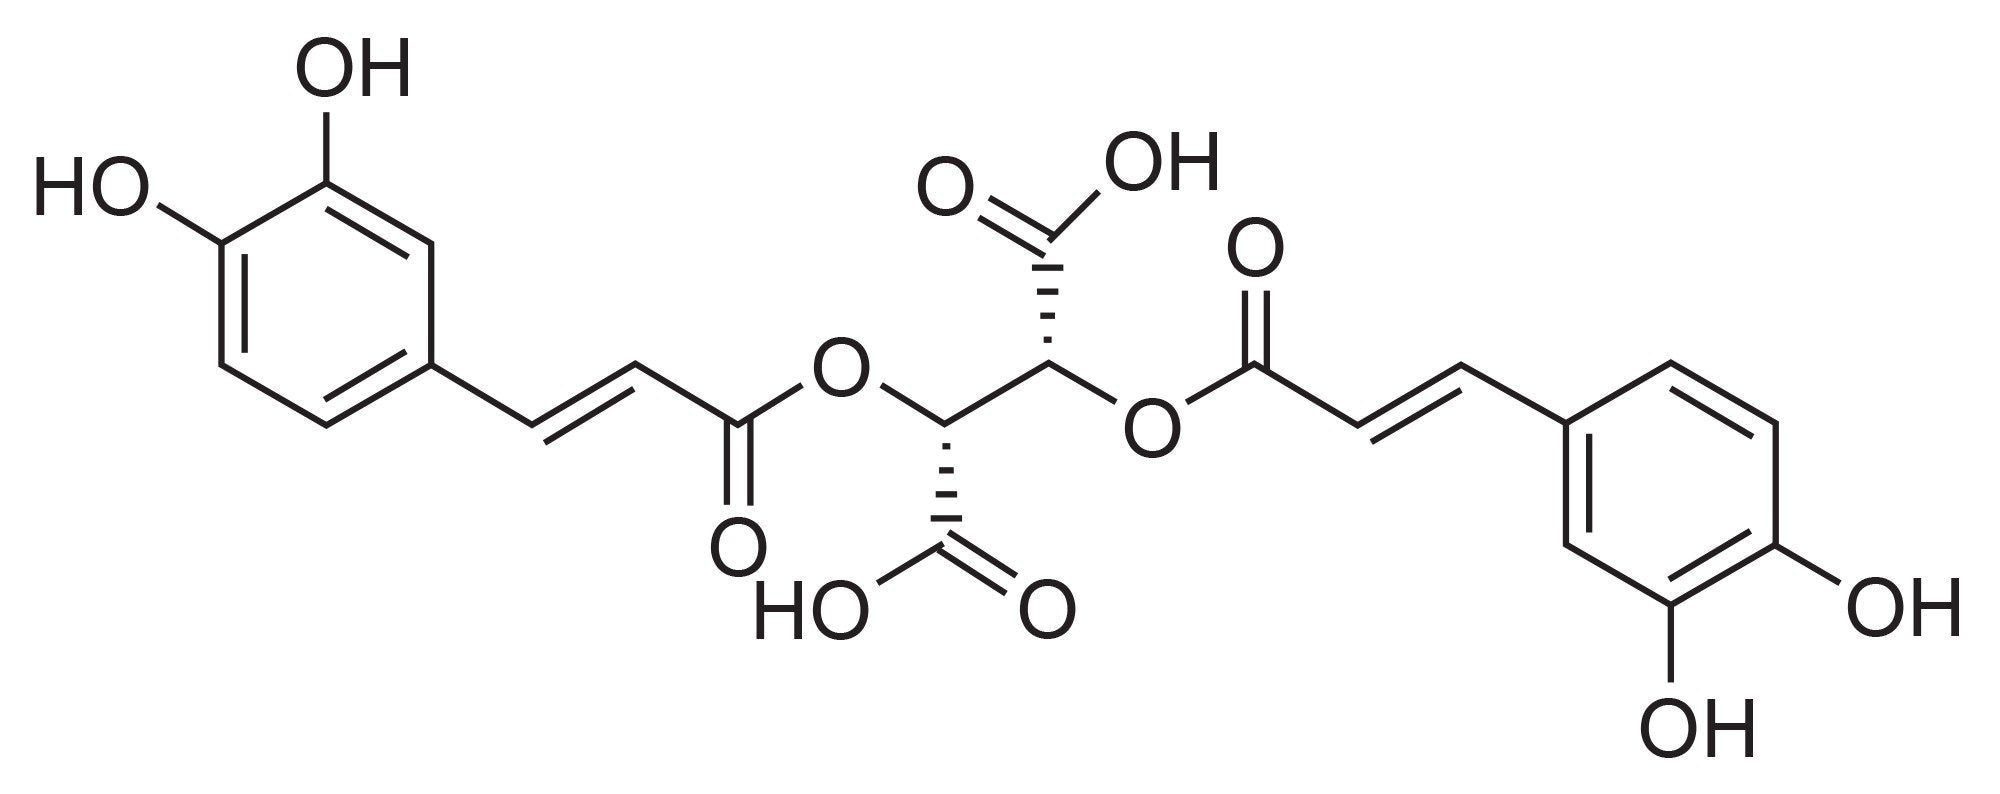
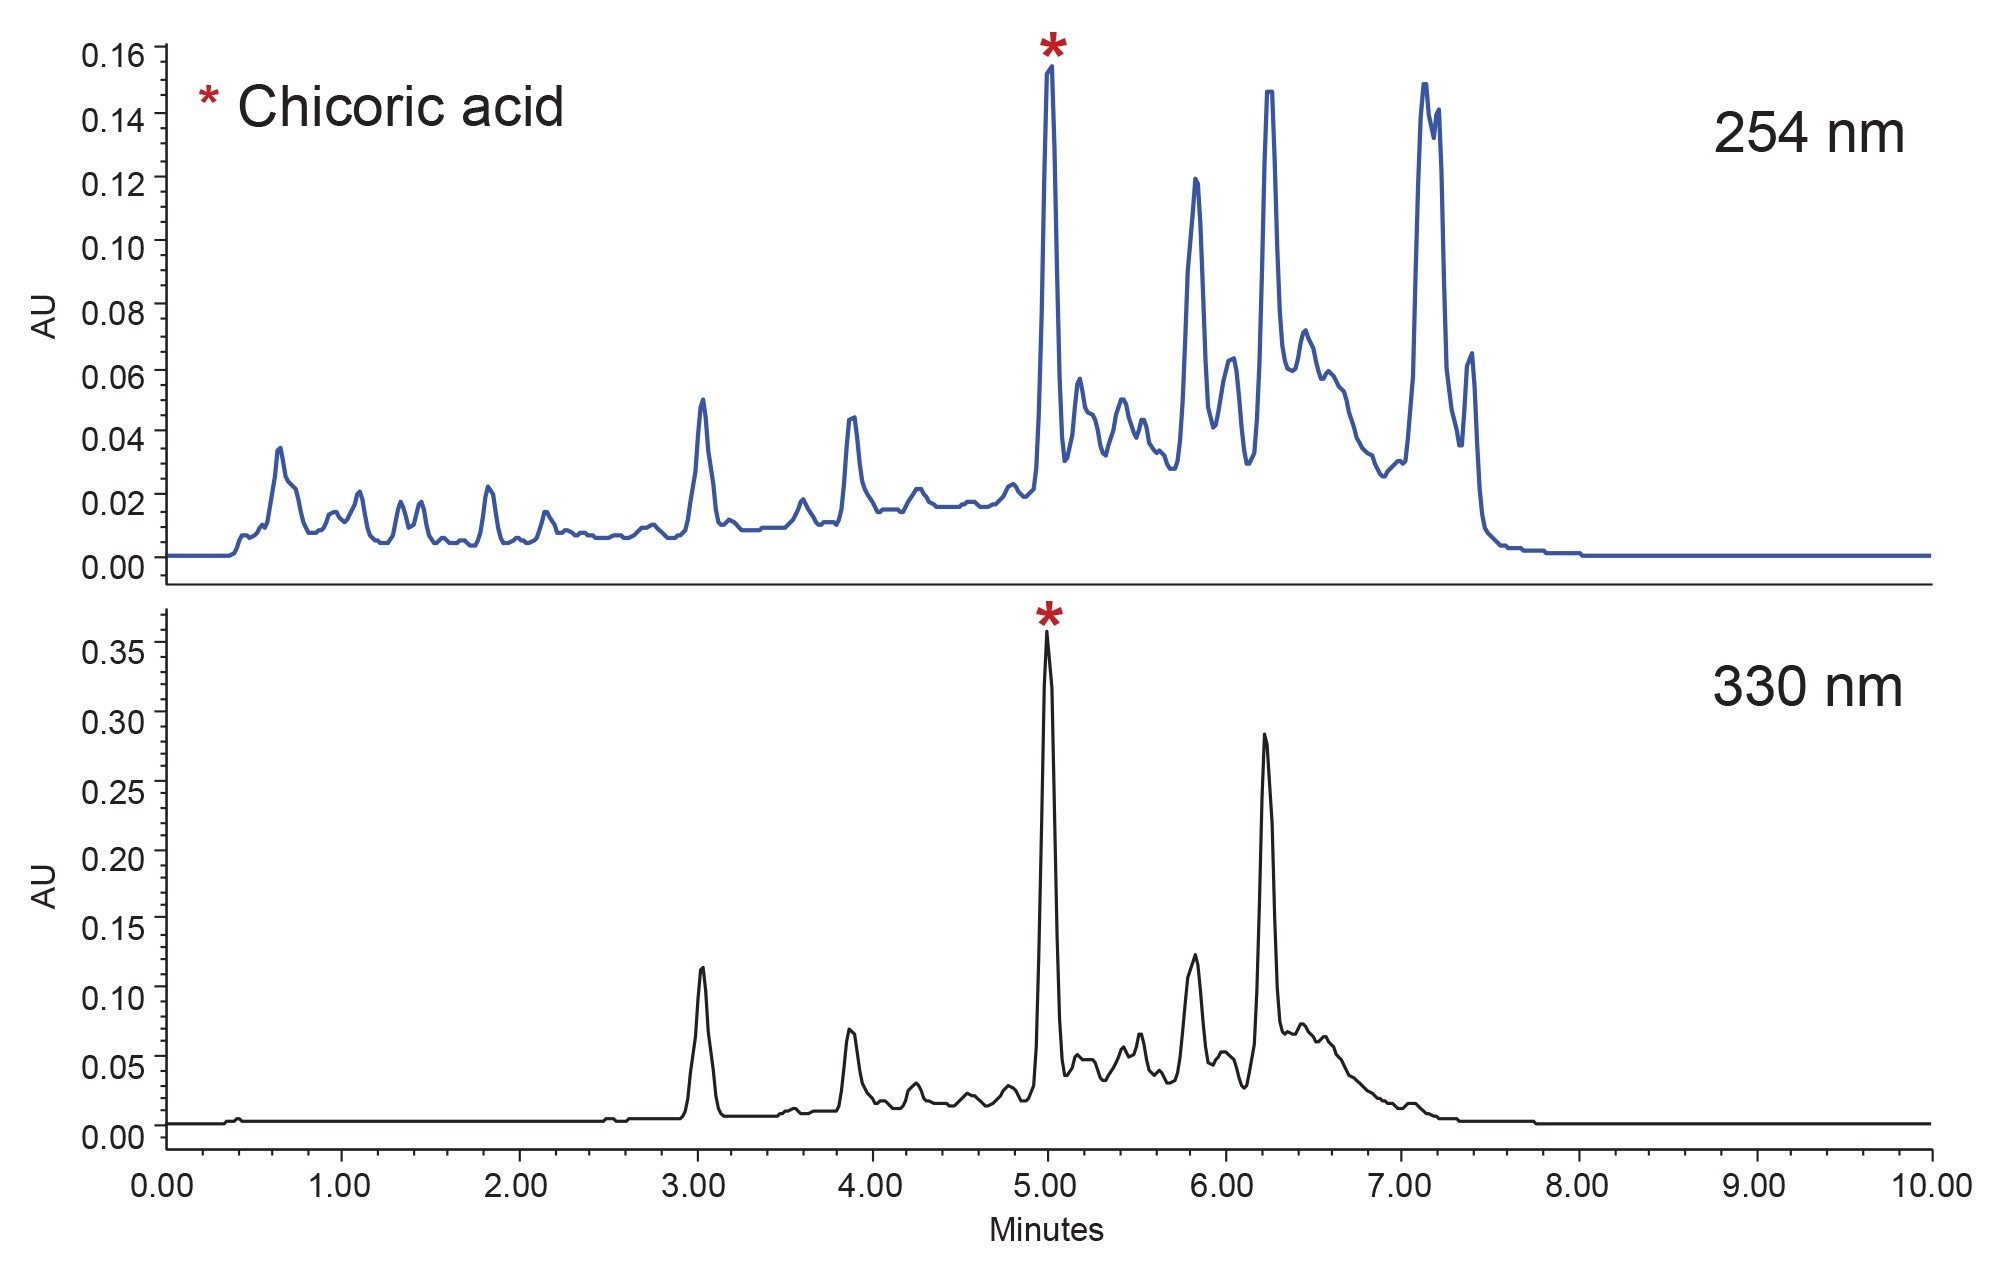
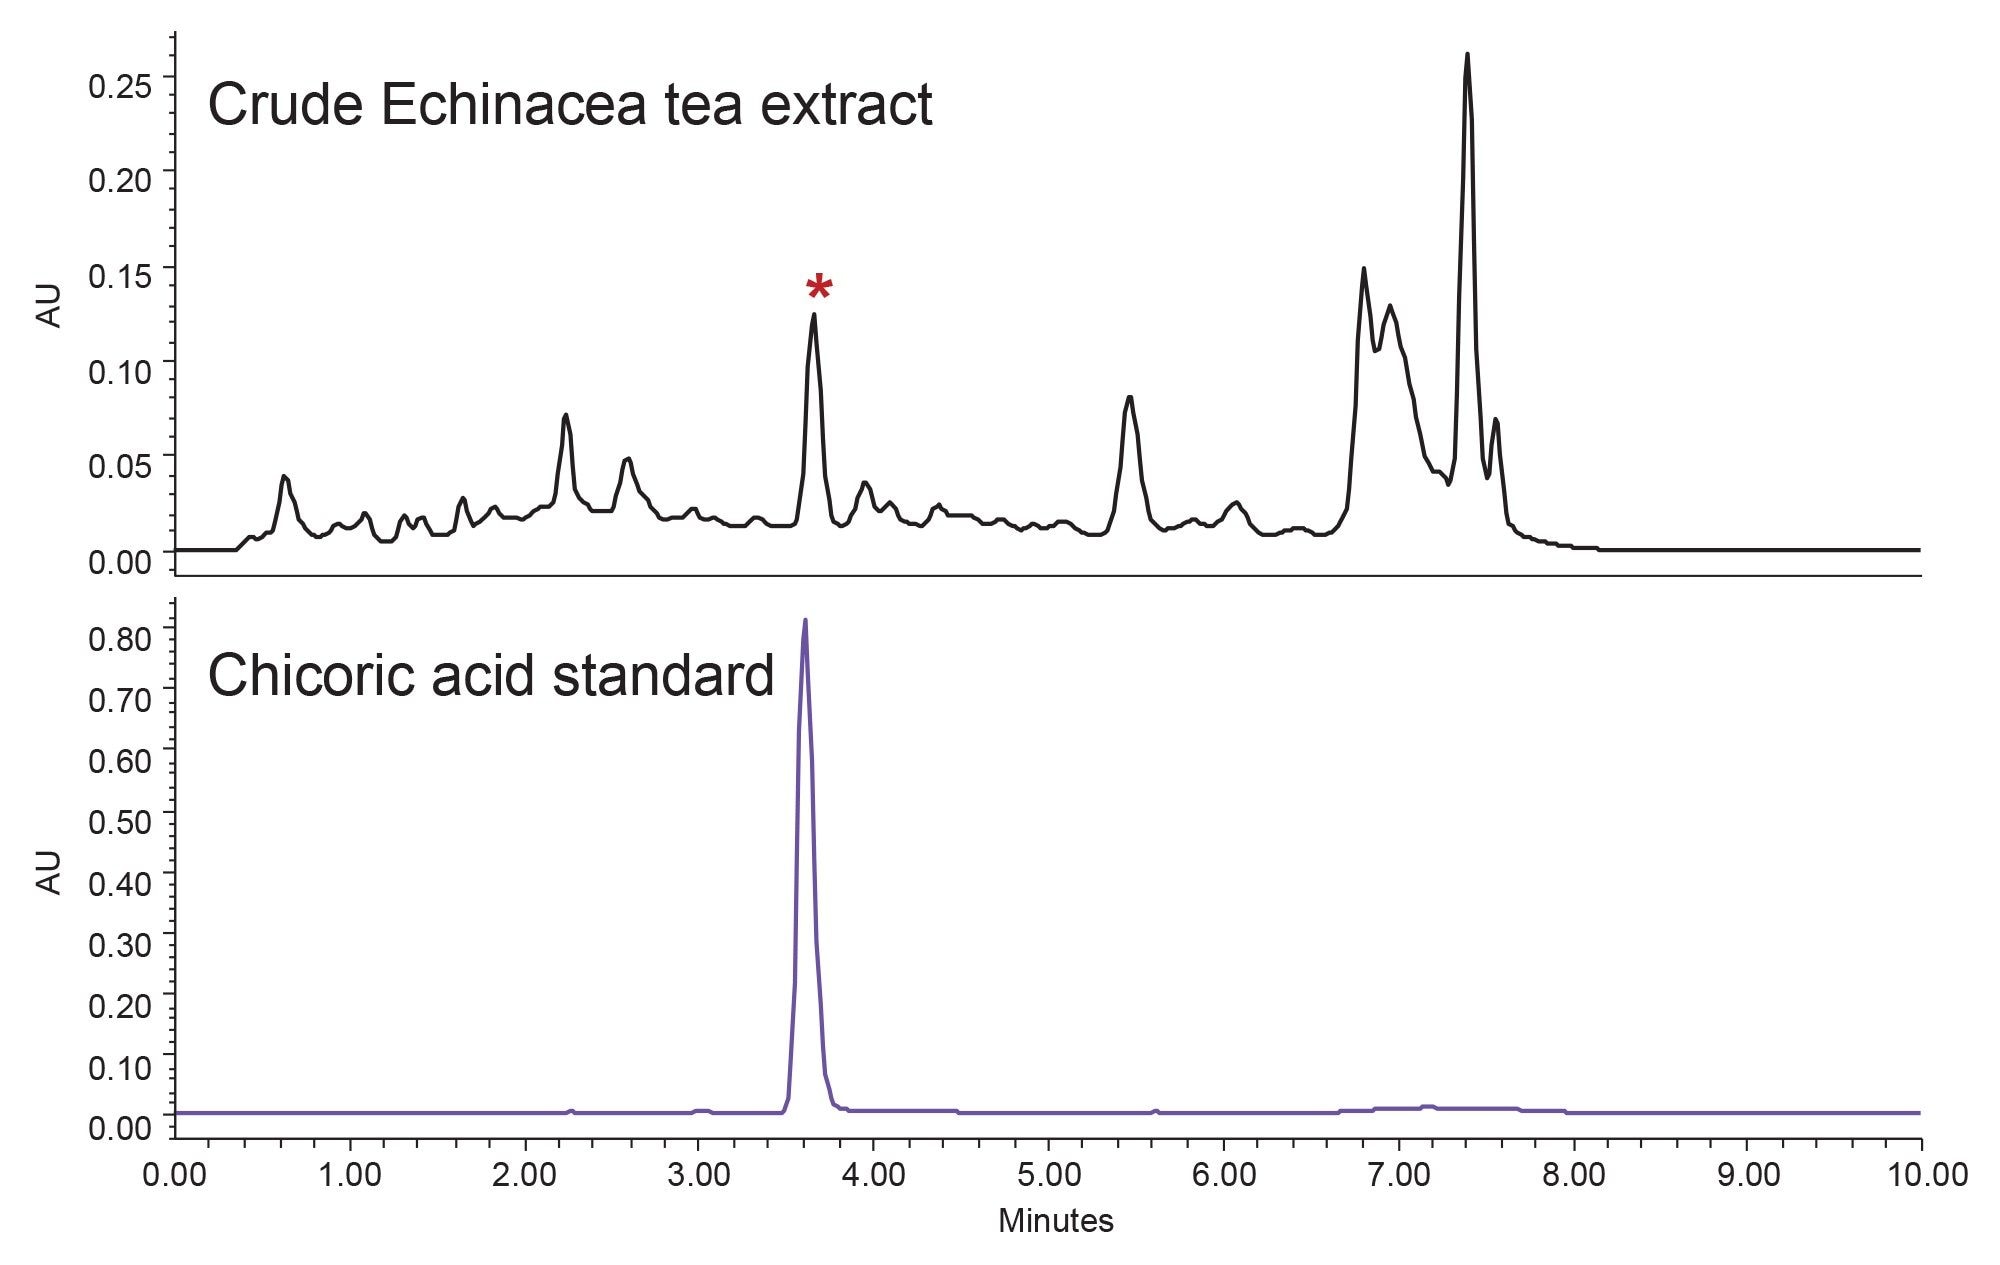
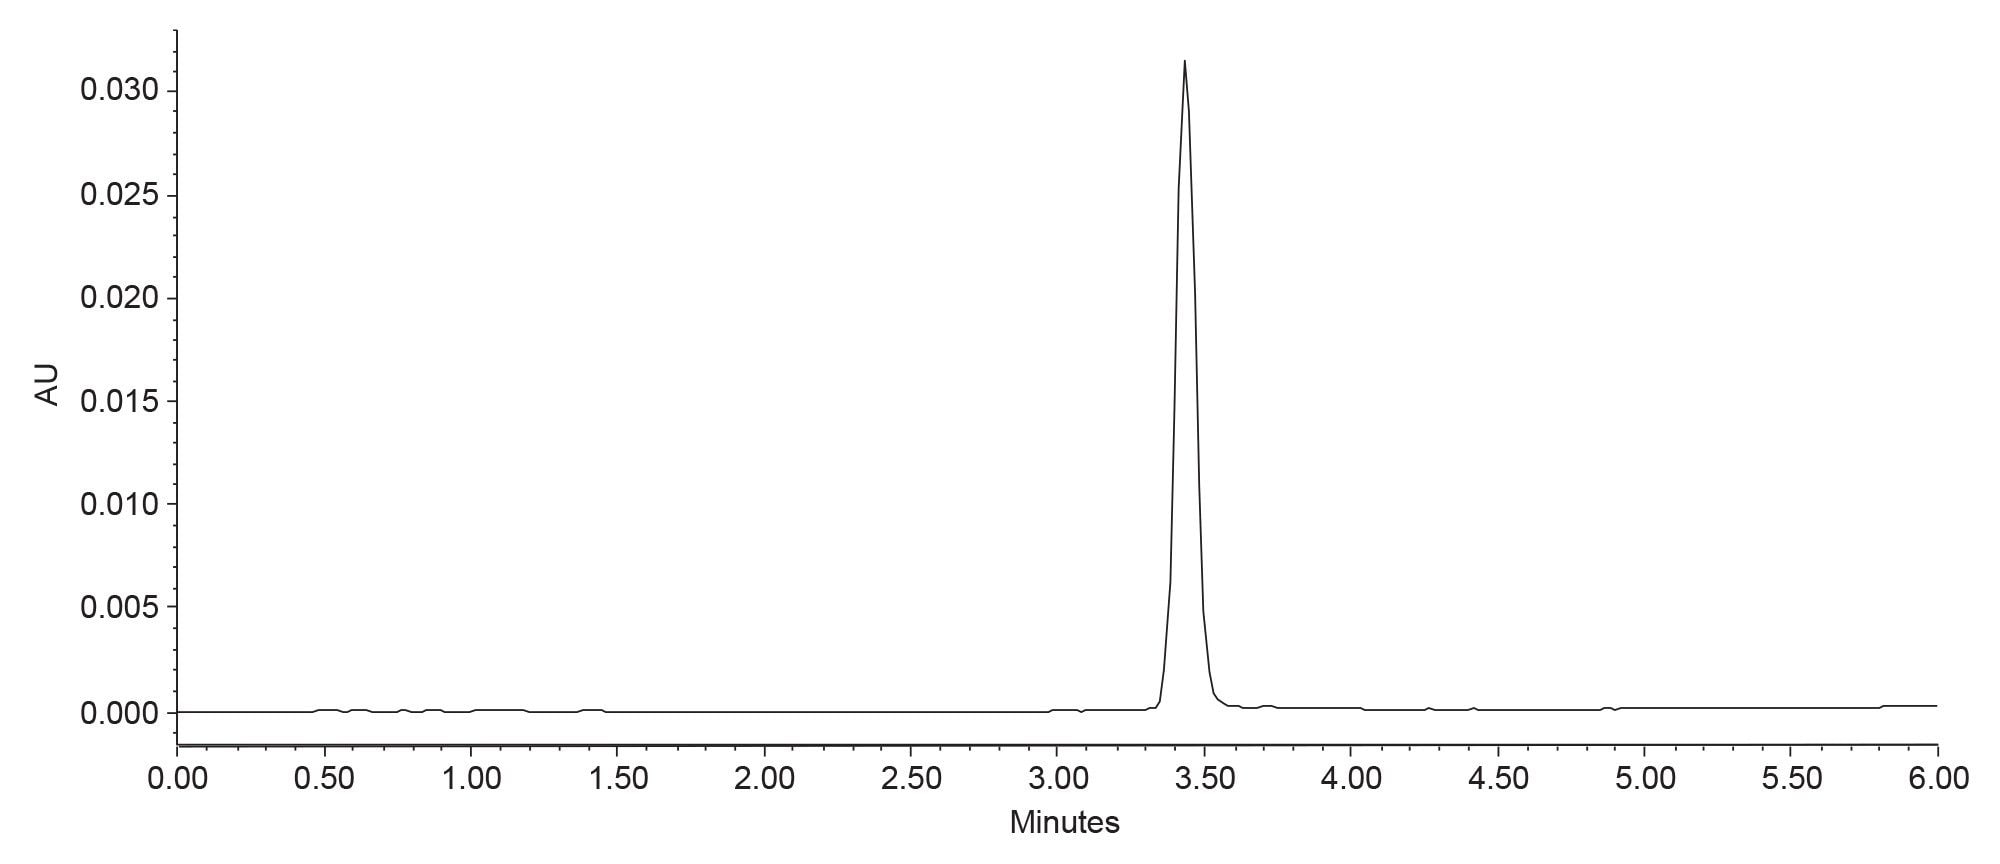
Although there are at least four caffeic acid derivatives in echinacea extracts, chicoric acid (Figure 1) is one of the most abundant, and its usefulness in medicinal herb products arises from its immunostimulating properties.8 An ACQUITY Premier HSS T3 Column was used to evaluate the crude echinacea extract and, indeed, chicoric acid gave the largest peak (Figure 2). The lambda max for chicoric acid is about 330 nm. This wavelength simplifies the chromatographic trace by reducing the absorbance of the compounds which elute after chicoric acid. Impurities eluting very closely to chicoric acid would prevent the isolation of pure target, so the gradient was focused9 to increase the resolution between the chicoric acid and the other crude extract components (Figure 3). Chicoric acid was positively identified in the crude echinacea tea extract by injecting a standard. The 32-40%B focused gradient effectively moved the impurities away from chicoric acid, thereby increasing the probability of isolating pure material.
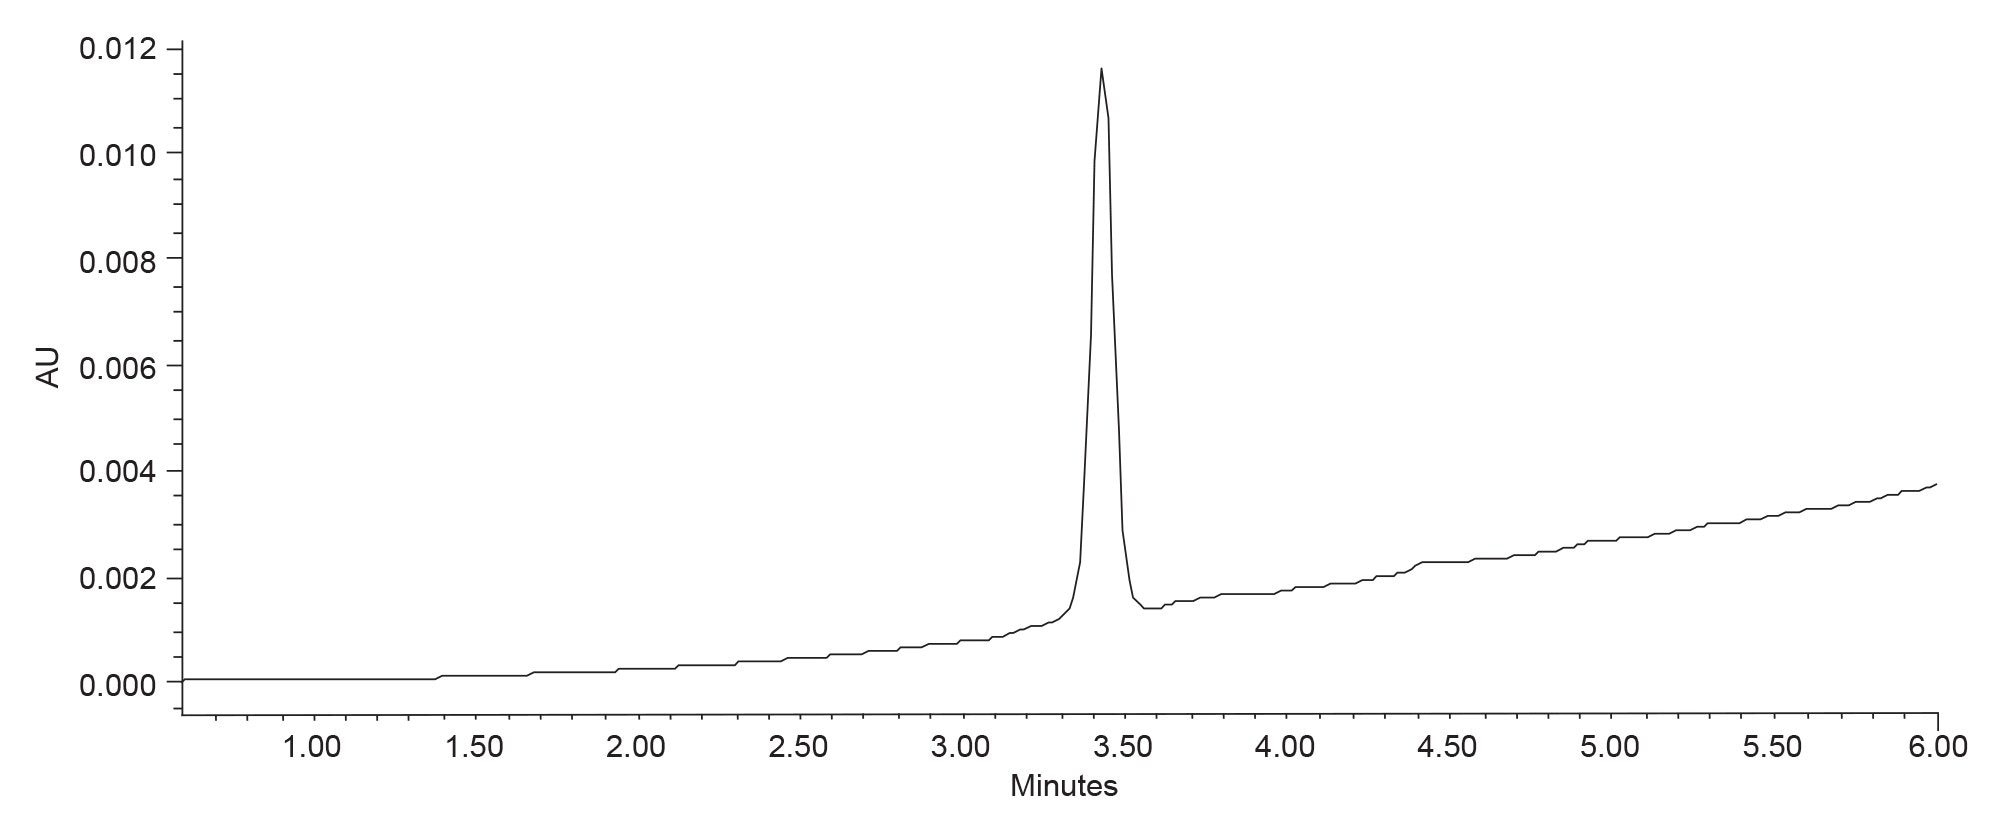
The same focused gradient method was performed on a stainless steel ACQUITY HSS T3 Column with the same dimensions (Figure 4). As shown in Table 1, the peak area for the chicoric acid peak analyzed on the ACQUITY Premier Column was about 7% higher than the peak area on the stainless steel column. The peak height was a little over 2% greater on the ACQUITY Premier Column. Negatively charged molecules can interact ionically with the positively charged metal oxide surfaces of the column and LC flow path in neutral and acidic pH environments and lead to non-specific adsorption (NSA).10 This NSA occurs with stainless steel and titanium, as well as other metals. Compounds with strong acidic moieties like sulfates, phosphates, or carboxylic acids are prone to adsorption which can reduce peak area and cause peak tailing, an undesirable issue in purification where good peak shape and sensitivity are crucial for fraction triggering and compound recovery. MaxPeak High Performance Surface (HPS) technology mitigates the undesirable effects of compound to metal surface interactions with inert surfaces. Since the chicoric acid peak area and peak height were higher when using an inert column at the analytical scale, a MaxPeak Premier OBD Column of the same chemistry was chosen for the isolation.
To maintain resolution when scaling from UPLC to prep, the ratio of the column length (L) to particle size (dp) must be similar.11 The L/dp value for the analytical UPLC columns was 2.78 x 10⁴. Two custom preparative columns were used for the purification, 5 μm 10 x 150 mm XSelect Premier HSS T3 OBD Prep Column (L/dp = 3.00 x 10⁴) and 3.5 μm 10 x 100 mm XSelect Premier HSS T3 OBD Prep Column (L/dp = 2.86 x 10⁴).
Although the 0.35 mL/min flow rate on the 1.8 μm, 2.1 x 50 mm analytical column scales to 2.85 mL/min on the 5 μm 10 x 150 mm preparative column, and 4.08 mL/min on the 3.5 μm 10 x 100 mm preparative column, the flow rate was set to 5.4 mL/min for all prep runs for two reasons. The first reason was to save time, the second was to eliminate the additional fraction timing and configuration step on the LC system. Preparative chromatographers often wish to streamline their isolation strategy by standardizing flow rates and configurations to eliminate extra LC system setup time. The system volumes12 for both the UPLC system and the LC prep system were measured and then used in developing the preparative separation methods.
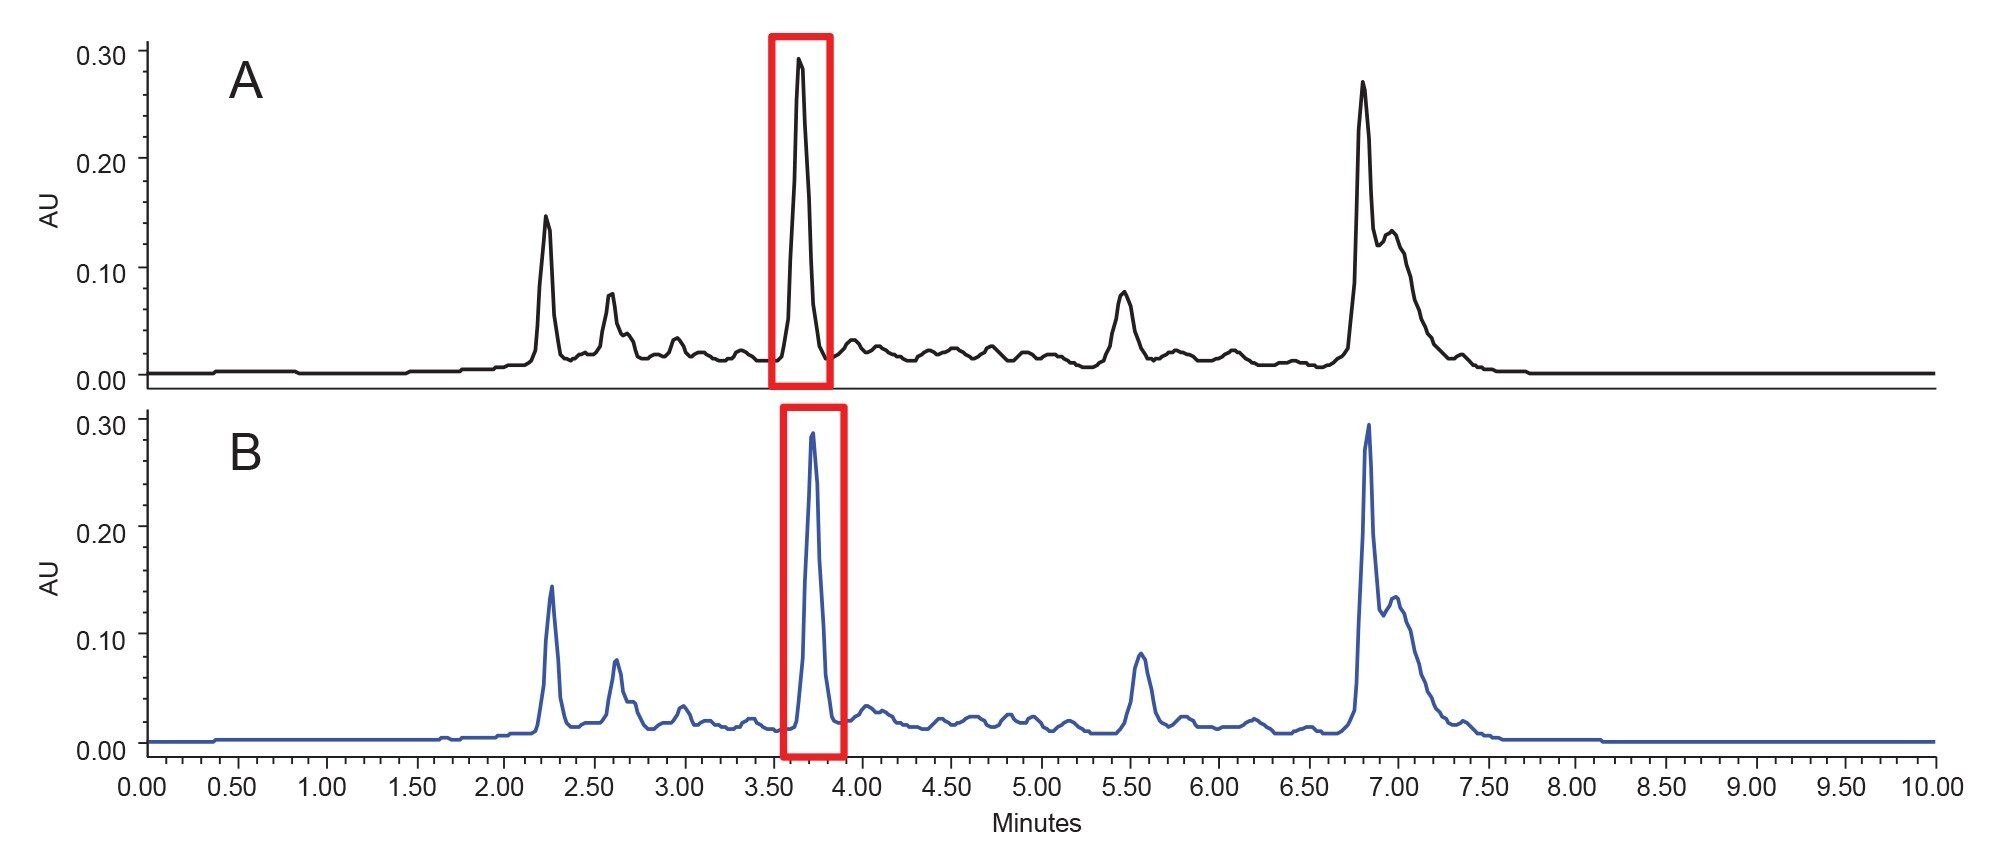
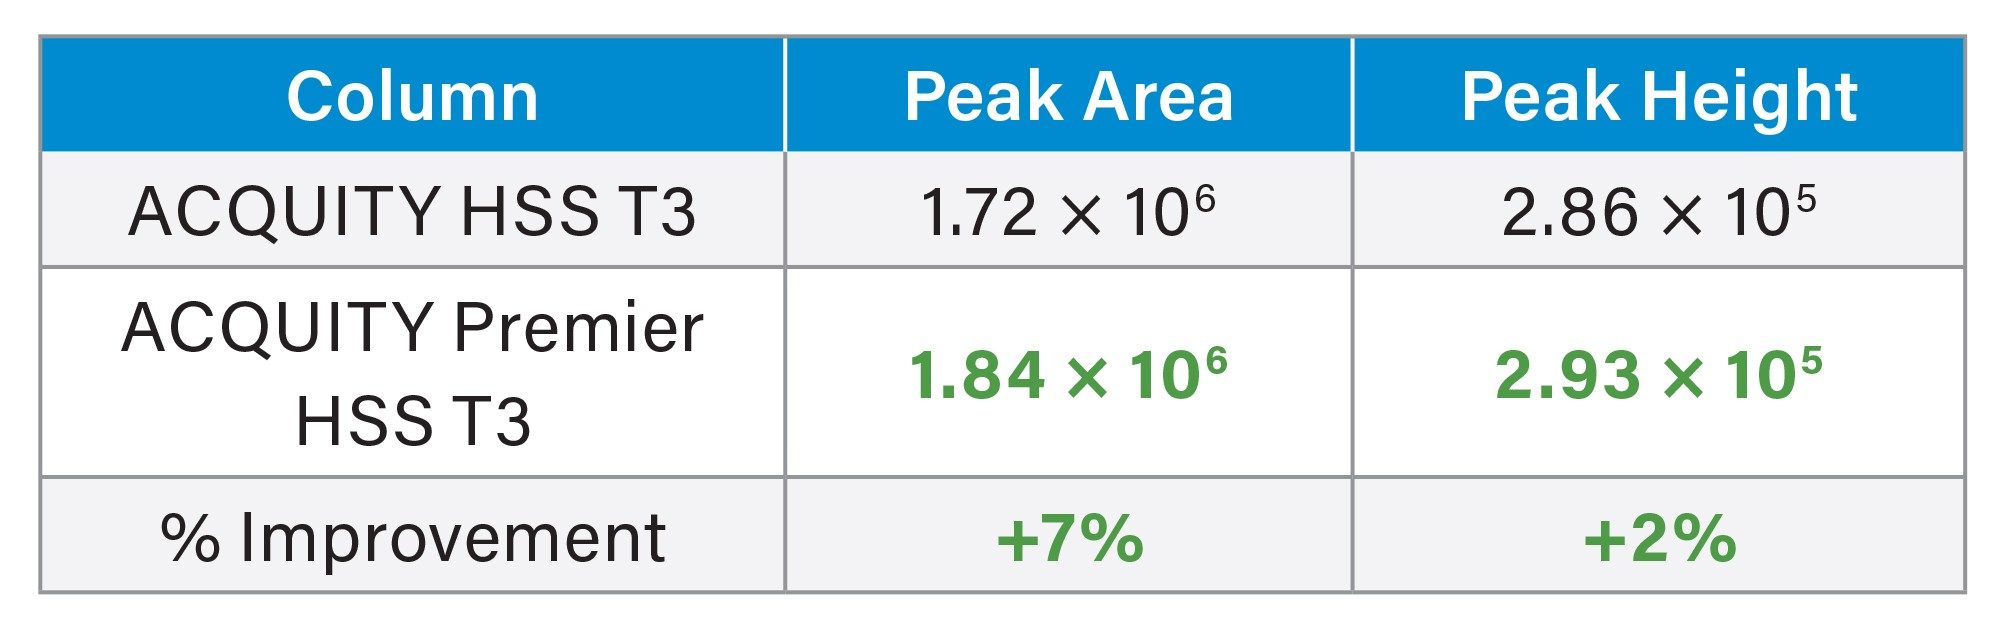
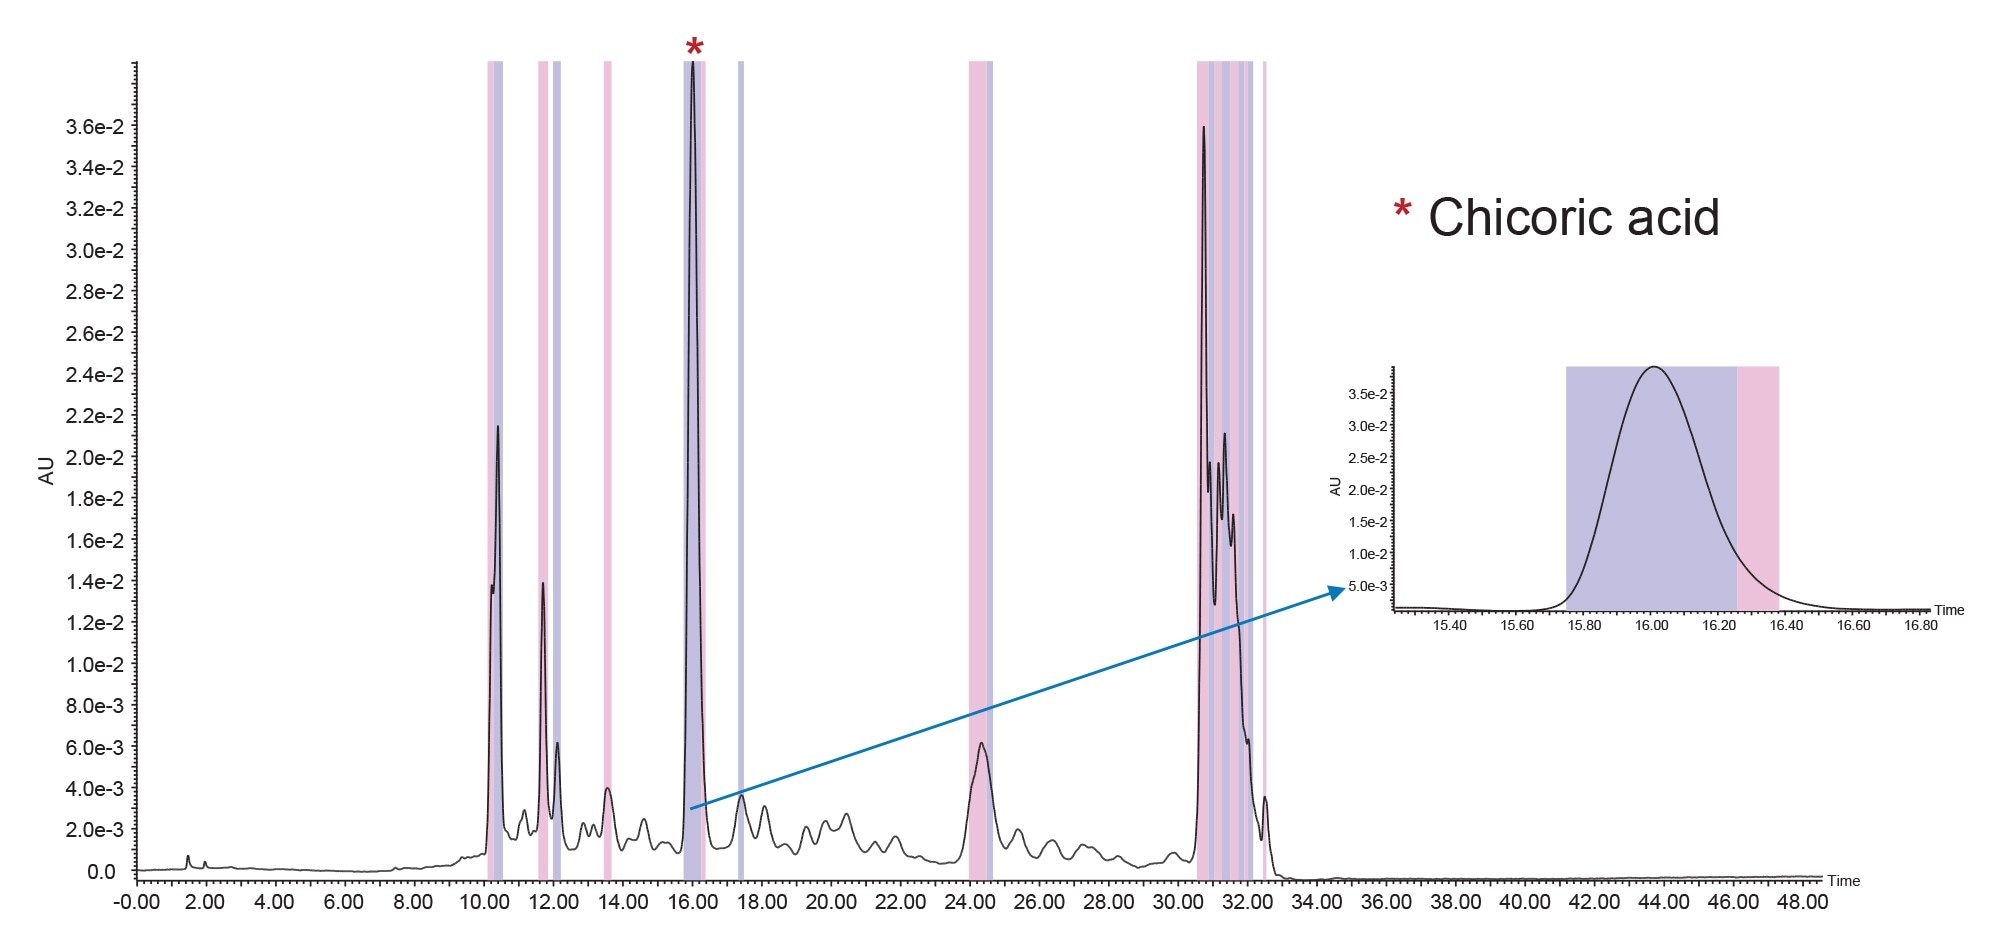
Figure 5 shows the preparative isolation performed on the 5 μm 10 x 150 mm XSelect Premier HSS T3 OBD Prep Column. The preparative chromatography mirrored the analytical separation which demonstrates the direct scalability from UPLC to prep inherent when OBD preparative columns are employed and the rules of scaleup are applied.13
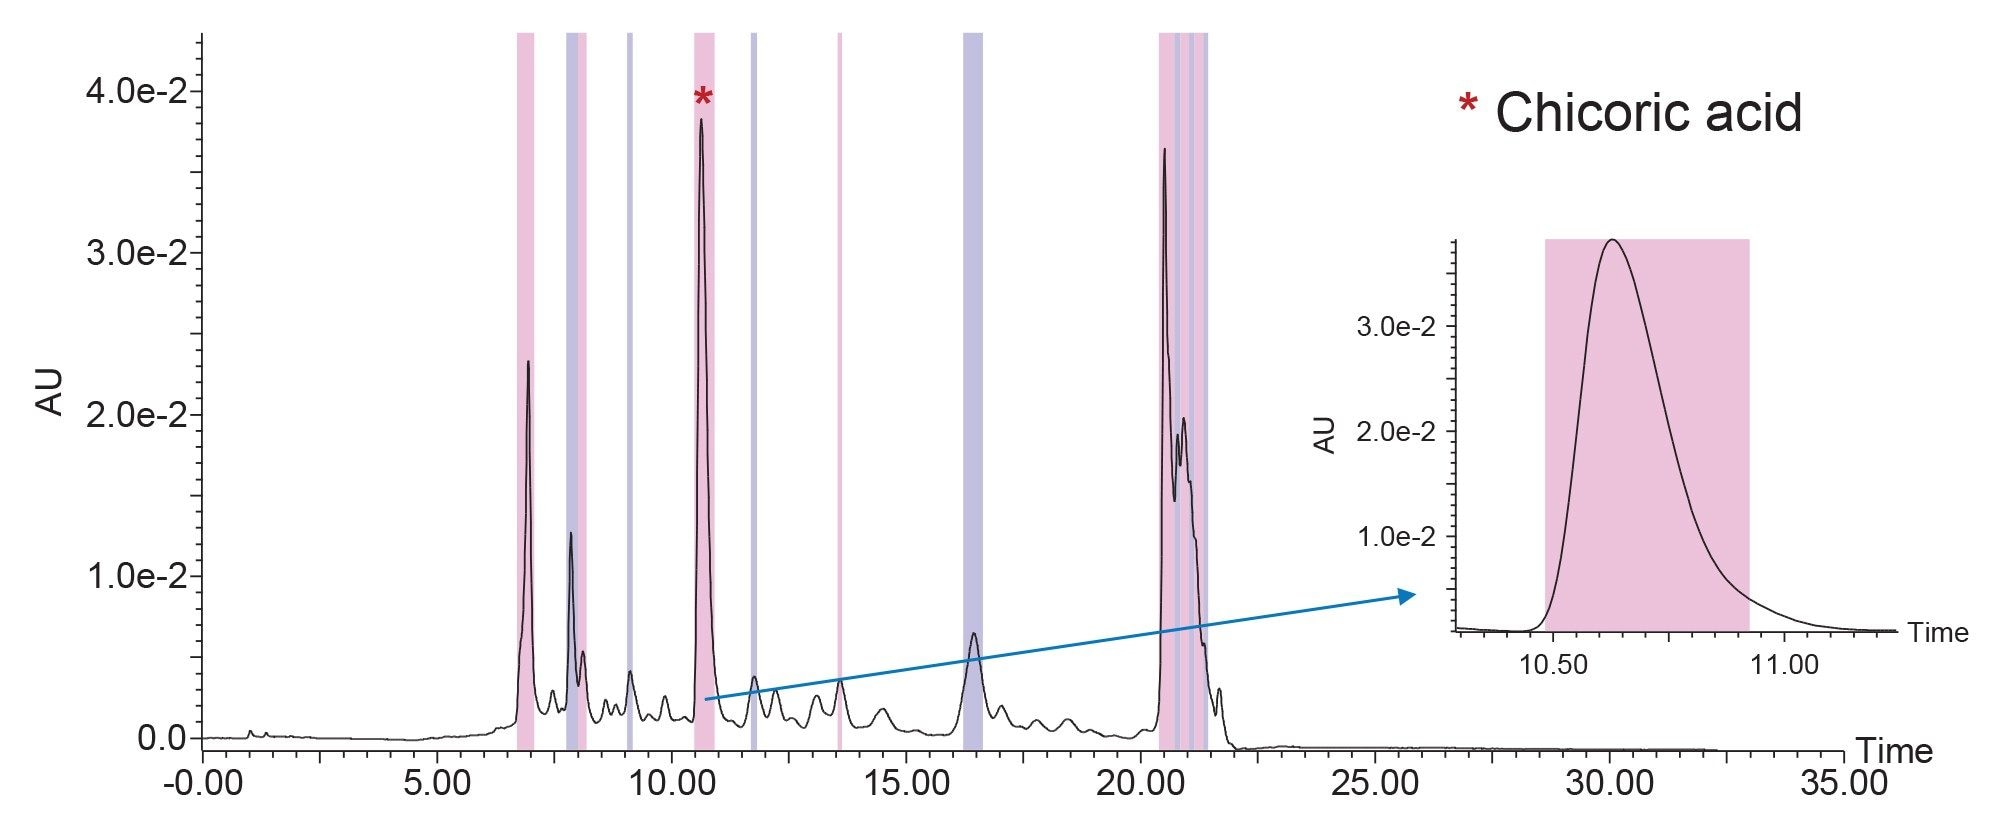
As laboratories work to develop more sustainable processes, strategies that improve overall productivity and efficiency are highly desired. Approaches that save time and solvent while achieving the experimental goals are of particular interest to the purification scientist. The gains in efficiency when transitioning from columns packed with smaller stationary phase particles are well documented.14,15 For these reasons, the chicoric acid isolation was also performed using a 3.5 μm 10 x 100 mm XSelect Premier HSS T3 OBD Prep Column (Figure 6). The chromatographic profile for this separation also mirrored the result obtained by UPLC, once again illustrating predictable scaleup with robust, well-packed preparative columns and adherence to established guidelines.
The gradient slope for the preparative isolations was the same (0.58%/column volume) for both the 3.5 and 5 μm columns. As mentioned earlier, the L/dp ratio was similar between the two columns, and with proper scaling, the resolution was the same. The focused portion of the gradient on the 3.5 μm column was over 6.5 minutes shorter than the same step on the 5 μm column. The full gradient method time for the 3.5 μm column was 16.28 minutes shorter than the full method time for the 5 μm column. At 5.4 mL/min, about 88 mL of solvent would be saved per run, which then, in turn, would reduce the cost of waste disposal. Three isolations were performed on each of the two preparative columns in this study. One purification on each column was run to completion and the other two runs were terminated just after the chicoric acid collection.
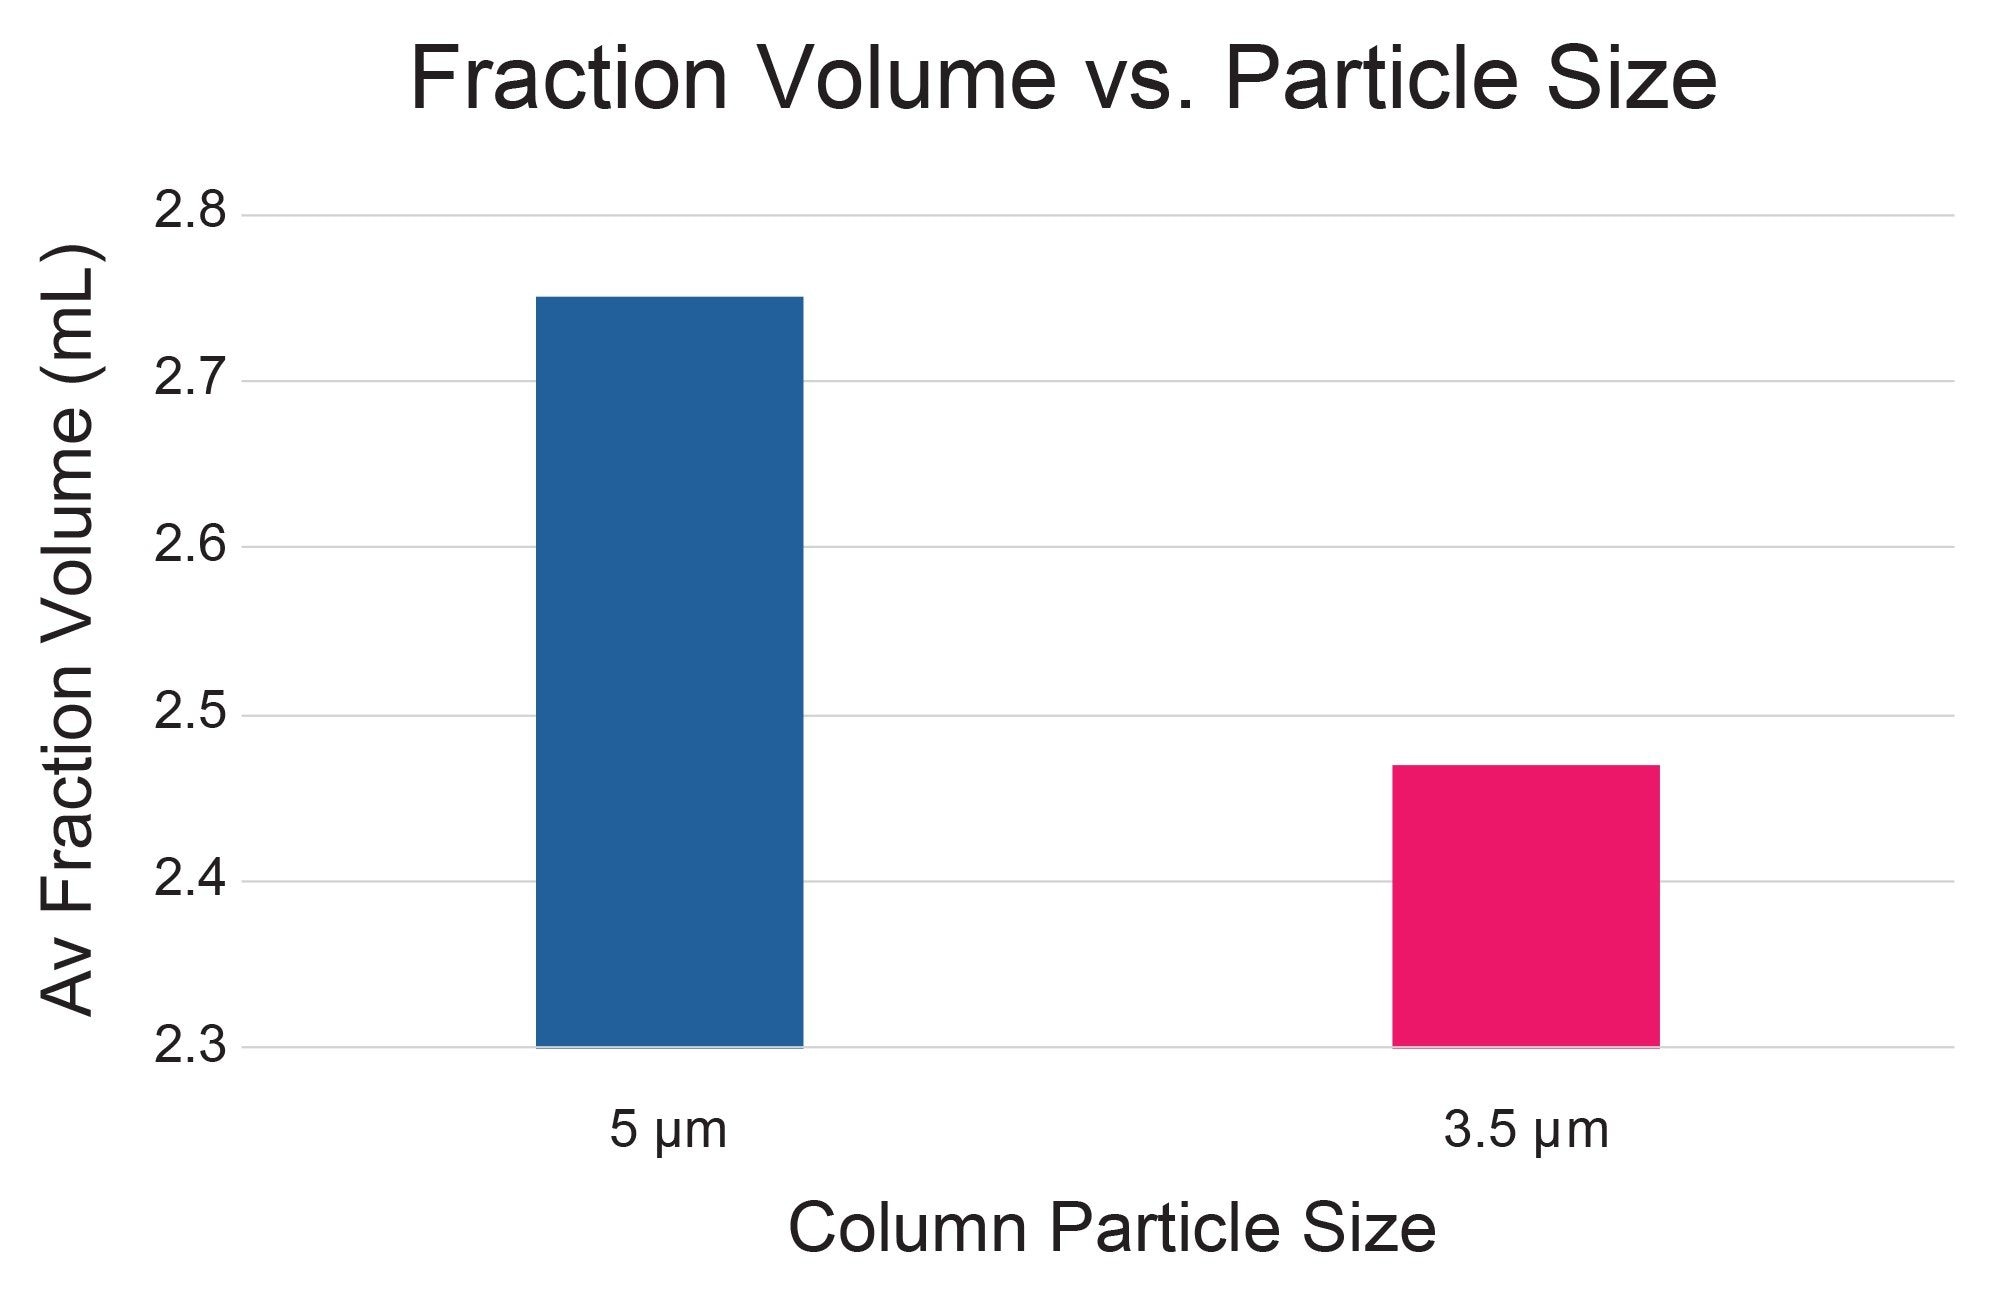
Stationary phase particle size also affects the target peak fraction volume. Narrow, well resolved peaks improve peak detection and fraction triggering. As shown in Figure 7, the average chicoric acid fraction volume from the 3.5 μm column was about 10% less than the average fraction volume collected when using the 5 μm column. Smaller fraction volumes lead to shorter lyophilization times during the final steps of the isolation process.
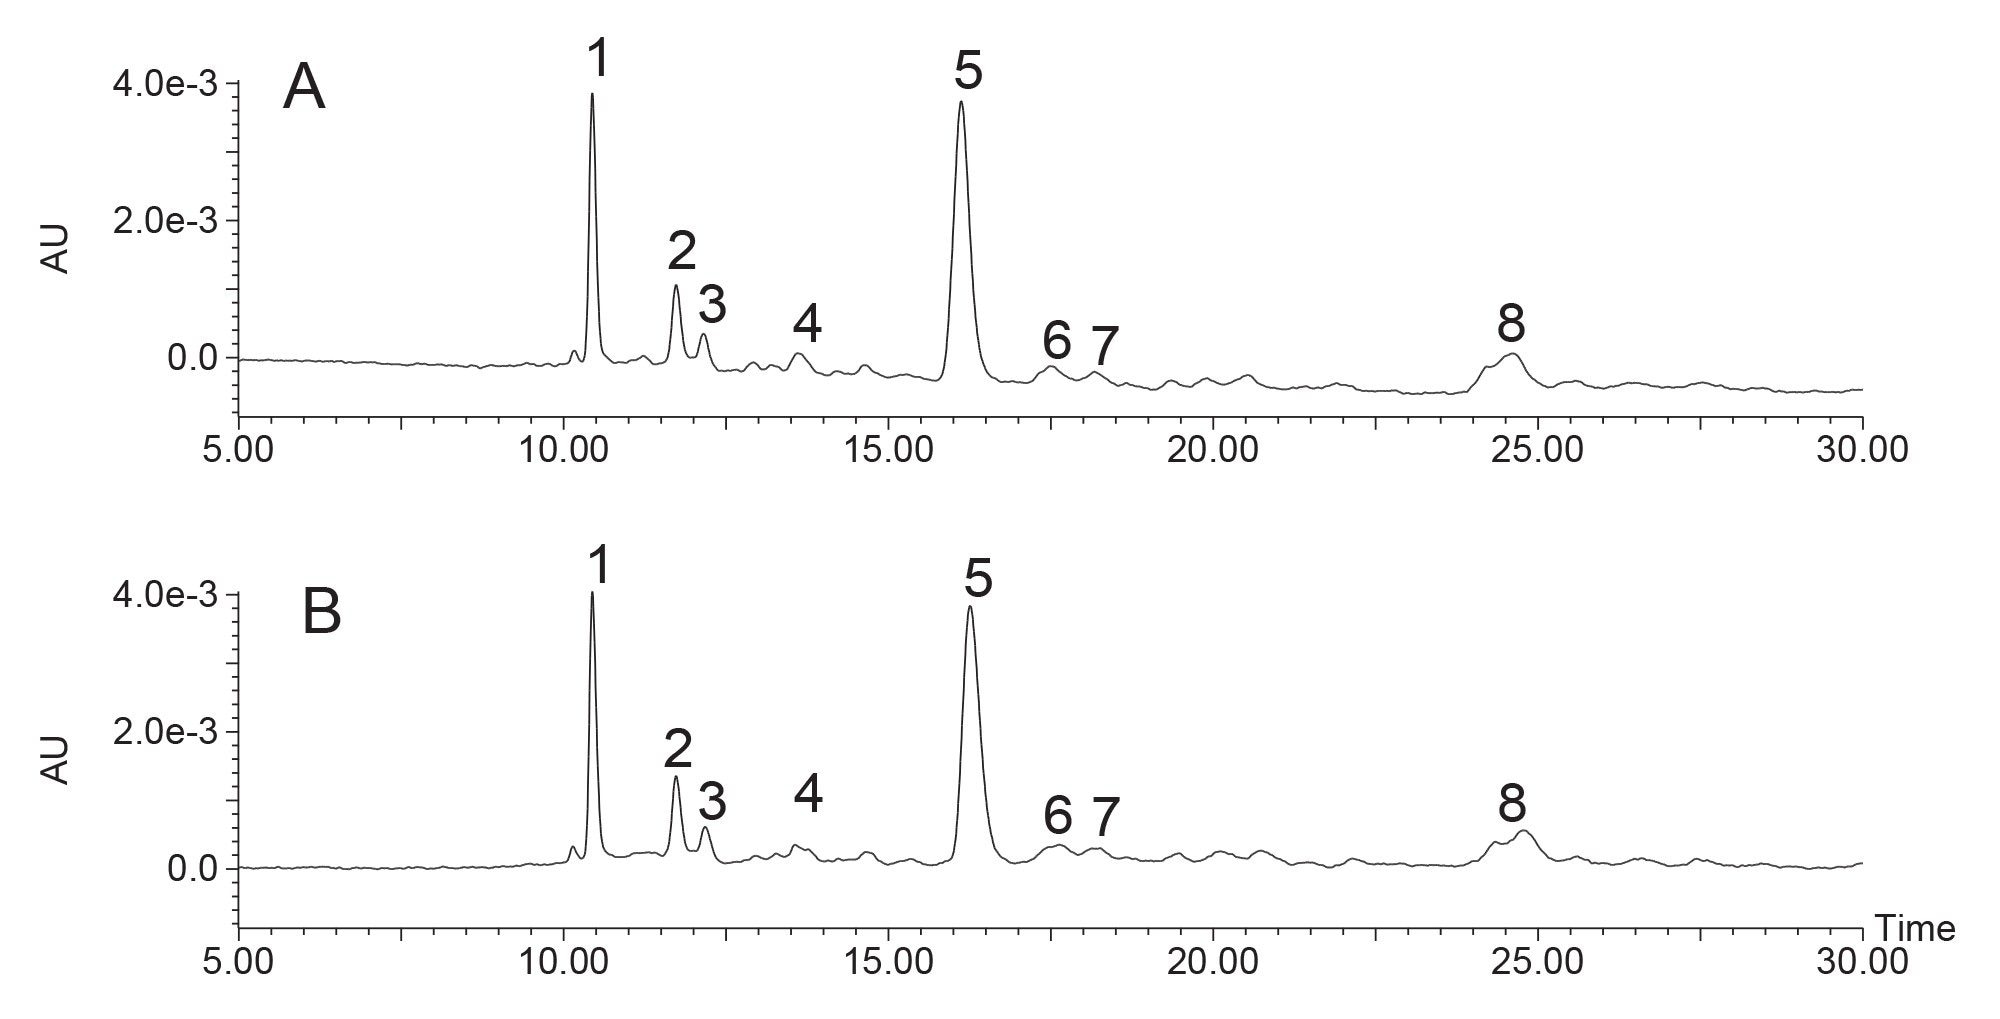
The three chicoric acid fractions from the 5 μm column isolations were pooled separately from the three target fractions isolated using the 3.5 μm column. Each fraction pool was qualitatively analyzed by UPLC using a 5-95%B gradient on the 1.8 μm 2.1 x 50 mm ACQUITY Premier HSS T3 Column (Figures 8 and 9). The chicoric acid isolated from the 3.5 μm column was of equivalent purity to the target recovered from the 5 μm column. These results demonstrate the value of using 3.5 μm columns with inert hardware for efficiently isolating reduced amounts of target for drug discovery and research.
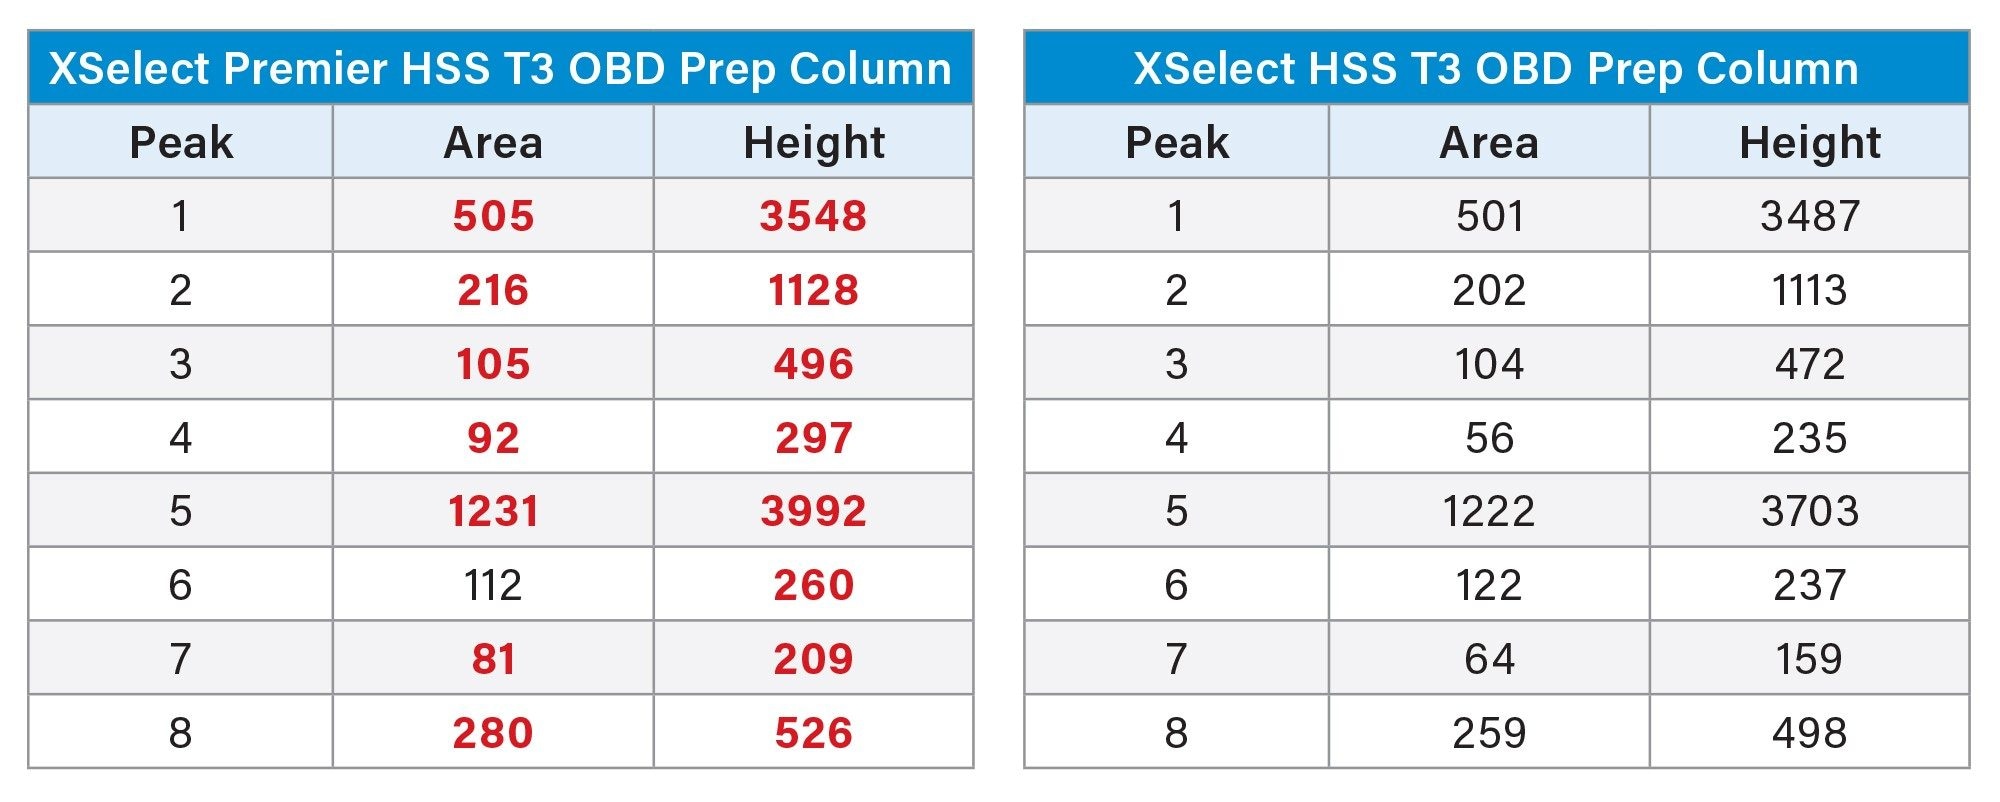
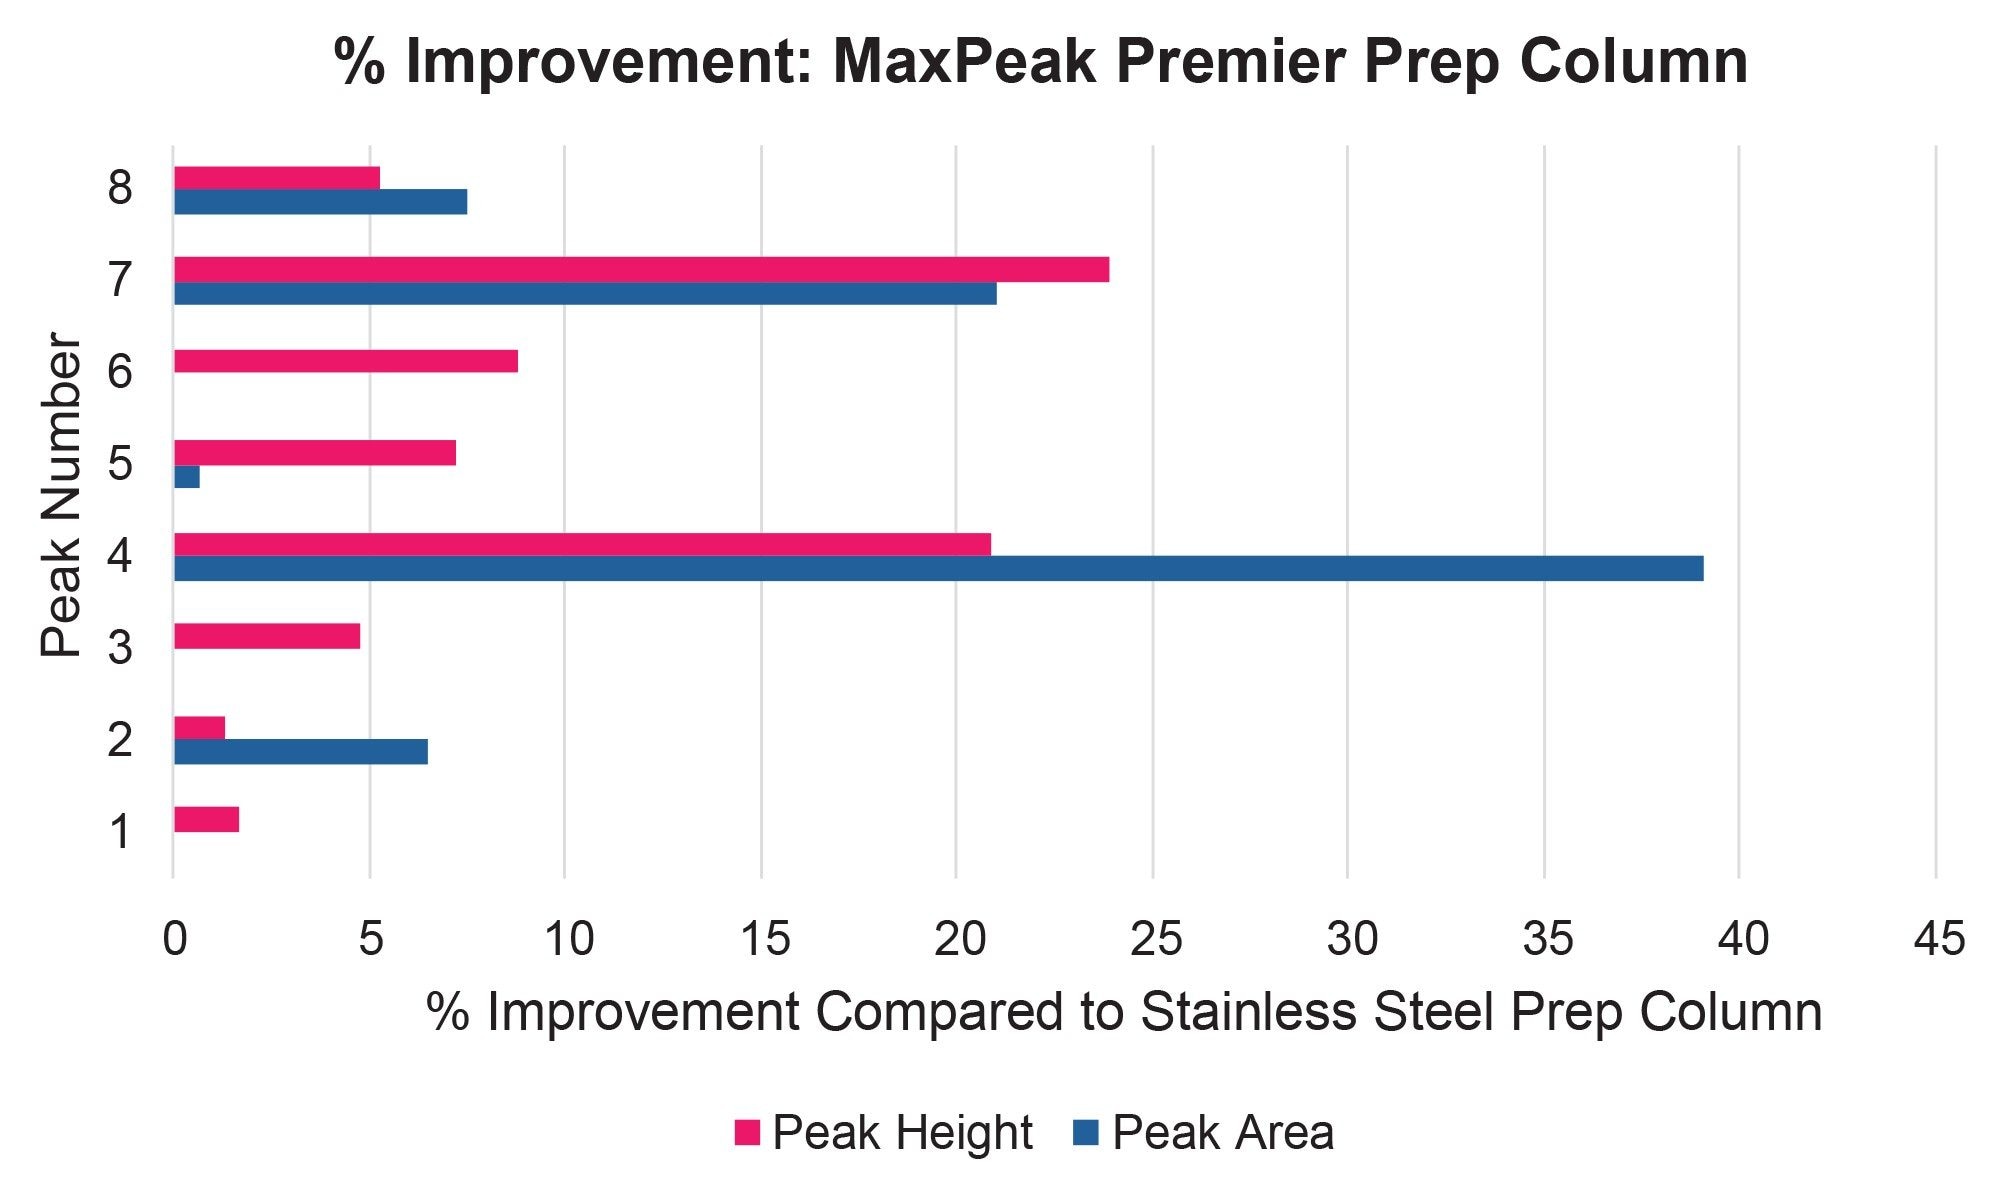
Sometimes the purification scientist must isolate target compounds that are present in the crude sample mixture at very low levels. In other cases, the sample has unknown compounds that might not be targeted as moieties of interest, that is, until they are identified as peaks in the chromatogram. It is imperative that the chromatographic separation be sensitive enough to determine whether or not these low level entities or unknowns are worthy of further investigation. MaxPeak Premier Columns are suitable for these types of purification applications. Figure 10 shows the separation of the echinacea tea extract injected on the 5 μm 10 x 150 mm XSelect Premier HSS T3 OBD Prep Column and the XSelect HSS T3 OBD Prep Column at one-tenth the fully scaled injection volume, i.e., 34 μL instead of the 340 μL shown in previous examples. All but one of the numbered peaks in the chromatograms show increased area and height on the MaxPeak Premier Column compared to the stainless steel column (Table 2). The percent improvement in peak area and height at this low level of sample loading is illustrated in Figure 11. Since multiple injections were not performed at this low loading level, the statistical significance of these differences was not calculated. Although the area and height differences are small, the ACQUITY Premier Column plays an important role in the quest to identify, detect, or isolate low level targets in a crude sample mixture. This is especially important when limited amounts of sample are available, when only small amounts are needed for testing, or when an unknown peak appears during analysis and isolation. Scientists charged with isolating very small amounts of target from 96 and 384 well sample plates execute their purification workflow expeditiously with single injections and small improvements in peak detection are often crucial to their success.
Conclusion
Chicoric acid, one of the most abundant caffeic acid derivatives in echinacea tea, was analyzed and isolated using analytical and preparative MaxPeak Premier HSS T3 Columns. MaxPeak Premier Columns, with their inert surfaces, reduce interactions between certain compounds and the stainless steel present in conventional columns. The HPS technology used in MaxPeak Premier Columns (Waters HPS technology) increased the peak area of chicoric acid in the crude sample extract. Waters OBD Technology, used in the manufacture of Waters preparative columns, promotes predictable scaleup from UPLC to prep. Chicoric acid was successfully isolated using both 3.5 and 5 μm XSelect Premier HSS T3 OBD Prep Columns and analysis of the fraction pools showed the UV purity to be equivalent for both sets of isolations. 3.5 μm preparative columns improve purification process efficiency and promote sustainability by reducing method run time, solvent usage, and fraction lyophilization time. Decreased solvent usage leads to lower process costs for the solvent as well as for waste disposal. These technologies are well-suited for the demands of the purification laboratory when results must be generated efficiently to satisfy accelerated production timelines.
References
- Sunset Editors. Sunset Western Garden Book, 1995; 606-607.
- Flora of North America (FNA), Vol 21, p.43,64, 65, 88.
- Jahanian, E., Jahanian, R., Rahmani, H., Alikhani, M. Dietary Supplementation of Echinacea purpurea Powder Improved Performance, Serum Lipid Profile, and Yolk Oxidative Stability in Laying Hens. J. Appl. Anim. Res., 2017, Vol. 45, No.1, 45-51. https://doi.org/10.1080/09712119.2015.1091344
- Hall III, C., Schwarz, J., Shi, J., Mazza, G., LeMaguer, M., ed., Functional Foods: Biochemical Processing Aspects 2, CRC Press, p. 241, ISBN 1-56676-902-7, retrieved 2008-12-09.
- Luo, X., Chen, B., Yao, S, Zeng, J. Simultaneous Analysis of Caffeic Acid Derivatives and Alkamides in Roots and Extracts of Echinacea Purpurea by High-Performance Liquid Chromatography Photodiode Array Detection-Electrospray Mass Spectrometry. J. Chromatogr. A. 2003 (986) 73-81.
- Pellati, F., Benvenuti, S., Melegari, M., Lasseigne, T. Variability in the Composition of Antioxidant Compounds in Echinacea Species by HPLC. Phytochem. Anal. 2005 (16) 77-85.
- Thygesen, L., Thulin, J., Mortenson, A., Skibsted, L.H., Molgaard, P. Antioxidant Activity of Cichoric Acid and Alkamides from Echinacea Purpurea, Alone and in Combination. Food Chem. 2007 (101) 74-81.
- Luo, X., Chen, B., Yao, S., Zeng, J. Simultaneous Analysis of Caffeic Acid Derivatives and Alkamides in Roots and Extracts of Echinacea Purpurea by High-Performance Liquid Chromatography Photodiode Array Detection-Electrospray Mass Spectrometry. J. Chromatogr. A. 2003 (986) 73-81.
- Jablonski, J., Wheat, T., Diehl, D. Developing Focused Gradients for Isolation and Purification. Waters Application Note 720002955, 2009 September.
- DeLano, M., et al. Anal. Chem., 2021, 93, 5773-5781. https://doi.org/10.1021/acs.analchem.0c05203
- Jablonski, J. Applying the 5 Rules of Scale Up in LC Purification. Waters Corporation; Article: 720008481, 2024.
- Bridging the Performance Gap from Analytical to Prep. Waters Corporation; Wall Chart: 720002117, 2023.
- Guidance for First Time Purification Success for Your Precious Targets. Waters Corporation; Infographic: 720008209, 2024.
- Van Deemter, J., Zuidermeg, F., Klinkenberg, A. Longitudinal Diffusion and Resistance to Mass Transfer as Causes of Nonideality in Chromatography, Chem. Eng. Sci., 1956, Vol 5, p. 271-289.
- Neue, U. HPLC Columns: Theory, Technology and Practice, 1997, Wiley-VCH, Inc., ISBN 0-471-19037-3; p. 17-23.
720009339, May 2026