
HILIC Analysis of Free Inositol Stereoisomers in Dietary Supplements: Evaluating CAD, ELSD, and ACQUITY QDa II Mass Detector for Routine Quantitative Analysis
Jinchuan Yang, Stephanie Harden, Paul Rainville
Waters Corporation, United States
Published on October 06, 2026

Abstract
Mass spectrometry (MS), evaporative light scattering detection (ELSD), and charged aerosol detection (CAD) are common detection techniques for the liquid chromatographic (LC) analysis of carbohydrates, which typically lack strong UV chromophores and therefore unsuitable for UV or fluorescence detection. Each of these detection techniques may offer distinct advantages in analytical performance, including sensitivity, dynamic range, selectivity, and sample preparation requirements for routine quantitative workflows.
In this study, an ACQUITY™ QDa™ II Mass Detector, a Waters ELSD, and a Waters CAD were evaluated for the determination of free inositol stereoisomers in dietary supplements using hydrophilic interaction liquid chromatography (HILIC). Detector performance, obtained under their respective optimized conditions, was compared in terms of sensitivity, working concentration range, linearity, precision, and practical workflow considerations.
The results demonstrated that the ACQUITY QDa II Mass Detector provided substantially higher sensitivity than the Waters CAD and ELSD. The limits of quantitation (LOQs) obtained for allo-, epi-, D-chiro-, myo-, and scyllo-inositol ranged from 0.09 to 0.9 µg/mL with the ACQUITY QDa II Mass Detector, compared with 17 to 21 µg/mL for the Waters CAD and 25 to 41 µg/mL for the ELSD. The ACQUITY QDa II Mass Detector also exhibited the broadest dynamic range, enabling simultaneous quantitation of D-chiro-inositol and myo-inositol in a single analysis despite approximately 40-fold differences in concentration. In contrast, separate sample dilutions were required for the Waters CAD and ELSD.
All three detectors demonstrated excellent linearity (R² >0.996) and provided accurate quantitation of inositol stereoisomers in dietary supplement products. Quantitative results of four commercial dietary supplement samples from these three detectors were in close agreement, with measured myo-inositol and D-chiro-inositol contents within ±7% of overall mean values. These findings demonstrate that each detector can provide reliable quantitative results, while offering different advantages for routine dietary supplement analysis. The ACQUITY QDa II Mass Detector is particularly well suited for applications requiring maximum sensitivity and dynamic range, whereas the Waters CAD and ELSD provide universal detection approaches for routine analysis of non-UV-absorbing compounds, with the Waters CAD offering improved sensitivity relative to the ELSD.
Benefits
- Demonstrates the relative strengths of ACQUITY QDa II Mass Detector, Waters CAD, and ELSD for carbohydrate HILIC analysis, helping laboratories select the most appropriate detector for their analytical needs
- Shows that ACQUITY QDa II Mass Detector provides the highest sensitivity and broadest dynamic range, making it well suited for analytes of wide concentration ranges
- Illustrates how Waters CAD delivers strong sensitivity and near-universal detection for non-volatile analytes while supporting straightforward implementation for routine quantitative workflows
Introduction
CAD is considered a quasi-universal detector for LC because it can detect virtually any analyte that is less volatile than the mobile phase. It serves as a valuable complement to UV detection, as many analytes lack UV chromophores. Similarly, the ELSD is well suited for the analysis of compounds with weak or no UV absorption. Both CAD and ELSD operate by nebulizing the eluent, evaporating the volatile mobile phase, and generating analyte-containing aerosol particles. The two detectors differ in their detection mechanisms: in CAD, aerosol particles are charged by ionized gas molecules and measured with an electrometer, whereas in ELSD, particles are detected through light scattering. MS is another widely used detection technique for non-UV-absorbing analytes, provided they can be ionized under LC-MS conditions. MS is also highly selective. Advances in MS technology have significantly improved instrument affordability, ease of use, and robustness, making MS increasingly accessible for routine analytical applications.
A HILIC method for the determination of inositol stereoisomers in dietary supplements has been reported.1,2 In this study, the analytical performance of a Waters CAD, Waters ELSD, and ACQUITY QDa II Mass Detector was compared for the determination of free inositol stereoisomers in dietary supplements. Following systematic optimization of each detector, their performance was evaluated based on sensitivity, working concentration range, linearity, and precision using standards and commercially available dietary supplement products.
Experimental
Chemicals and Standards
The details of chemicals and standards have been reported previously.1,2
Sample Preparation
Detailed sample preparation procedures have been described previously.1,2 Briefly, the contents of dietary supplement capsules were weighed and dissolved in water to prepare sample stock solutions at concentrations of 3-4 mg/mL. For analyses using the ELSD and CAD, the sample stock solutions were filtered through a 0.45 µm PVDF syringe membrane filter (p/n: WAT200827, Waters). These filtered solutions were directly used for the analysis of D-chiro-inositol, which is typically present at approximately 50 mg per serving. For the determination of myo-inositol, which is typically present at much higher levels (approximately 2000 mg per serving), the filtered sample stock solutions were further diluted 20-fold by mixing 50 µL of sample solution with 950 µL of water.
For analysis using the ACQUITY QDa II Mass Detector, the sample stock solutions were diluted ten-fold with water to prepare Sample Intermediate I Solutions, which were subsequently diluted as an additional ten-fold to obtain Sample Intermediate II Solutions. The Sample Intermediate II Solutions were filtered through a 0.45 µm PVDF syringe membrane filter. Final sample solutions were prepared by combining 50 µL of filtered Sample Intermediate II Solution, 5 µL of internal standard stock solution (myo-inositol-d₆, 1 mg/mL), and 445 µL of water in 1.5 mL Max Recovery Glass Vials (p/n: 186000327C, Waters), for the determination of D-chiro-inositol and myo-inositol when using the ACQUITY QDa II Mass Detector.
LC Instrument and Conditions
|
System: |
Arc™ Premier System equipped with a Quaternary Solvent Manager (QSM-R), Sample Manager (FTN-R), Column Manager, and coupled with Waters CAD, ELSD,3 and ACQUITY QDa II Mass Detector |
|
Software: |
Empower™ 3 Chromatography Data System (CDS) |
|
Column: |
ACQUITY UPLC™ BEH™ Amide Column, 1.7 µm, 2.1 mm × 150 mm (p/n: 186004802) |
|
Column temperature: |
25 °C |
|
Run time: |
23 minutes |
|
Mobile phase A: |
Acetonitrile:water (90:10 v/v) with 0.01% NH4OH |
|
Mobile phase B: |
Acetonitrile:water (50:50 v/v) with 0.01% NH4OH (and 20 mM ammonium formate when ACQUITY QDa II Mass Detector was used) |
|
Sample manager purge: |
Acetonitrile:water (50:50, v/v) |
|
Flow rate: |
0.35 mL/min. |
|
Injection volume: |
2 µL |
Gradient Elution Program
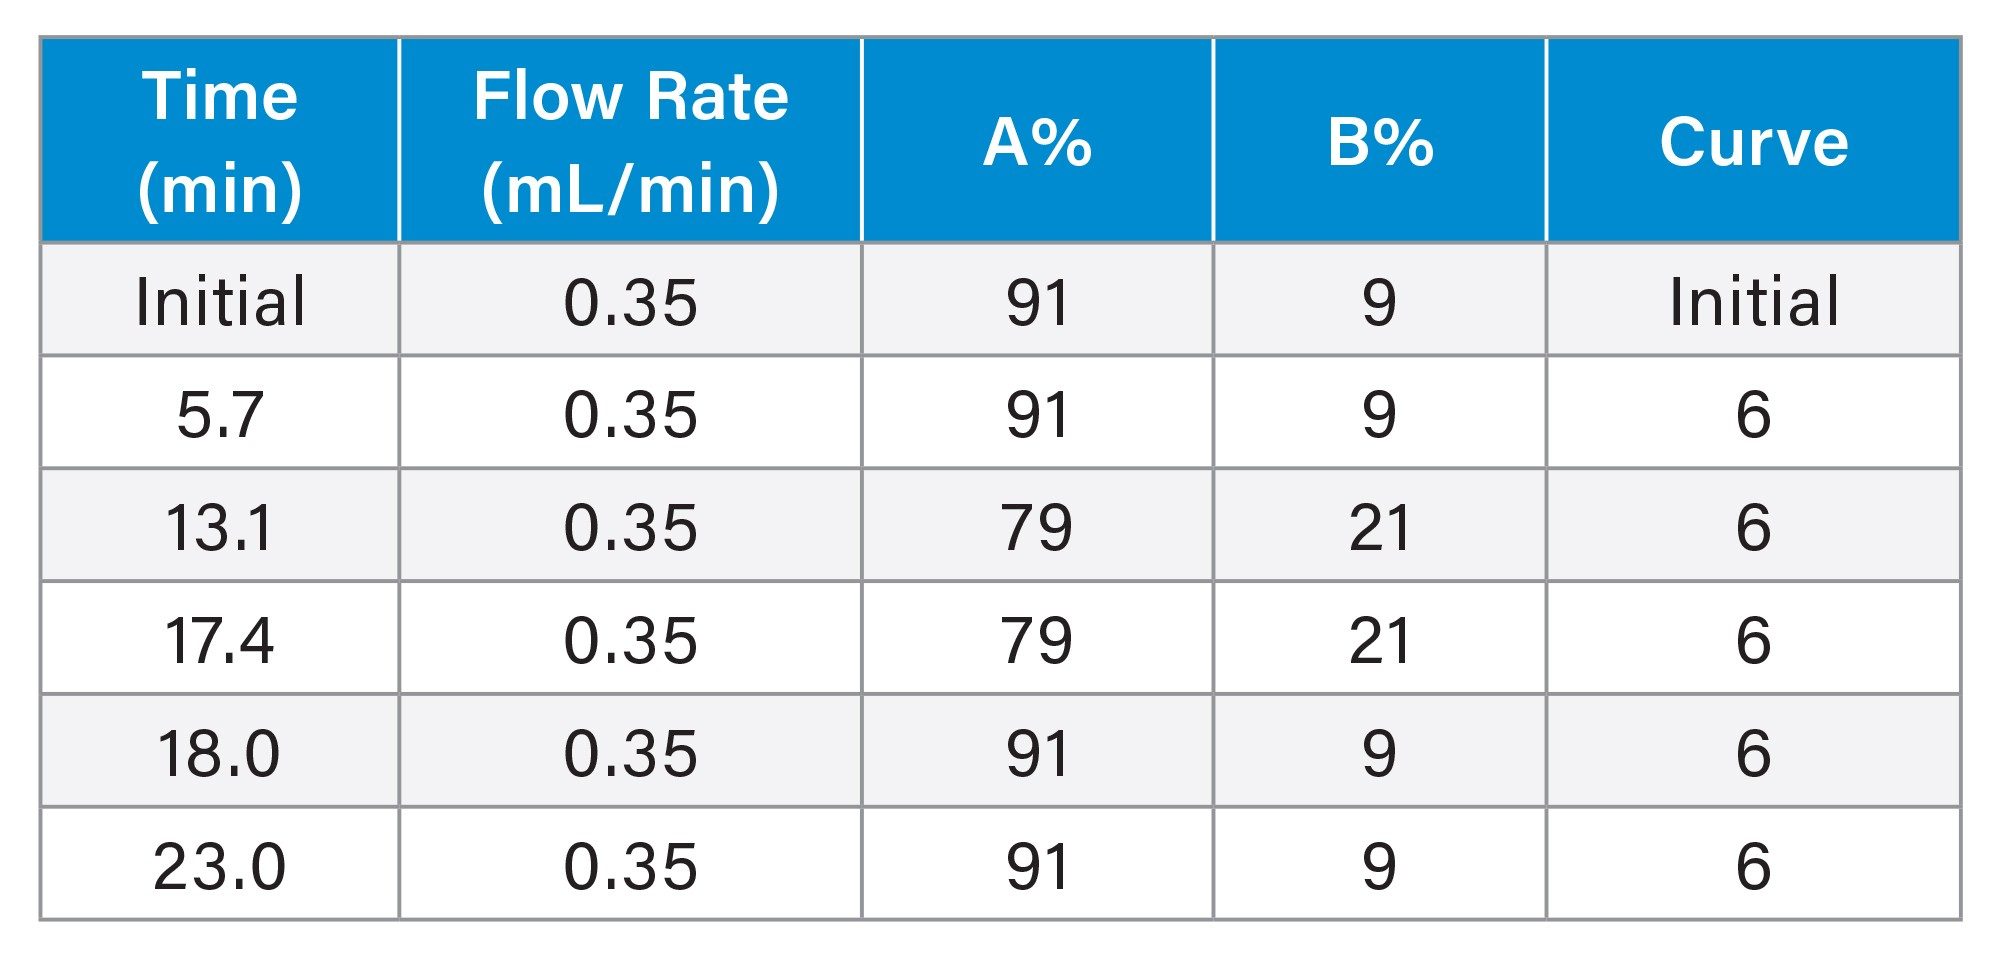
ACQUITY UPLC ELSD Parameters
|
Gas pressure: |
40 psi |
|
Nebulizer mode: |
Heating (100% power level) |
|
Drift tube temperature: |
90 oC |
|
Gain: |
10 |
Waters CAD Parameters
|
Gas pressure: |
40 psi (Adjustable in ACQUITY System Consol) |
|
Power function value: |
1 |
|
Ion trap voltage: |
600 V (in Advanced Setting) |
|
Evaporator temperature: |
95 °C |
|
Nebulizer heating: |
100% |
|
Sample rate: |
10 Hz |
|
Filter time constant: |
Normal (0.2 sec) |
|
Divert valve setting: |
Waste/Divert |
Timed Events
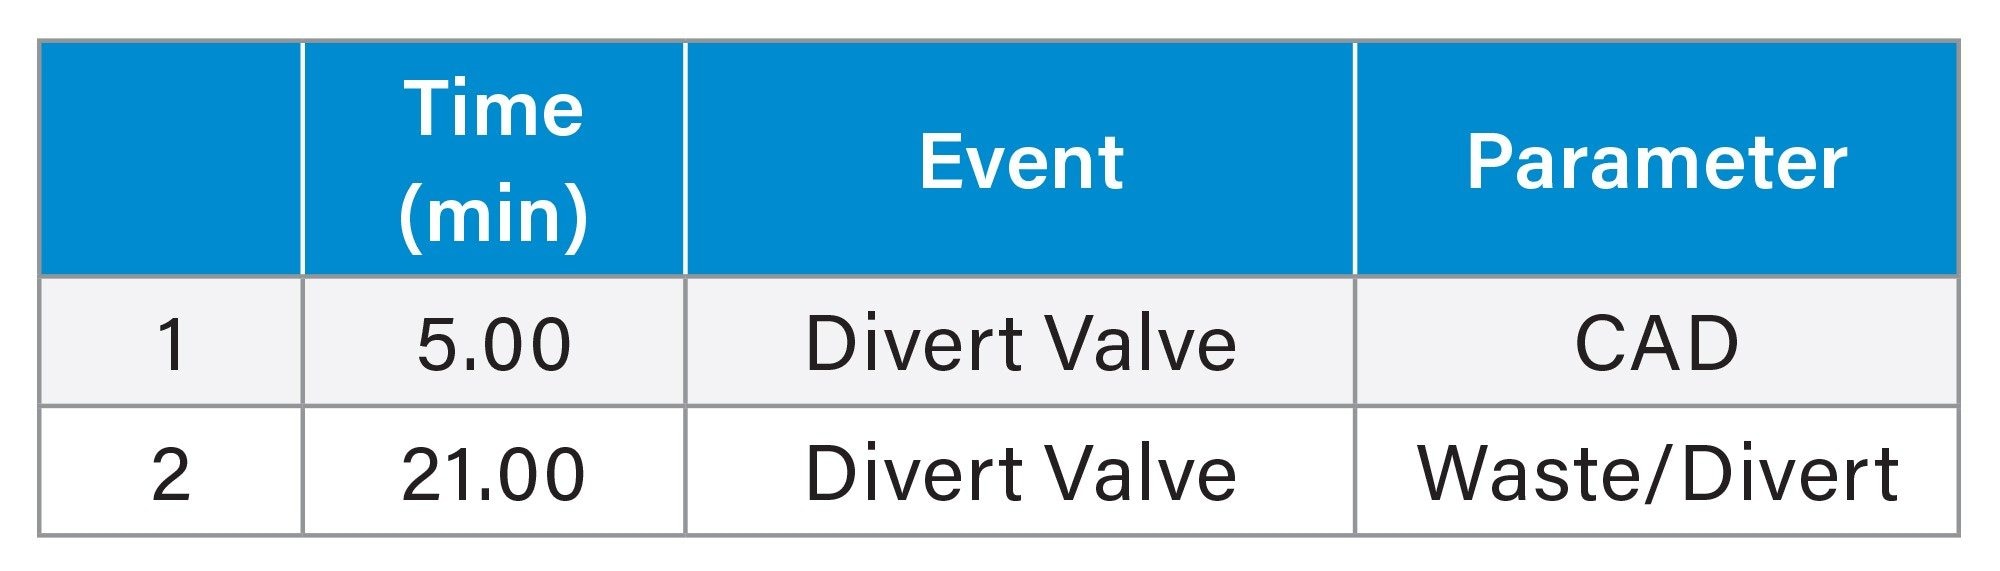
ACQUITY QDa II Mass Detector Parameters
|
Ionization mode: |
ESI- |
|
|
Capillary voltage: |
0.5 kV |
|
|
Probe temp.: |
600 °C |
|
|
Cone voltage: |
7.0 V |
|
|
Sampling rate: |
5 Hz |
|
|
SIR [M]-: |
179 Da (for analytes) and 185 Da (for ISTD) |
Results and Discussion
Detection Optimization
The operating parameters of the ACQUITY QDa II Mass Detector and Waters CAD had been previously optimized for maximum signal-to-noise ratio (S/N) and were used in this study.1,2 For the Waters ELSD, gas pressure and drift tube temperature were systematically optimized in this study. The highest S/N was obtained at a gas pressure of 40 psi and a drift tube temperature of 90 °C within the investigated ranges of 35-60 psi and 50-100 °C, respectively (data not shown). These optimized conditions were used in the comparison study.
Analytical Performance of Various Detectors
The analytical performance of the Waters ELSD, CAD and ACQUITY QDa II Mass Detector for the HILIC analysis of free inositols in dietary supplements was evaluated and compared in terms of sensitivity, working concentration ranges, linearity, and precision (repeatability).
Detector responses were calibrated using least-squares regression with a quadratic (or 2nd order polynomial) model. Although the power-law model was also commonly used to calibrate these detectors, the power-law and the quadratic models for the Waters CAD were compared and it was found out that the quadratic model provided a more accurate fit of detector response versus analyte concentration for the HILIC analysis of inositol based on R2 values in calibration plots and relative errors in residual plots.2 Therefore, quadratic regression was used to calibrate the responses (peak area) of all three detectors in this study.
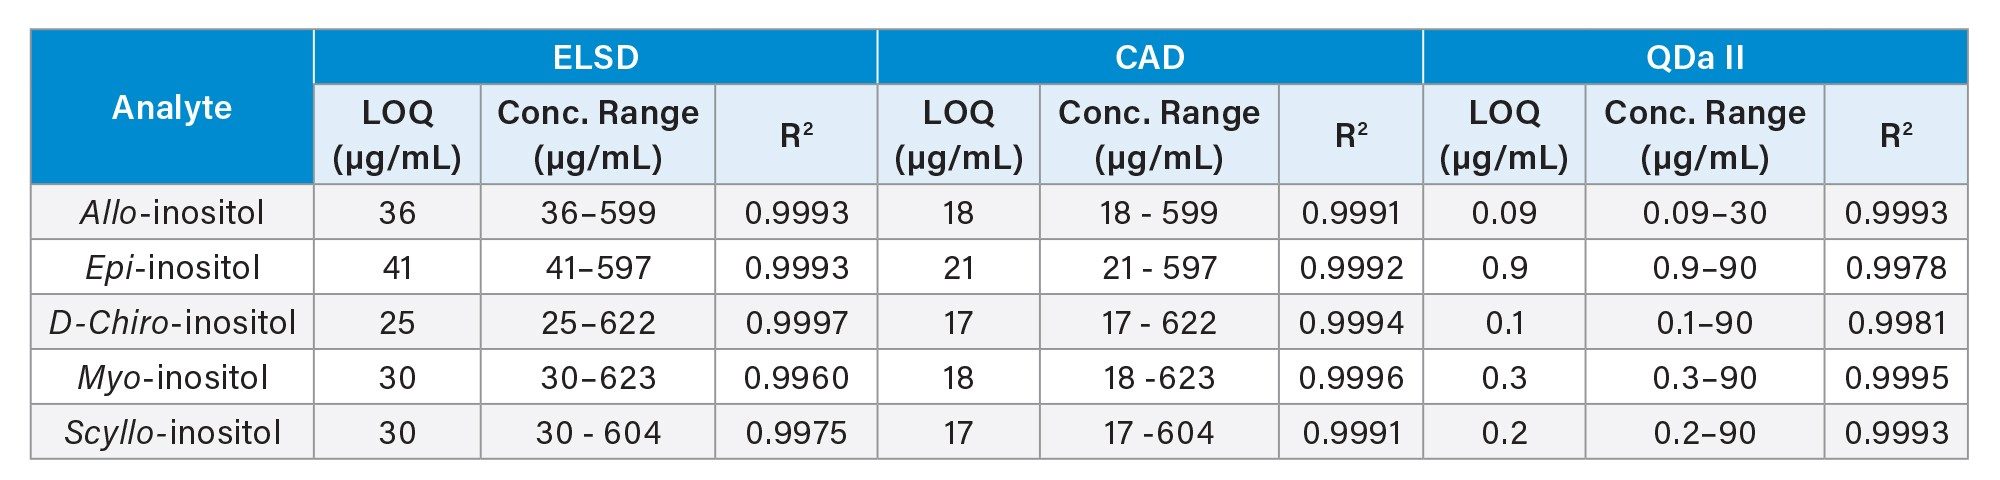
Table 1 summarizes the LOQs, working concentration ranges, and R2 values for inositol stereoisomers obtained using Waters ELSD, CAD, and ACQUITY QDa II Mass Detector. LOQs were estimated at concentrations corresponding to a S/N of 10. Among these three detectors, the ACQUITY QDa II Mass Detector delivered the highest sensitivity, with LOQs ranging from 0.09 to 0.9 µg/mL, compared with 17 to 21 µg/mL for the Waters CAD and 25 to 41 µg/mL for the ELSD. Between CAD and ELSD, the CAD exhibited superior sensitivity, demonstrating lower LOQs (about half) than those of the ELSD across the inositol stereoisomers evaluated.
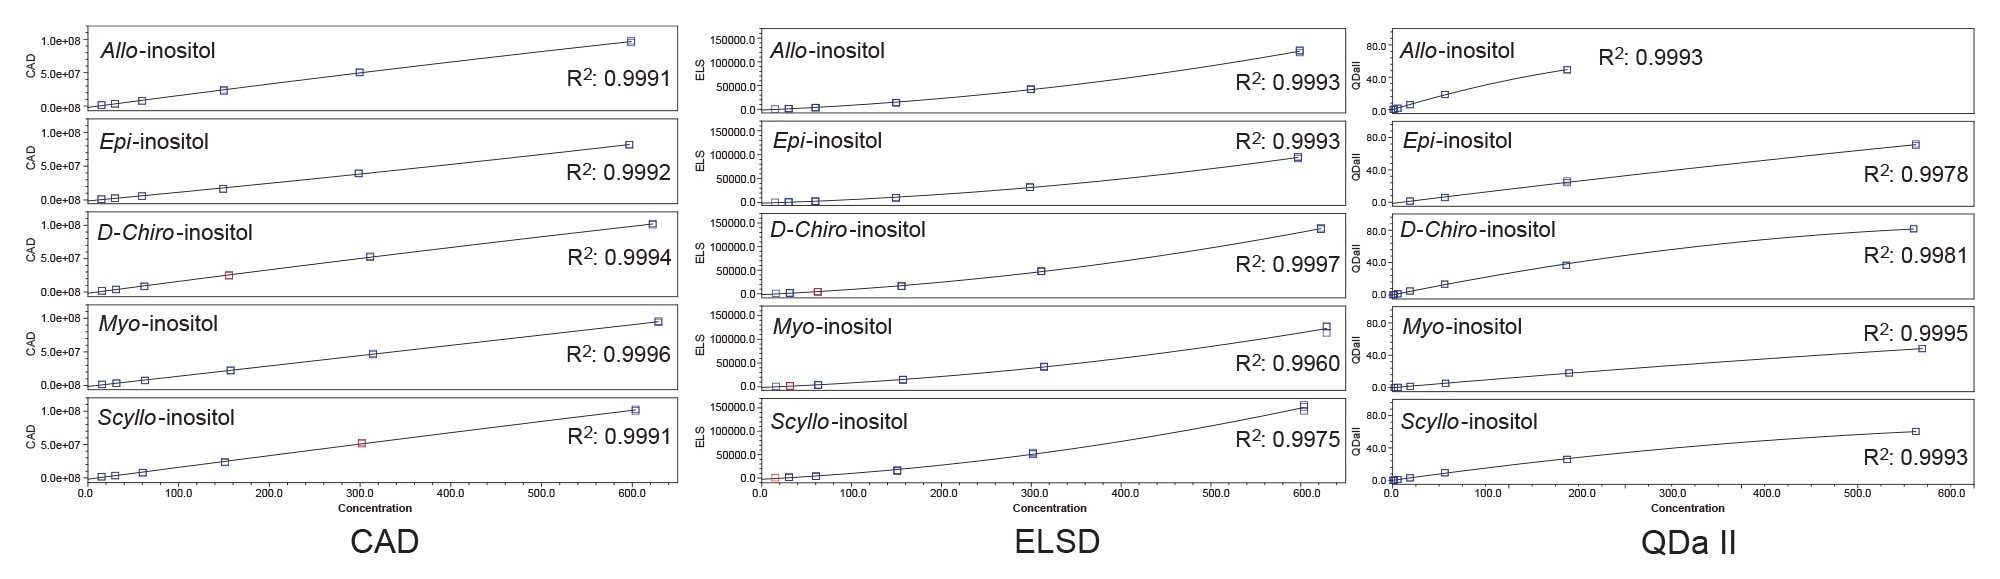
Table 1 also shows that the upper limits of the working concentration range were similar for the ELSD and CAD, ranging from 599 to 623 µg/mL. At concentrations above these limits, peak shape deterioration (asymmetric peak) was observed, likely due to the loading capacity limitations of the HILIC Column. For the ACQUITY QDa II Mass Detector, the upper calibration limit was 90 µg/mL for epi-, D-chiro-, myo-, and scyllo-inositol, and 30 µg/mL for allo-inositol. Beyond these concentrations, the relative errors of fitted calibration data became large (>10%) and unacceptable. ACQUITY QDa II Mass Detector also exhibited the broadest dynamic range (ratio of the upper to lower limits of the calibration range) among these detectors. Excellent linearity was obtained with all three detectors, with R2 values exceeding 0.996. Representative calibration curves for the inositol stereoisomers from these detectors are shown in Figure 1.
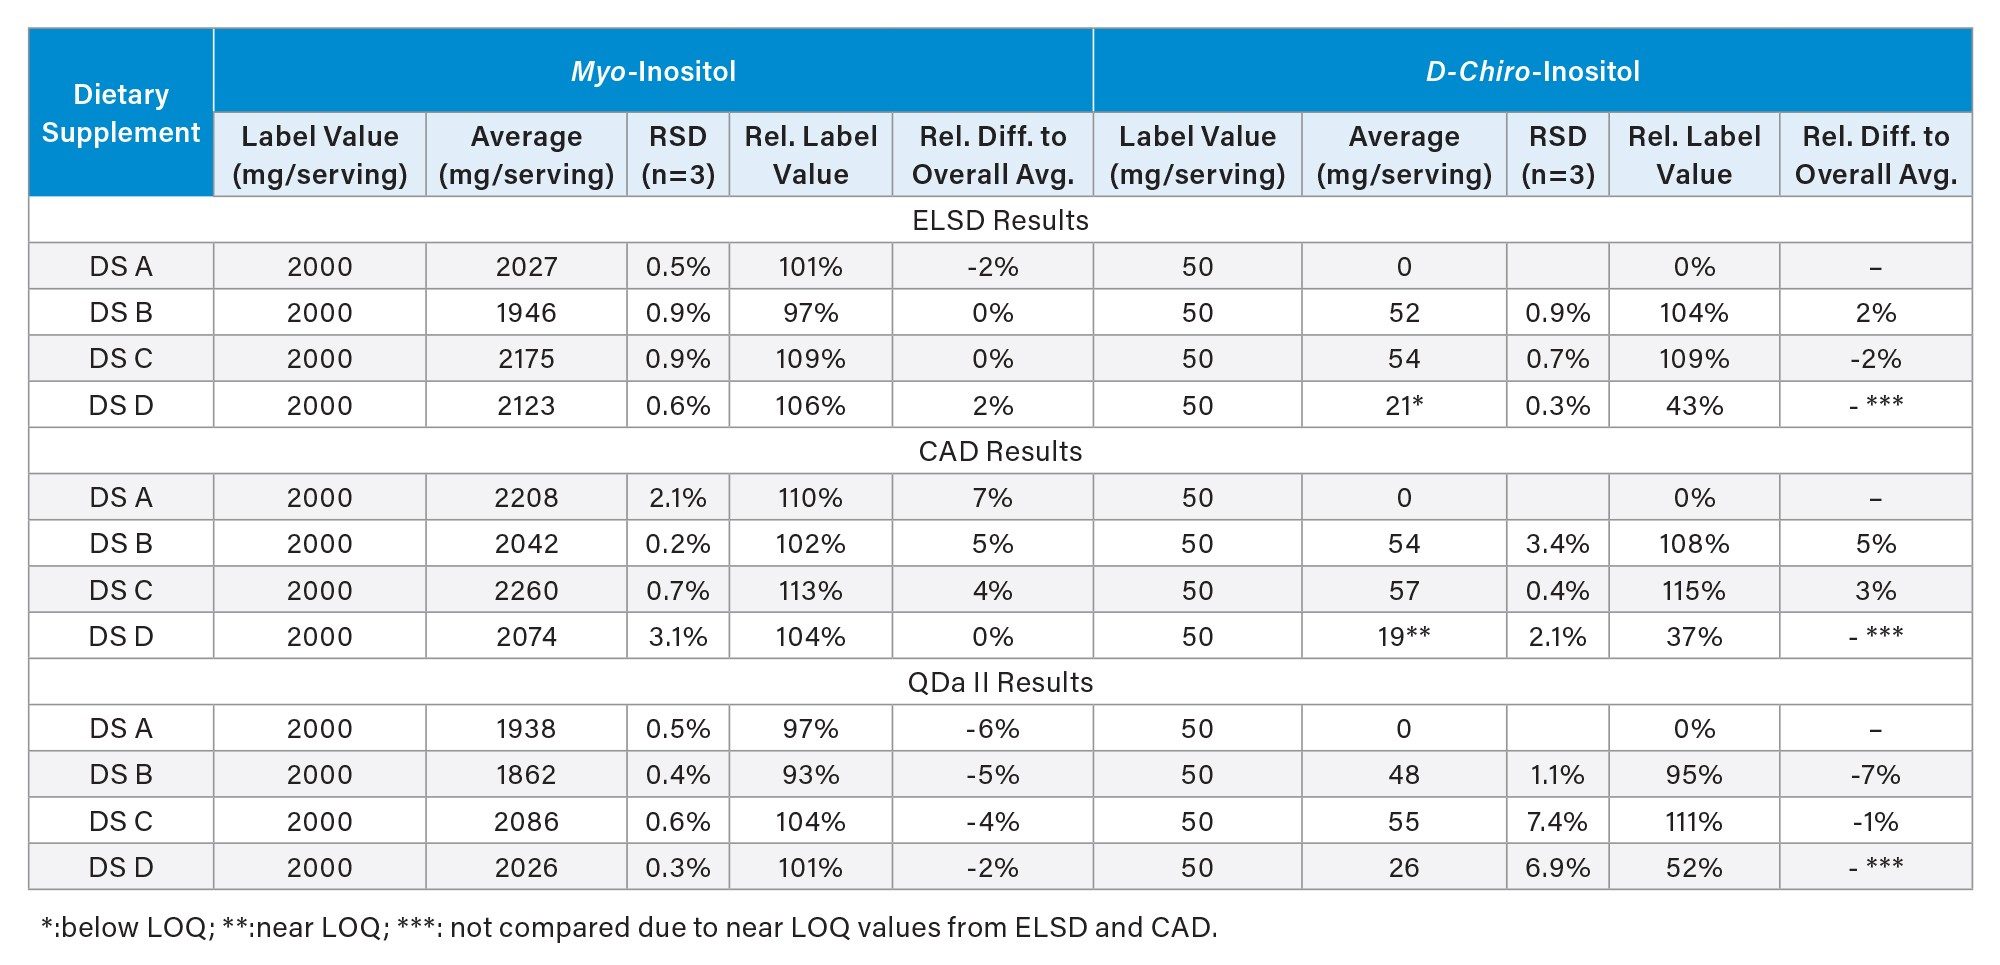
Commercially available supplements were analyzed using the HILIC method on an Arc Premier System coupled separately with the Waters ELSD, CAD and ACQUITY QDa II Mass Detector. Samples were prepared separately for each detector. The mean myo- and D-chiro-inositol results, relative standard deviations (RSD, inter-day, n = 3), relative to label claims, and relative differences from the overall mean value (across three detectors’ results) are summarized in Table 2. The RSDs for myo-inositol and D-chiro-inositol quantitation ranged from 0.5% to 0.9% and 0.3% to 0.9%, respectively, with the Waters ELSD; 0.2% to 3.1% and 0.4% to 3.4%, respectively, with the Waters CAD; and 0.3% to 0.6% and 1.1% to 7.4%, respectively, with the ACQUITY QDa II Mass Detector. Please note that for the ACQUITY QDa II Mass Detector, an internal standard myo-inositol-d6 was used in quantitation of both myo- and D-chiro-inositol. There was no commercially available isotope labeled chiro-inositol to use, which might contribute to a relatively high RSD observed for D-chiro-inositol by ACQUITY QDa II Mass Detector.
From the myo-inositol precision results, both the ACQUITY QDa II Mass Detector and Waters ELSD demonstrated excellent precision, with RSDs not exceeding 0.9%, while the Waters CAD provided satisfactory precision, with RSDs not exceeding 3.1%. Good agreement was observed among the three detectors, with relative differences from the overall means ranging from -7% to 7% for both analytes. (The D-chiro-inositol contents in sample DS D solutions were below the LOQ for ELSD measurement and near the LOQ for CAD measurement, therefore, these results were not used in comparison.)
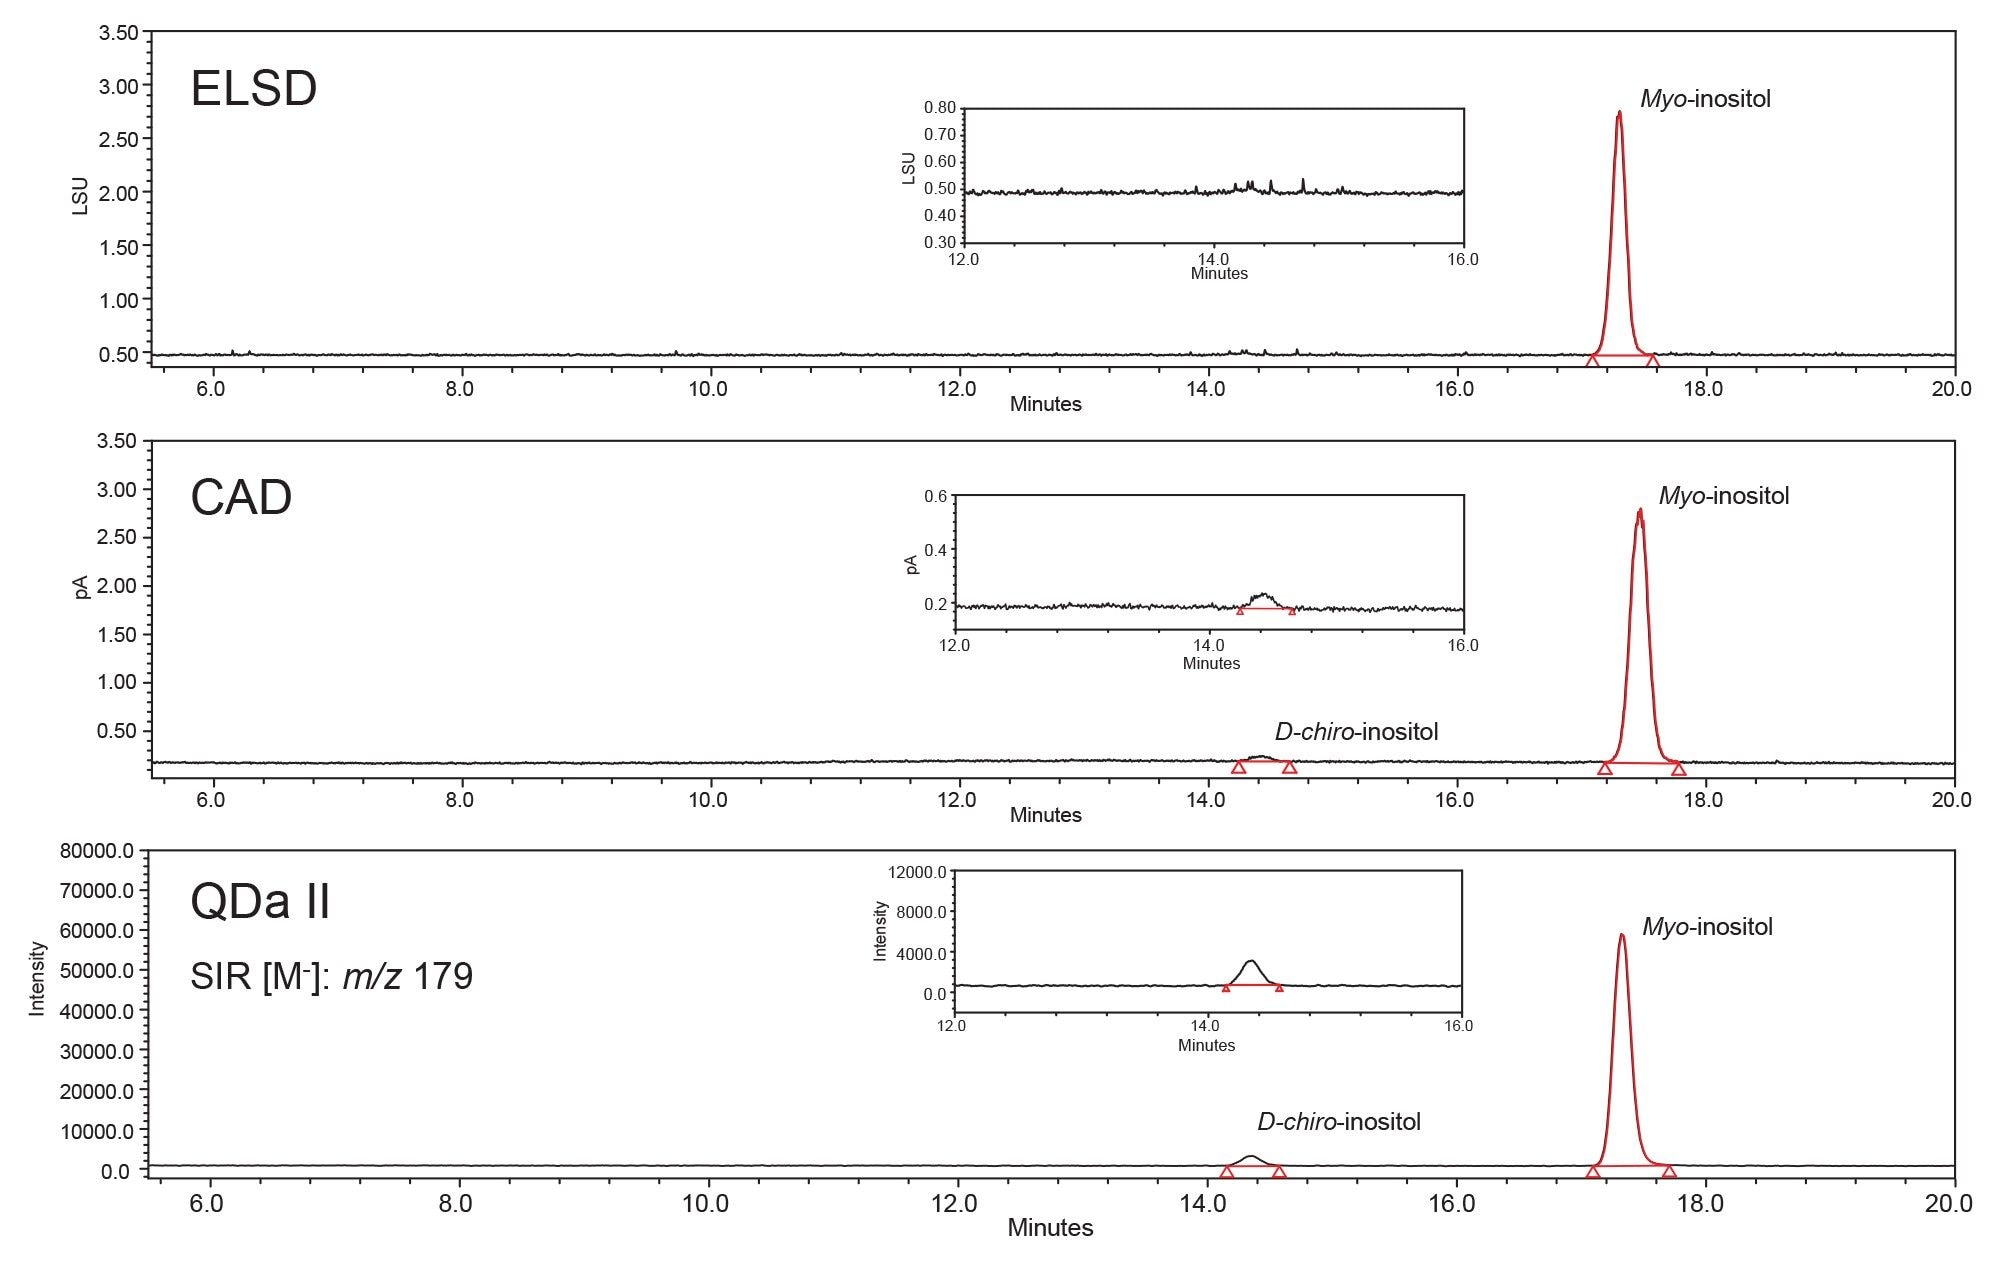
Figure 2 shows chromatograms of a dietary supplement sample (DS D) acquired by the Waters ELSD, CAD, and ACQUITY QDa II Mass Detector. Less diluted sample solutions were analyzed by the ELSD and CAD detection (sample concentrations were approximately 200 µg/mL), whereas a more diluted sample solution was analyzed by the ACQUITY QDa II Mass Detector (approximately 4 µg/mL). As shown in these chromatograms, D-chiro-inositol was not detected by the ELSD and was detected by the CAD but at a level below its LOQ. In contrast, the ACQUITY QDa II Mass Detector provided sufficient sensitivity to quantify D-chiro-inositol while simultaneously quantifying the much more abundant myo-inositol. The broader dynamic range of the ACQUITY QDa II Mass Detector enabled both analytes to be quantified in a single run. By comparison, ELSD and CAD required separate runs at different sample dilution levels to quantify D-chiro-inositol and myo-inositol accurately (see Experimental section). It was also observed that the ELSD was prone to the sharp spiking noise issue,4 while the CAD was not likely to have this issue (data not shown).
Summary
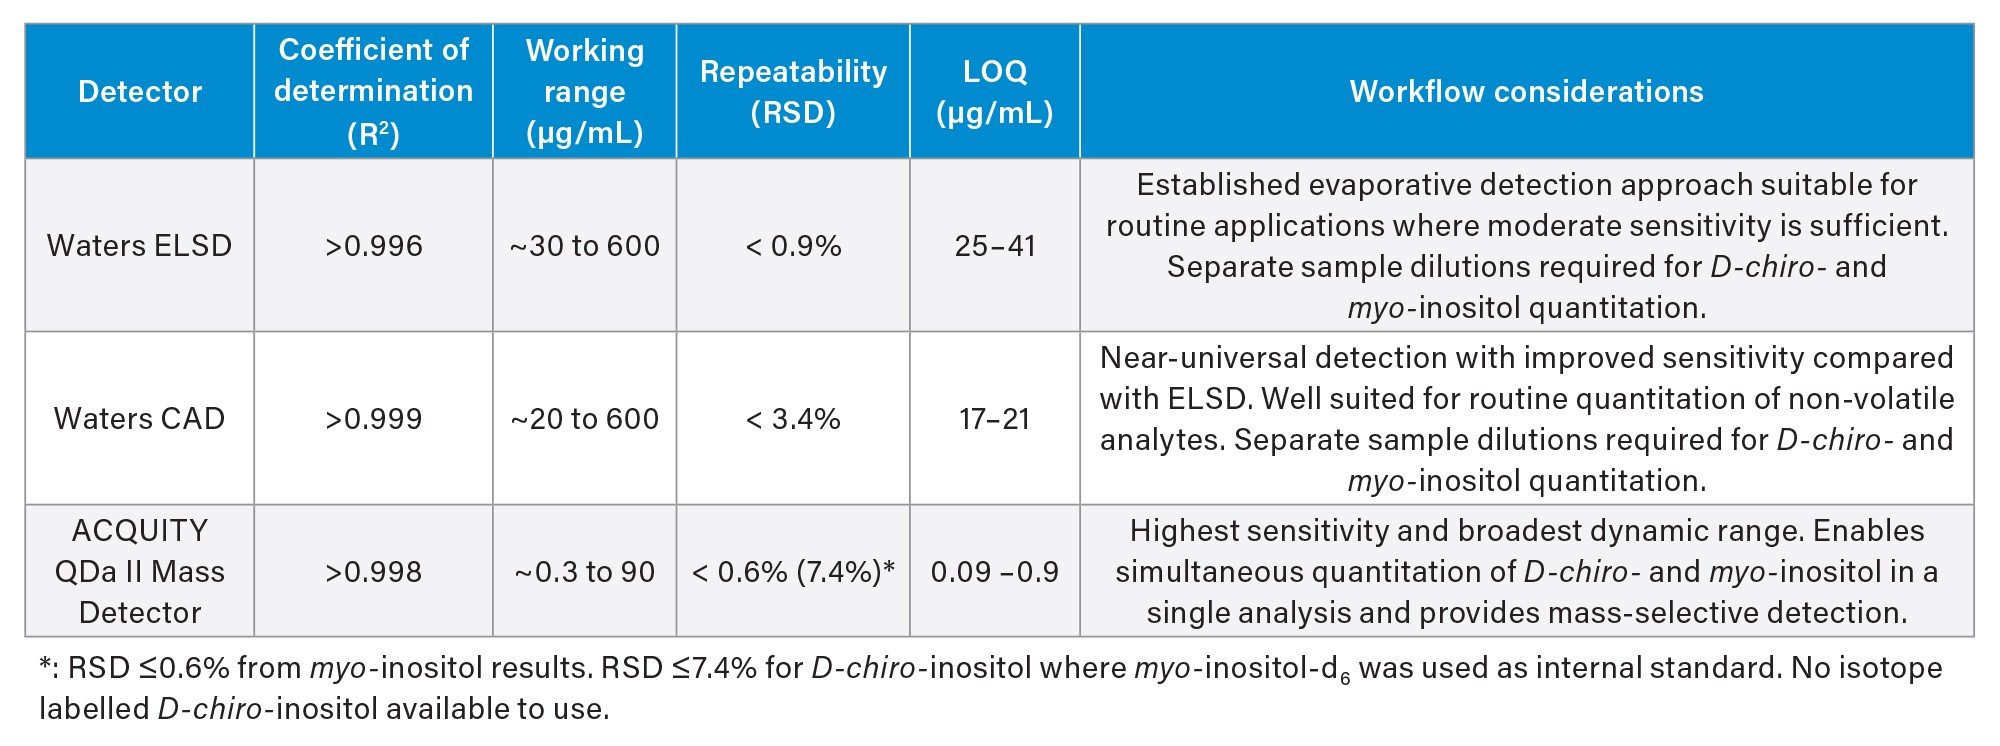
Table 3 summarizes the analytical performance and practical workflow considerations for HILIC analysis of inositol stereoisomers using the Waters ELSD, CAD, and ACQUITY QDa II Mass Detector.
The results demonstrate that each detector offers distinct advantages. The ACQUITY QDa II Mass Detector provided the highest sensitivity, with LOQs below 1 µg/mL, making it well suited for applications requiring low level quantitation, broad dynamic range, or additional confidence in specificity through mass-selective detection. In comparison, the Waters CAD and ELSD provided LOQs in the 20–40 µg/mL range, which are sufficient for many routine testing where analytes are present at higher concentrations. Among the two universal detectors evaluated, the Waters CAD consistently delivered greater sensitivity than the ELSD, with LOQs approximately two-fold lower.
All three detectors demonstrated excellent calibration performance (R² >0.996), while the Waters CAD exhibited particularly strong calibration linearity, with R² values exceeding 0.999 for all analytes.
The ACQUITY QDa II Mass Detector also provided the broadest dynamic range, enabling simultaneous quantitation of low-level D-chiro-inositol and high-level myo-inositol in a single analysis. This capability simplified sample preparation by eliminating the need for multiple sample preparations. In contrast, the Waters ELSD and CAD required separate sample preparations to quantify both analytes within their respective working ranges. Laboratories analyzing samples containing components across a wide concentration range may therefore benefit from the expanded dynamic range offered by mass detection.
All three detectors demonstrated suitable precision for quantitative analysis. The Waters ELSD and ACQUITY QDa II Mass Detector provided excellent repeatability, with RSD values not exceeding 0.9% (myo-inositol data), while the Waters CAD achieved repeatability not exceeding 3.4%, supporting their use for routine quantitative workflows. Quantitative results obtained across all three detector platforms were in close agreement, indicating that each can provide reliable determinations of free inositol stereoisomers. The relative differences in sensitivity and precision observed between the Waters ELSD and CAD were consistent with previous reports describing the performance of these detectors for carbohydrate analysis.5
Conclusion
The Waters ELSD, CAD, and ACQUITY QDa II Mass Detector each provided accurate and reproducible quantitation of inositol stereoisomers under HILIC conditions, while offering different advantages for dietary supplement analysis.
The ACQUITY QDa II Mass Detector delivered the highest sensitivity and broadest dynamic range, making it particularly well suited for applications requiring low-level quantitation, the analysis of components present across a wide concentration range, or the additional confidence provided by mass-selective detection.
The Waters CAD provided greater sensitivity than the ELSD while maintaining the benefits of near-universal detection for non-volatile analytes. Its combination of quantitative performance and ease of implementation makes it a strong choice for laboratories seeking a sensitive alternative detection technique without the added complexity of mass spectrometry.
Overall, this study demonstrates that all three detector technologies can provide reliable quantitative results for inositol analysis, while offering laboratories the flexibility to select the detector that best aligns with their analytical requirements, workflow preferences, and application needs.
References
- Yang, J.; Harden, S.; Rainville, P. (2025). Analysis of Free Inositol Stereoisomers in Dietary Supplements by Hydrophilic Liquid Chromatography using the Arc Premier System and ACQUITY QDa II Mass Detector, Waters. 720009186.
- Yang, J.; Harden, S.; Rainville, P. (2026). Analysis of Free Inositol Stereoisomers in Dietary Supplements by HILIC-CAD: Detection Optimization and Analytical Performance Evaluation, Waters. 720009478.
- ACQUITY ELSD was used.
- Young, C.S.; Dolan, J.W. (2003). Success with Evaporative Light-Scattering Detection, LC•GC North America, 21, 120.
- Márquez-Sillero, I.; Cárdenas, S.; Valcárcel, M. (2013). Comparison of Two Evaporative Universal Detectors for the Determination of Sugars in Food Samples by Liquid Chromatography. Microchemical Journal, 110, 629–635. https://doi.org/10.1016/j.microc.2013.07.008
ACQUITY, Arc, BEH, Empower, QDa, UPLC, Waters are trademarks of Waters Corporation or its affiliates.
720009609, October 2026


