

For research use only. Not for use in diagnostic procedures.
- Main
-
For research use only. Not for use in diagnostic procedures.
Emily Christofi
Waters Corporation, United Kingdom
Published on November 11, 2026
For research use only. Not for use in diagnostic procedures.
Recombinant adeno-associated virus (AAV) vectors require robust analytical methods to characterize capsid heterogeneity and support product quality assessment. The Xevo™ Charged Detection Mass Spectrometry (CDMS) System enables direct mass measurement and relative quantification of Empty, Partially Filled, Full, and Overfilled [SS1] capsids. The system was evaluated using a 1:1 mixture of Empty and Full AAV8 capsids analyzed over five consecutive days, with 12 replicate injections performed each day. Relative capsid abundances showed less than 2% relative standard deviation (RSD) and remained consistent across two process-relevant concentrations (1 × 10¹¹ and 5 × 10¹² viral particles/mL), representative of upstream and downstream samples. These results demonstrate reproducible capsid population measurements, supporting process development, comparability assessments, and product characterization, while providing analytical confidence in capsid composition measurements.
AAVs are widely used as vectors for gene therapy. AAV particles package a single-stranded DNA genome within a protein capsid and are nonpathogenic, replication-deficient, and available in multiple serotypes, providing flexibility for the development of gene delivery strategies.
A key challenge in AAV manufacturing is achieving consistent encapsulation of the intended genetic material.1,2 Not all capsids assembled contain the complete target genome. AAV preparations can contain Empty capsids as well as particles containing partial, truncated, or otherwise non-functional DNA. Consequently, the final product can comprise a heterogeneous population of Empty, Partially filled, and Full capsids. Variability in these populations can affect the proportion of vector particles carrying the intended genome and may necessitate administration of a higher total particle dose to deliver the required amount of genetic material, potentially increasing the risk of a dangerous immune response to the vector.
Reliable measurement of Empty, Partial, and Full capsid populations provide confidence in process development decisions, enables assessment of product quality and purity, and supports comparability of AAV materials throughout development.
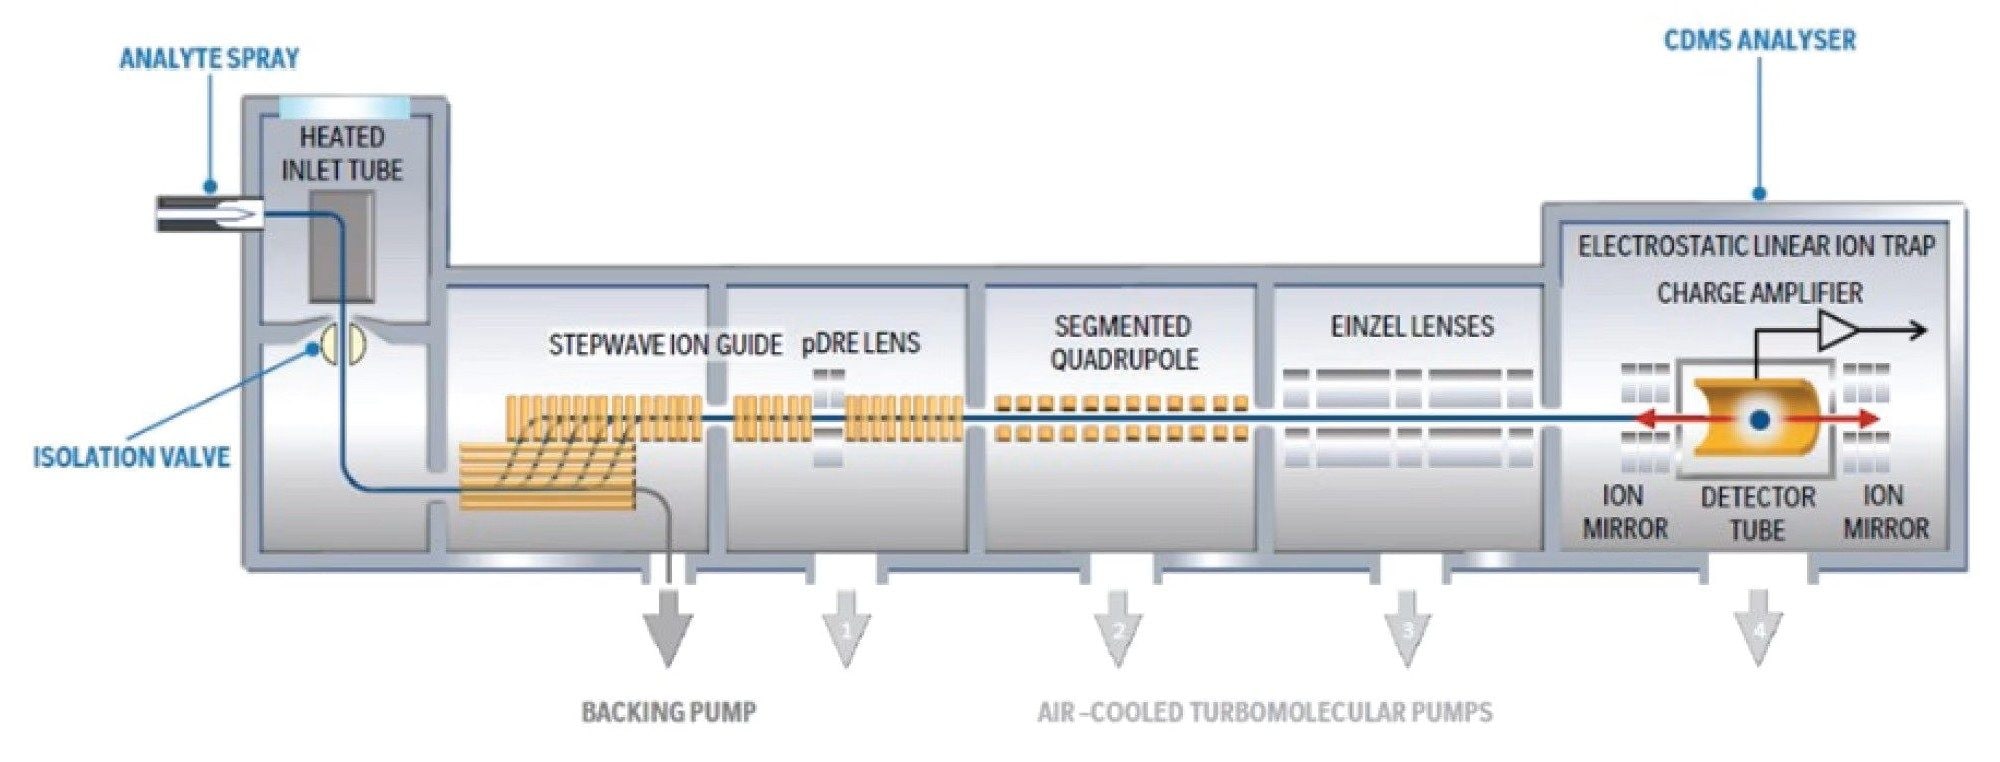
Xevo CDMS System provides a direct approach for characterizing the large and heterogeneous species present in intact AAV preparations. Within the Xevo CDMS System (Figure 1), the electrostatic linear ion trap (ELIT) simultaneously measures the mass-to-charge ratio (m/z) and charge (z) of individual ions. Ion oscillation frequency is used to determine m/z, while the magnitude of the induced signal is proportional to the ion charge, allowing the mass of each ion to be calculated through a simple multiplication between the two properties.
By directly measuring the mass of individual AAV particles, Xevo CDMS System provides a detailed view of capsid heterogeneity and enables Empty, Partial, Full, and other capsid populations to be differentiated based on their mass distributions. The relative abundance of these populations can then be determined from the number of ions detected within each population region.
Here, the analytical repeatability, intermediate precision, and operational robustness of the Xevo CDMS System were evaluated using AAV8 capsids. Two complementary studies were performed. The first assessed performance across 12 injections per day over five consecutive days. The second examined repeatability across alternating upstream and downstream equivalent AAV concentrations to evaluate performance following substantial changes in sample concentration and injection order.
Standard Empty and Full CMV-GFP AAV8 capsids were purchased from third party commercial vendors at a concentration of 2 × 10¹³ viral particles (vp)/mL. The viral titer of the capsids was determined using quantitative polymerase chain reaction (qPCR) or enzyme-linked immunosorbent assay (ELISA) by the supplier. The samples were buffer exchanged into 200 mM aqueous ammonium acetate solution with 0.01 % Pluronic F-68 (Gibco) using Bio-Spin® P-6 size-exclusion columns (Bio-Rad Laboratories).
For the multi-day repeatability and intermediate precision study, Empty and Full capsids were mixed at a 1:1 ratio and diluted to a total AAV concentration of 1 × 10¹³ vp/mL. 12 injections were analyzed per day over five consecutive days.
For the concentration-repeatability study, the same 1:1 Empty/Full mixture was further diluted to 1 × 10¹¹ vp/mL and 5 × 10¹² vp/mL, representing upstream and downstream equivalent process concentrations, respectively. Low and high concentration samples were infused alternately to evaluate the reproducibility of the relative abundance measurements following changes in sample concentration and injection order.
Ions were generated using positive-mode nano-electrospray ionization (nESI) and analyzed using the Xevo CDMS System (Figure 1). Ions were trapped for 100 ms, and acquisition times of approximately 25 minutes were used to collect approximately 5,000 ions per measurement.
Detected time-domain signals were Fourier Transformed (FT) to obtain ion oscillation frequencies and signal magnitudes. These measurements provided m/z and charge, respectively. Data was then binned to produce m/z, charge, and mass histograms, along with two-dimensional heat maps for enhanced visualization. The instrument was controlled using waters_connect™ Software, and the collected ions were processed and visualized using the waters_connect CDMS Toolkit. Relative peak abundances were subsequently used to assess the precision and repeatability of the measurements across individual injections, days, and AAV8 concentrations.
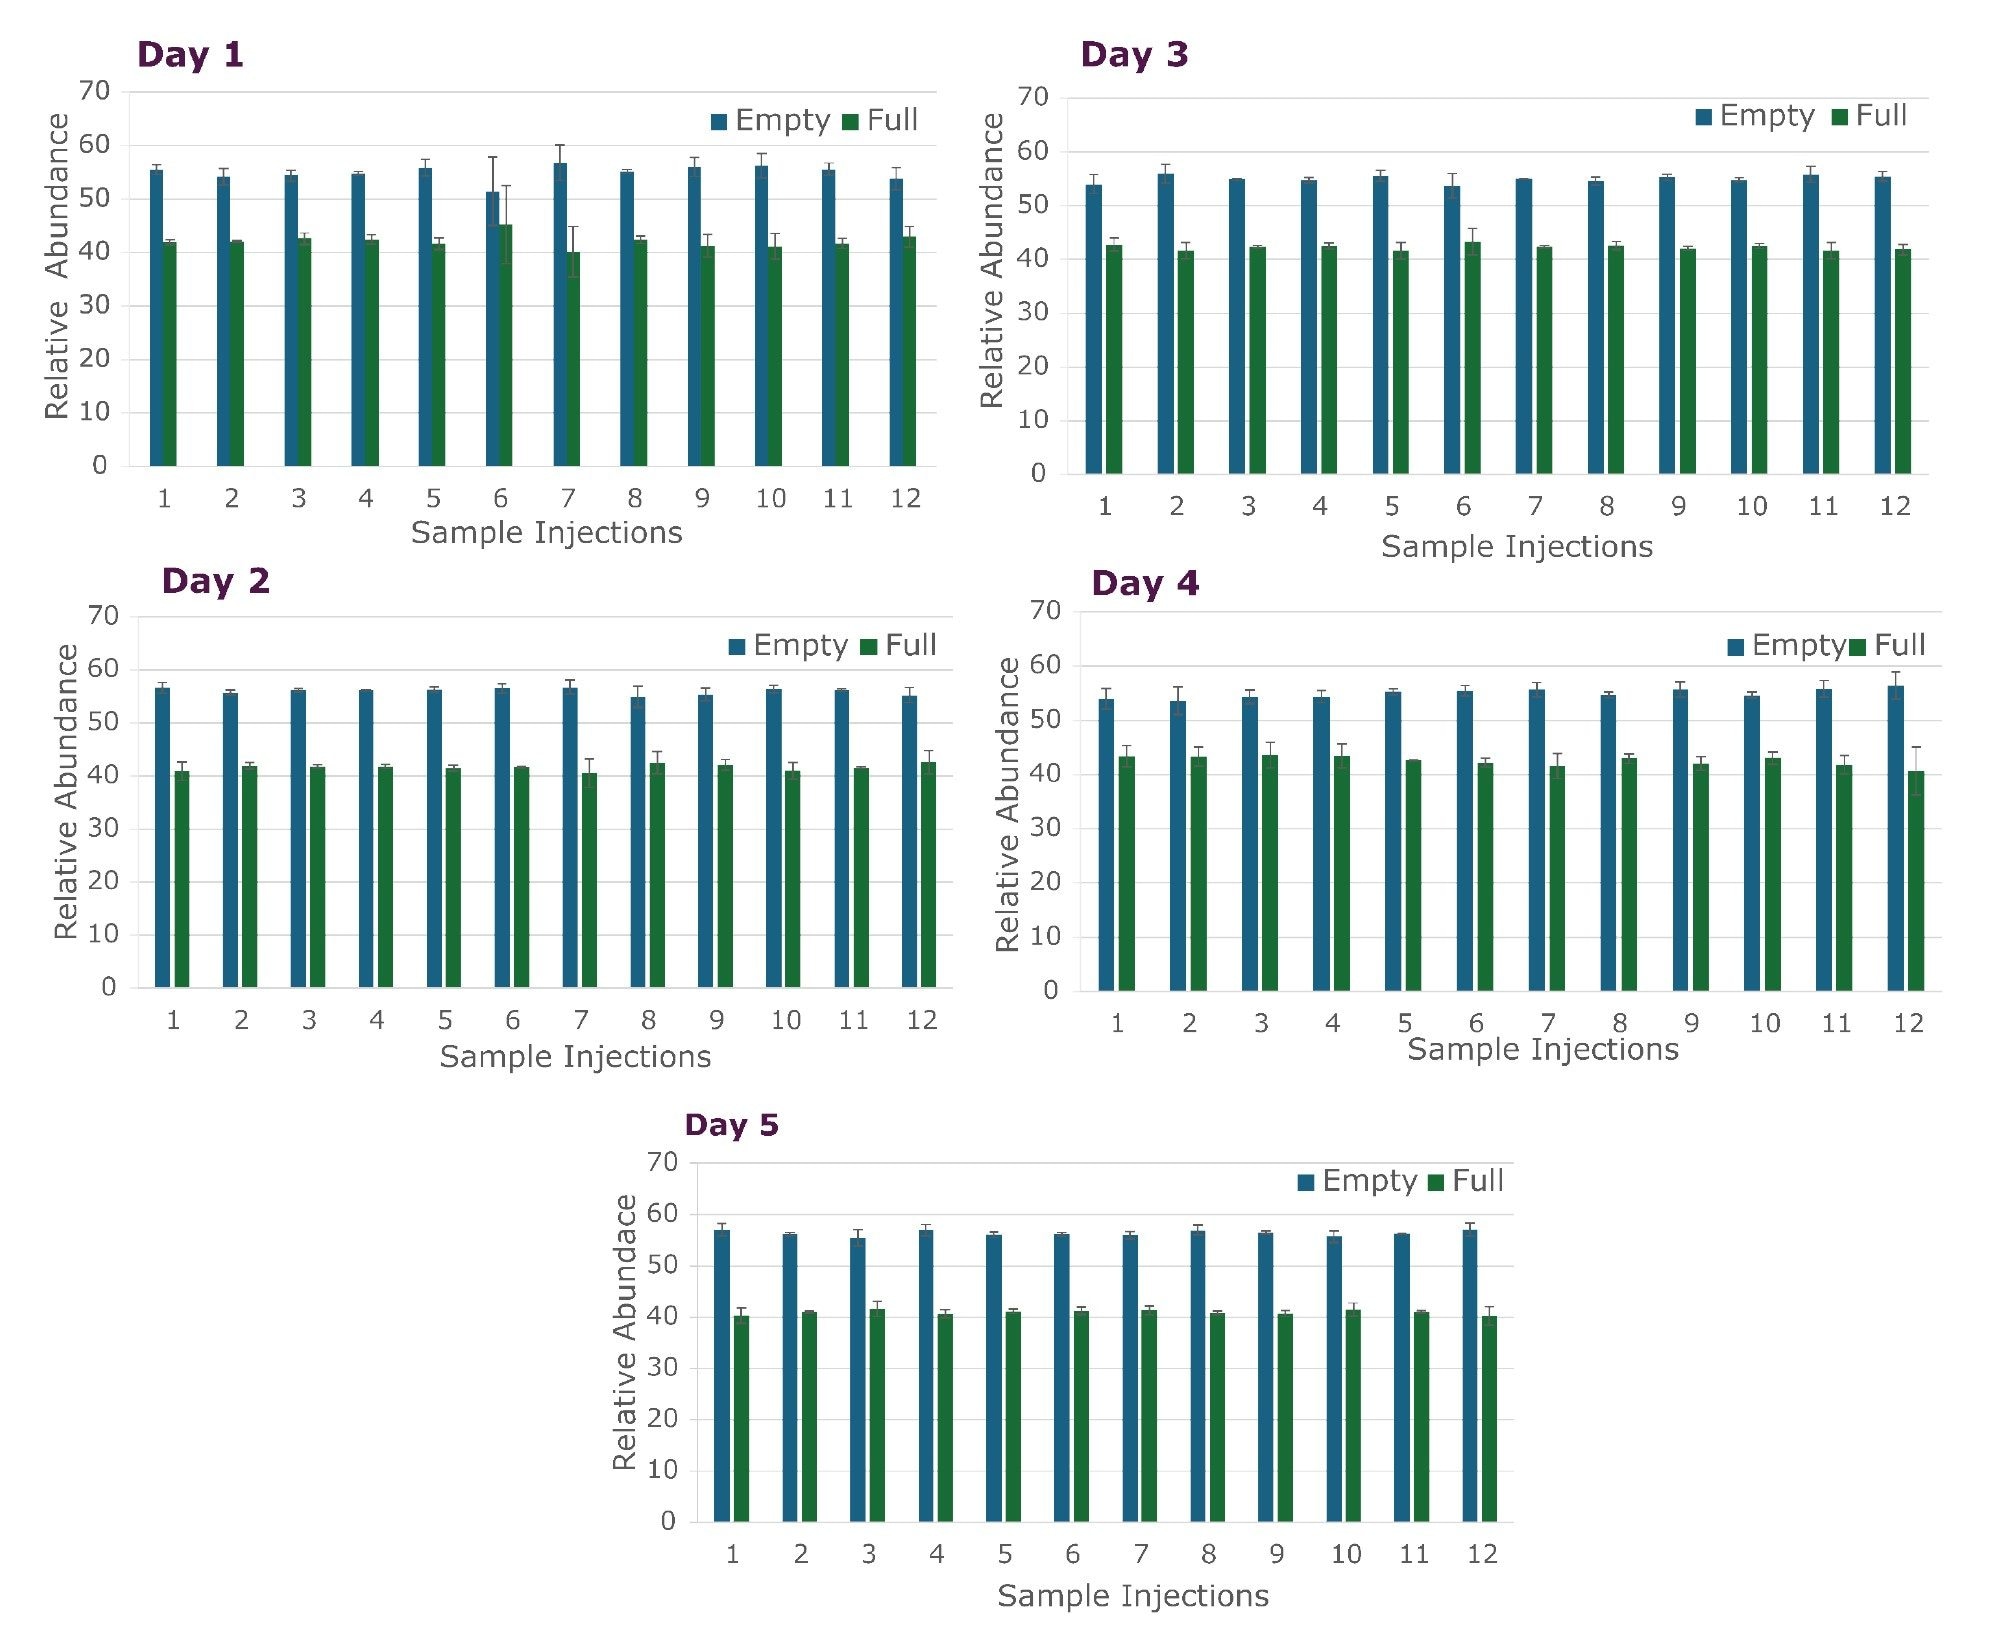
Analytical repeatability and intermediate precision were assessed using a 1:1 mixture of Empty and Full AAV8 capsids at 1 × 10¹³ vp/mL. 12 injections were performed per day over five consecutive days, providing a total of 60 planned measurements.
Relative peak abundance remained consistent throughout the study. Variability in relative peak abundance was <2% RSD, with individual injections remaining within ±3% of the overall mean (Figure 2). The low variability between repeated direct infusions and across different days demonstrates reproducible relative quantification of the AAV capsid populations.
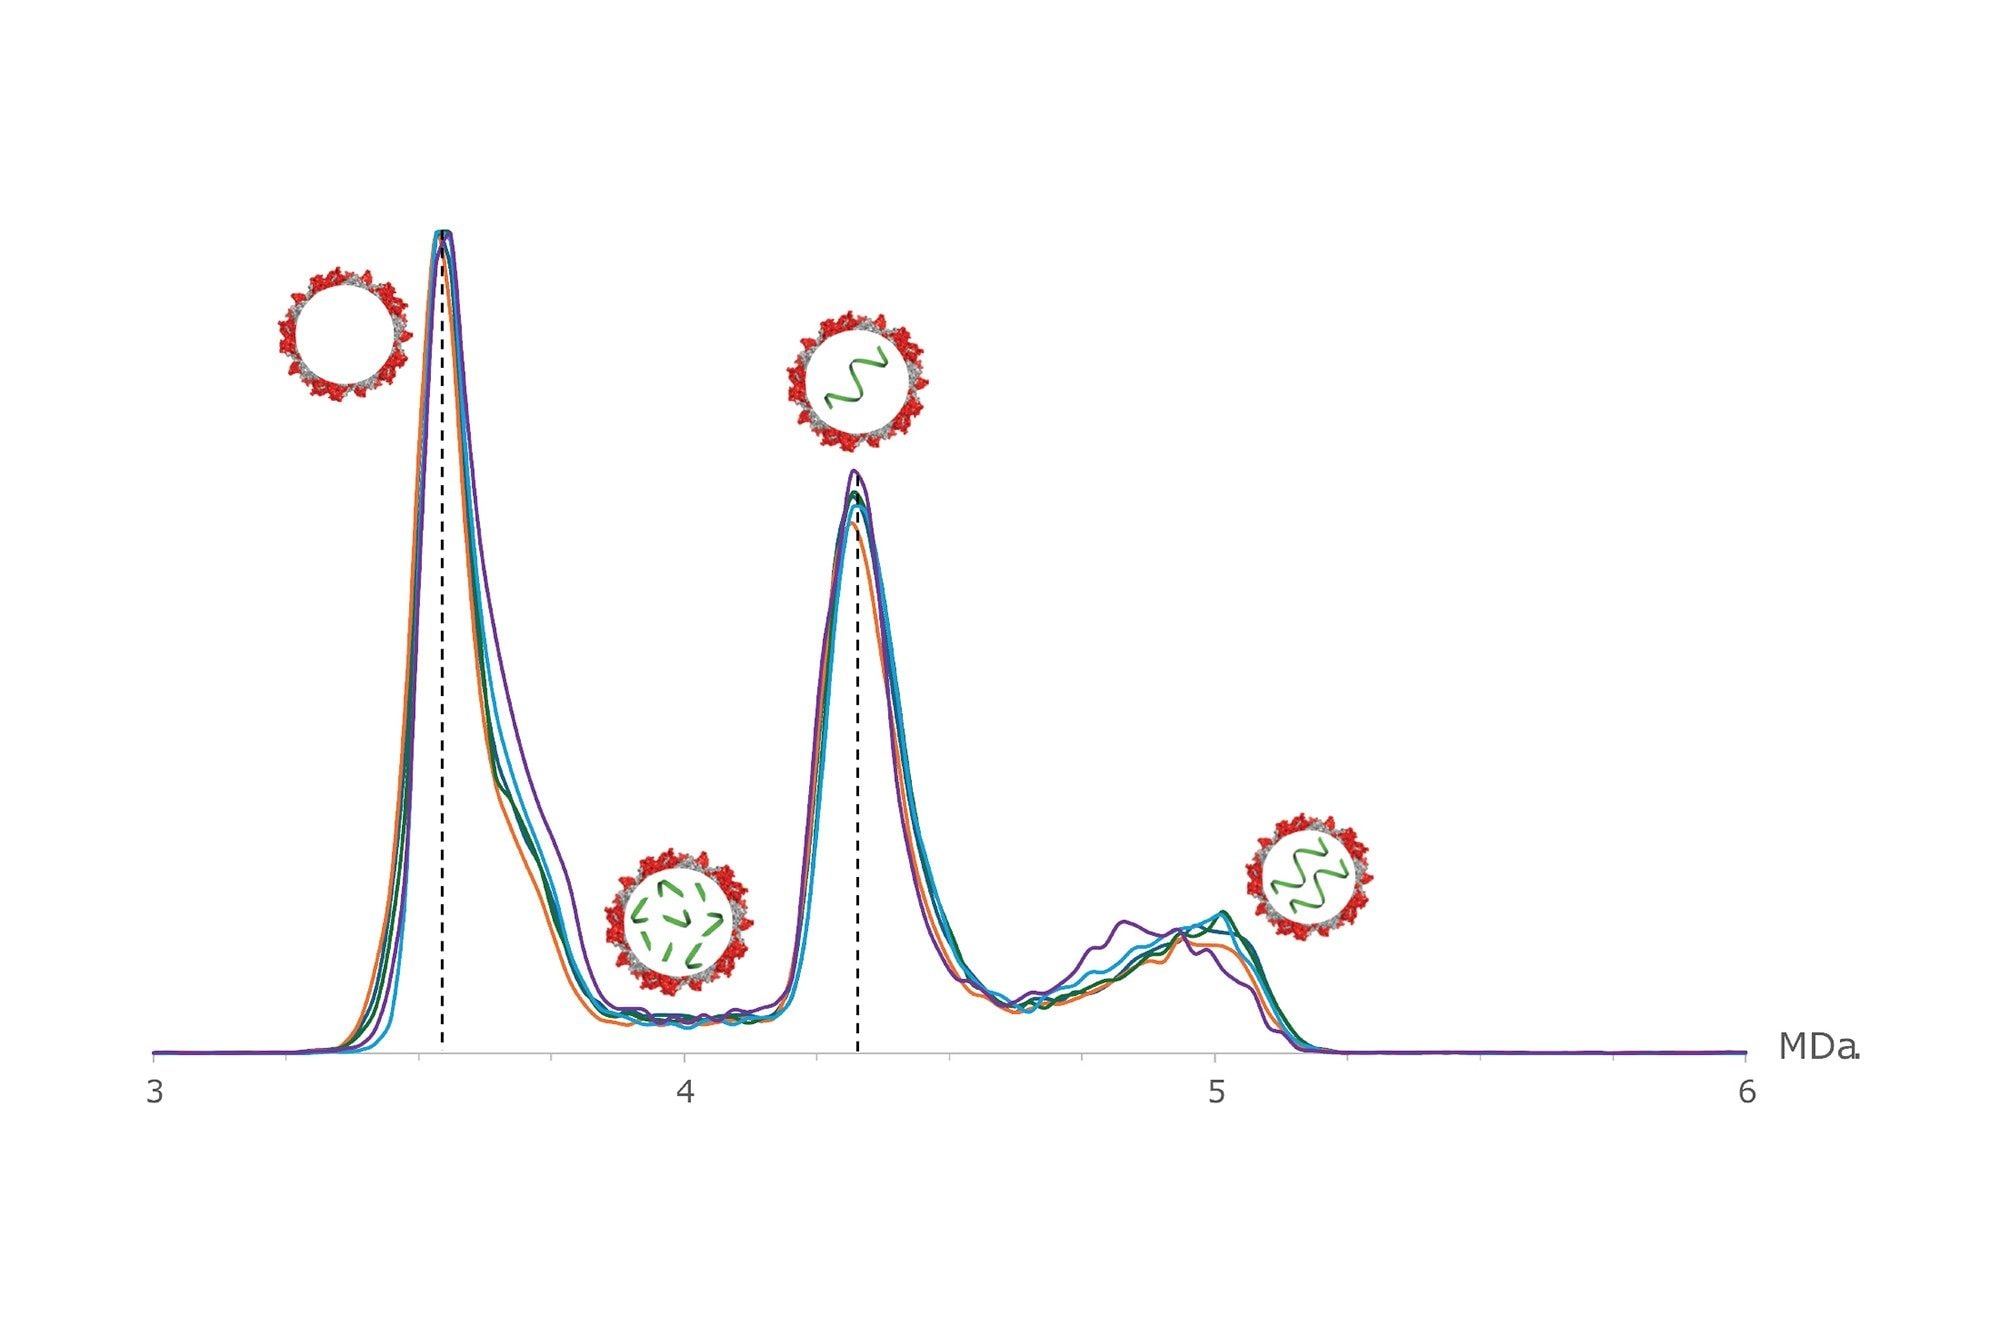
Normalized mass distributions generated over the five-day study showed excellent agreement, with the Empty and Full AAV8 populations exhibiting a high degree of overlap between days (Figure 3). The high degree of overlap between distributions indicate that comparable capsid population information was obtained throughout the study, supporting reproducible characterization of AAV heterogeneity over time.
The system also demonstrated consistent operational performance throughout the study. Combined with the reproducible relative quantification and strong agreement in capsid distributions observed across five consecutive days, these findings support reliable AAV characterization workflows and reproducible characterization of capsid heterogeneity over time.
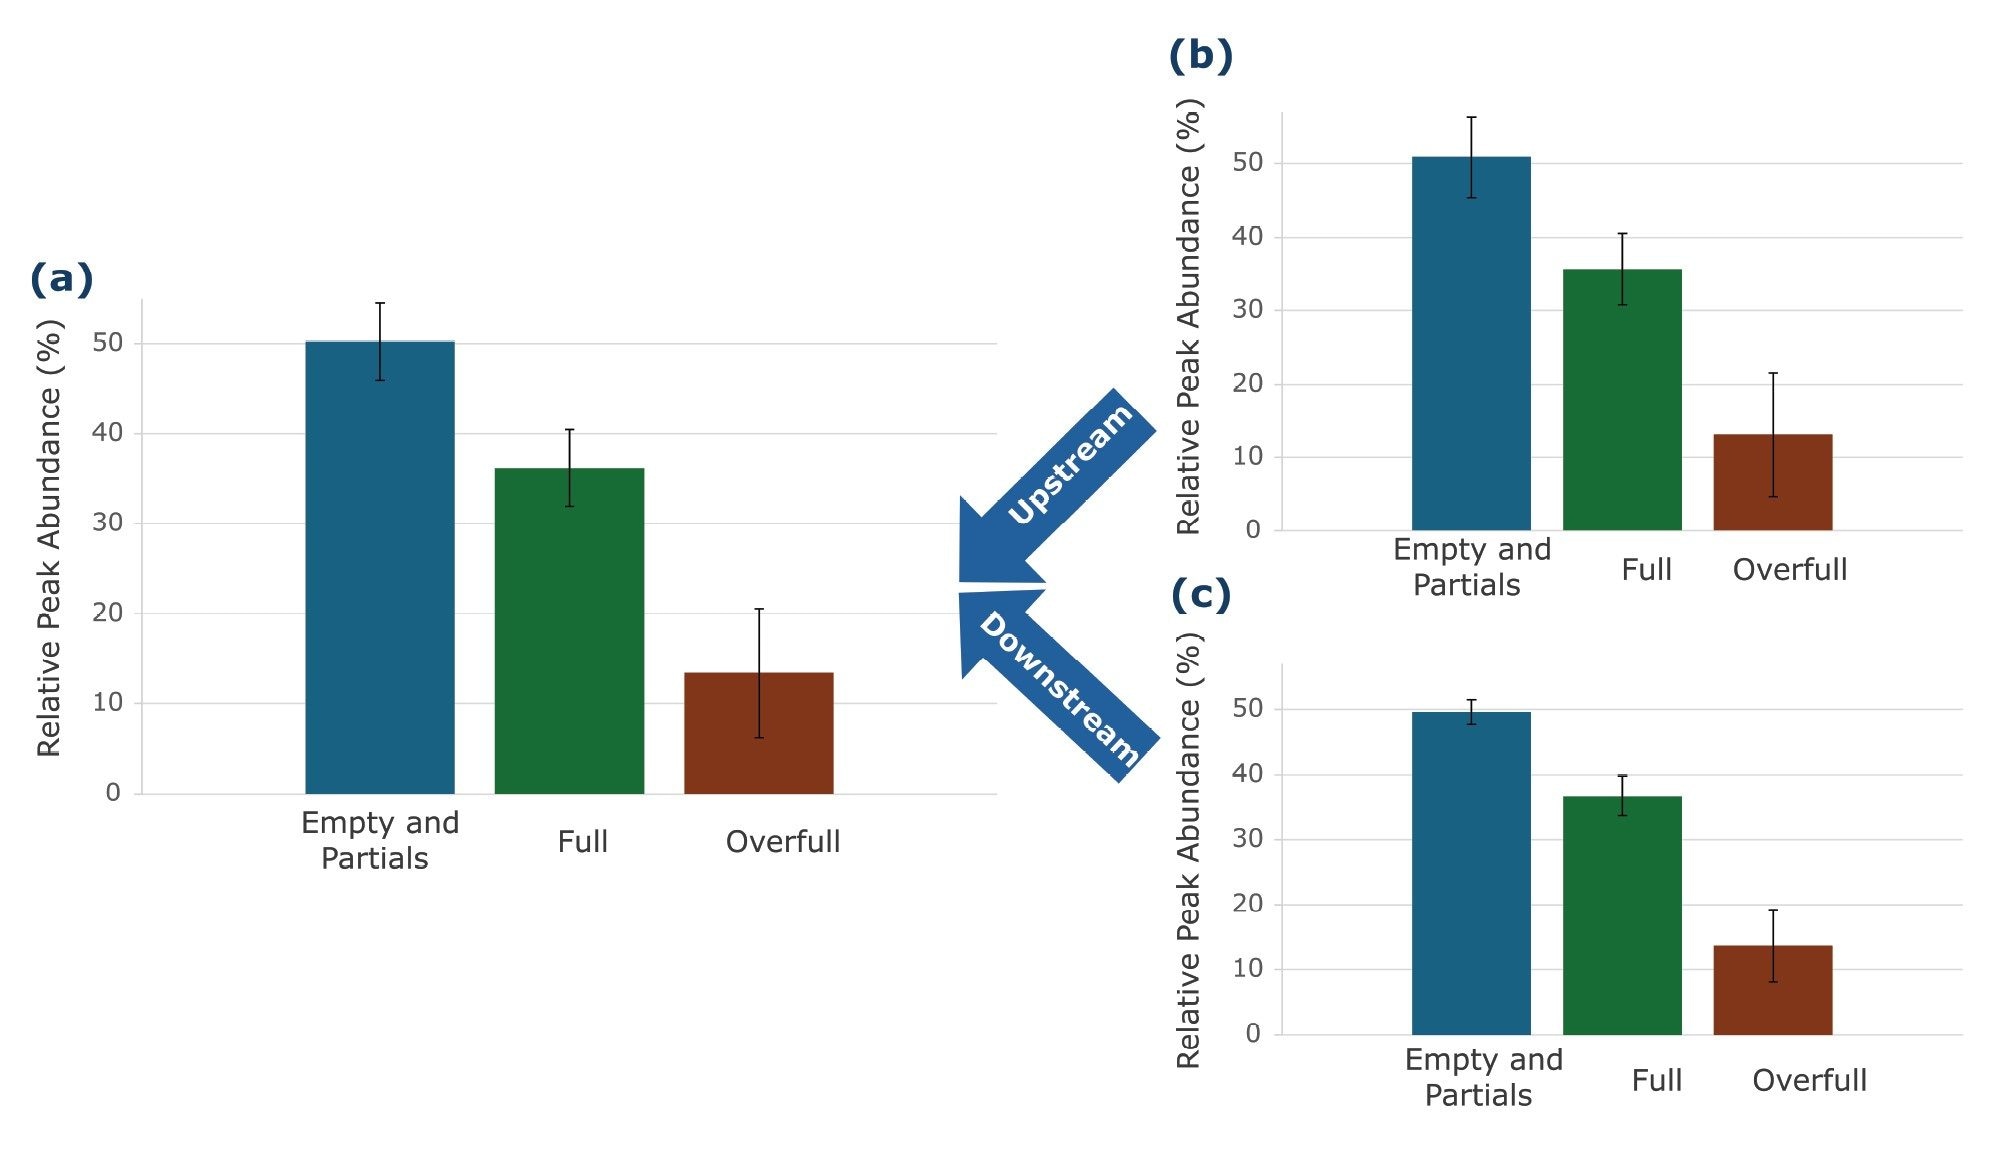
AAV samples encountered during bioprocessing can differ substantially in concentration. To investigate whether such changes affected relative quantification and capsid population profiles, the same 1:1 AAV8 mixture was analyzed at 1 × 10¹¹ vp/mL and 5 × 10¹² vp/mL, representing upstream and downstream equivalent concentrations. This corresponds to a 50-fold difference in AAV concentration between the two sample levels.
Low and high concentration samples were analyzed using repeated alternating injections. Relative peak abundances for the reported Empty/Partial, Full, and Overfull species shown ≤5% RSD, demonstrating reproducible relative quantification across concentration and injection order (Figure 4).
These results demonstrate that the Xevo CDMS System provides repeatable relative abundance measurements across both sustained multi-day operation and changes in AAV sample concentration. This performance is particularly relevant to AAV process development workflows, where samples collected at different manufacturing stages can vary considerably in concentration and capsid composition.
AAV samples encountered during bioprocessing can differ substantially in concentration. To investigate whether such changes affected relative quantification and capsid population profiles, the same 1:1 AAV8 mixture was analyzed at 1 × 10¹¹ vp/mL and 5 × 10¹² vp/mL, representing upstream and downstream equivalent concentrations. This corresponds to a 50-fold difference in AAV concentration between the two sample levels.
Low and high concentration samples were analyzed using repeated alternating injections. Relative peak abundances for the reported Empty/Partial, Full, and Overfull species shown ≤5% RSD, demonstrating reproducible relative quantification across concentration and injection order (Figure 4).
These results demonstrate that the Xevo CDMS System provides repeatable relative abundance measurements across both sustained multi-day operation and changes in AAV sample concentration. This performance is particularly relevant to AAV process development workflows, where samples collected at different manufacturing stages can vary considerably in concentration and capsid composition.
The Xevo CDMS System demonstrated robust and reproducible characterization of AAV8 capsid populations across repeated measurements, multiple days, and a range of process-relevant sample concentrations. Relative peak abundance showed <2% RSD across the five-day study, while normalized capsid distributions exhibited strong agreement and overlap across all five days of analysis. The system also maintained reproducible relative quantification when alternating between upstream and downstream equivalent AAV concentrations, with ≤5% RSD across measurements.
Throughout the study, the system maintained consistent analytical and operational performance, supporting reliable characterization over extended analysis periods. These results demonstrate that CDMS provides reproducible characterization and relative quantification of AAV capsid populations, enabling assessment of capsid heterogeneity, manufacturing consistency, and batch-to-batch comparability. Collectively, the findings demonstrate the value of the Xevo CDMS System as part of an analytical strategy for AAV process development, product characterization, and quality assessment.
Destro, F.; et al. The State of Technological Advancement to Address Challenges in the Manufacture of Raav Gene Therapies. Biotechnol. Adv. 2024, 76, 108433. DOI: https://doi.org/10.1016/j.biotechadv.2024.108433.
Sripada, S. A.; et al. Advances and Opportunities in Process Analytical Technologies for Viral Vector Manufacturing. Biotechnol. Adv. 2024, 74, 108391. DOI: https://doi.org/10.1016/j.biotechadv.2024.108391.
Ujma, J.; et al. A Charge Detection Mass Spectrometer for the Analysis of Megadalton-Sized Molecules. bioRxiv 2026. DOI: https://doi.org/10.64898/2026.04.29.721378.
https://www.rcsb.org/structure/2QA0.
720009683, November 2026


