Analytical Quality by Design Method Development and Optimization of an Impurity Profiling Method for GLP-1 Receptor Agonist Exenatide
Pawel Bigos, Robert E. Birdsall, Duanduan Han, Karen Nyholm
Waters Corporation, United-States
Published on March 06, 2026
Abstract
An analytical quality by design (AQbD) workflow was applied to develop and optimize a reversed-phase liquid chromatography (RPLC) method for separating exenatide from process- and product-related impurities generated during thermal stress. The workflow followed four phases: definition of method performance goals and acceptance criteria, identification of critical method parameters (CMP), application of design of experiments (DoE) for method screening and optimization, and establishment of a method operable design region (MODR). Method development was accelerated by using an ACQUITY™ Premier UPLC™ System coupled with UV and mass-based detection to identify and track impurity peaks across extensive DoE studies. Initial method screening on a UPLC platform provided rapid assessment of chromatographic parameters, which were subsequently scaled to the Alliance™ iS Bio HPLC System to support routine impurity analysis. System suitability metrics such as USP resolution and peak-to-valley ratio identified optimal separation conditions for the twenty detected process and product-related impurities. Experimental verification of multiple MODR points confirmed comparable performance, demonstrating that the AQbD approach provides a scientifically grounded, regulatory-aligned strategy for developing impurity monitoring methods.
Benefits
- Systematic identification and control of critical method parameters impacting separation of exenatide impurities using a structured, ICH Q14 aligned AQbD workflow.
- Improved accuracy of peak tracking during extensive screening and optimization studies using the ACQUITY QDa™ II Mass Detector with complementary UV detection.
- Accelerated method development by leveraging the ACQUITY Premier UPLC System for rapid screening, followed by method scaling to the Alliance iS Bio HPLC System to support routine quality control applications.
Introduction
The control and characterization of process- and product-related impurities are critical components of pharmaceutical development. Impurities can originate from raw materials, manufacturing processes, degradation pathways, or storage conditions, and their presence may impact product safety, efficacy, and stability. Consequently, regulatory agencies require robust, well-understood analytical methods capable of reliably detecting and monitoring impurities throughout product development and routine quality control. For peptide-based therapeutics such as exenatide, impurity analysis is particularly challenging due to the presence of structurally similar degradants and closely eluting species under RPLC conditions.
To address these challenges, an AQbD approach, as described in ICH Q14, was applied to provide a structured, science-based framework for analytical procedure development.1 Unlike traditional one-factor-at-a-time approaches, AQbD integrates risk assessment and DoE to systematically evaluate the impact of key method parameters on analytical performance. Within this framework, method development is guided by the establishment of method goals, identification of CMPs, and the application of DoE to understand parameters effects and interactions. The ultimate objective is to establish a MODR within which the analytical method consistently meets its intended performance criteria.
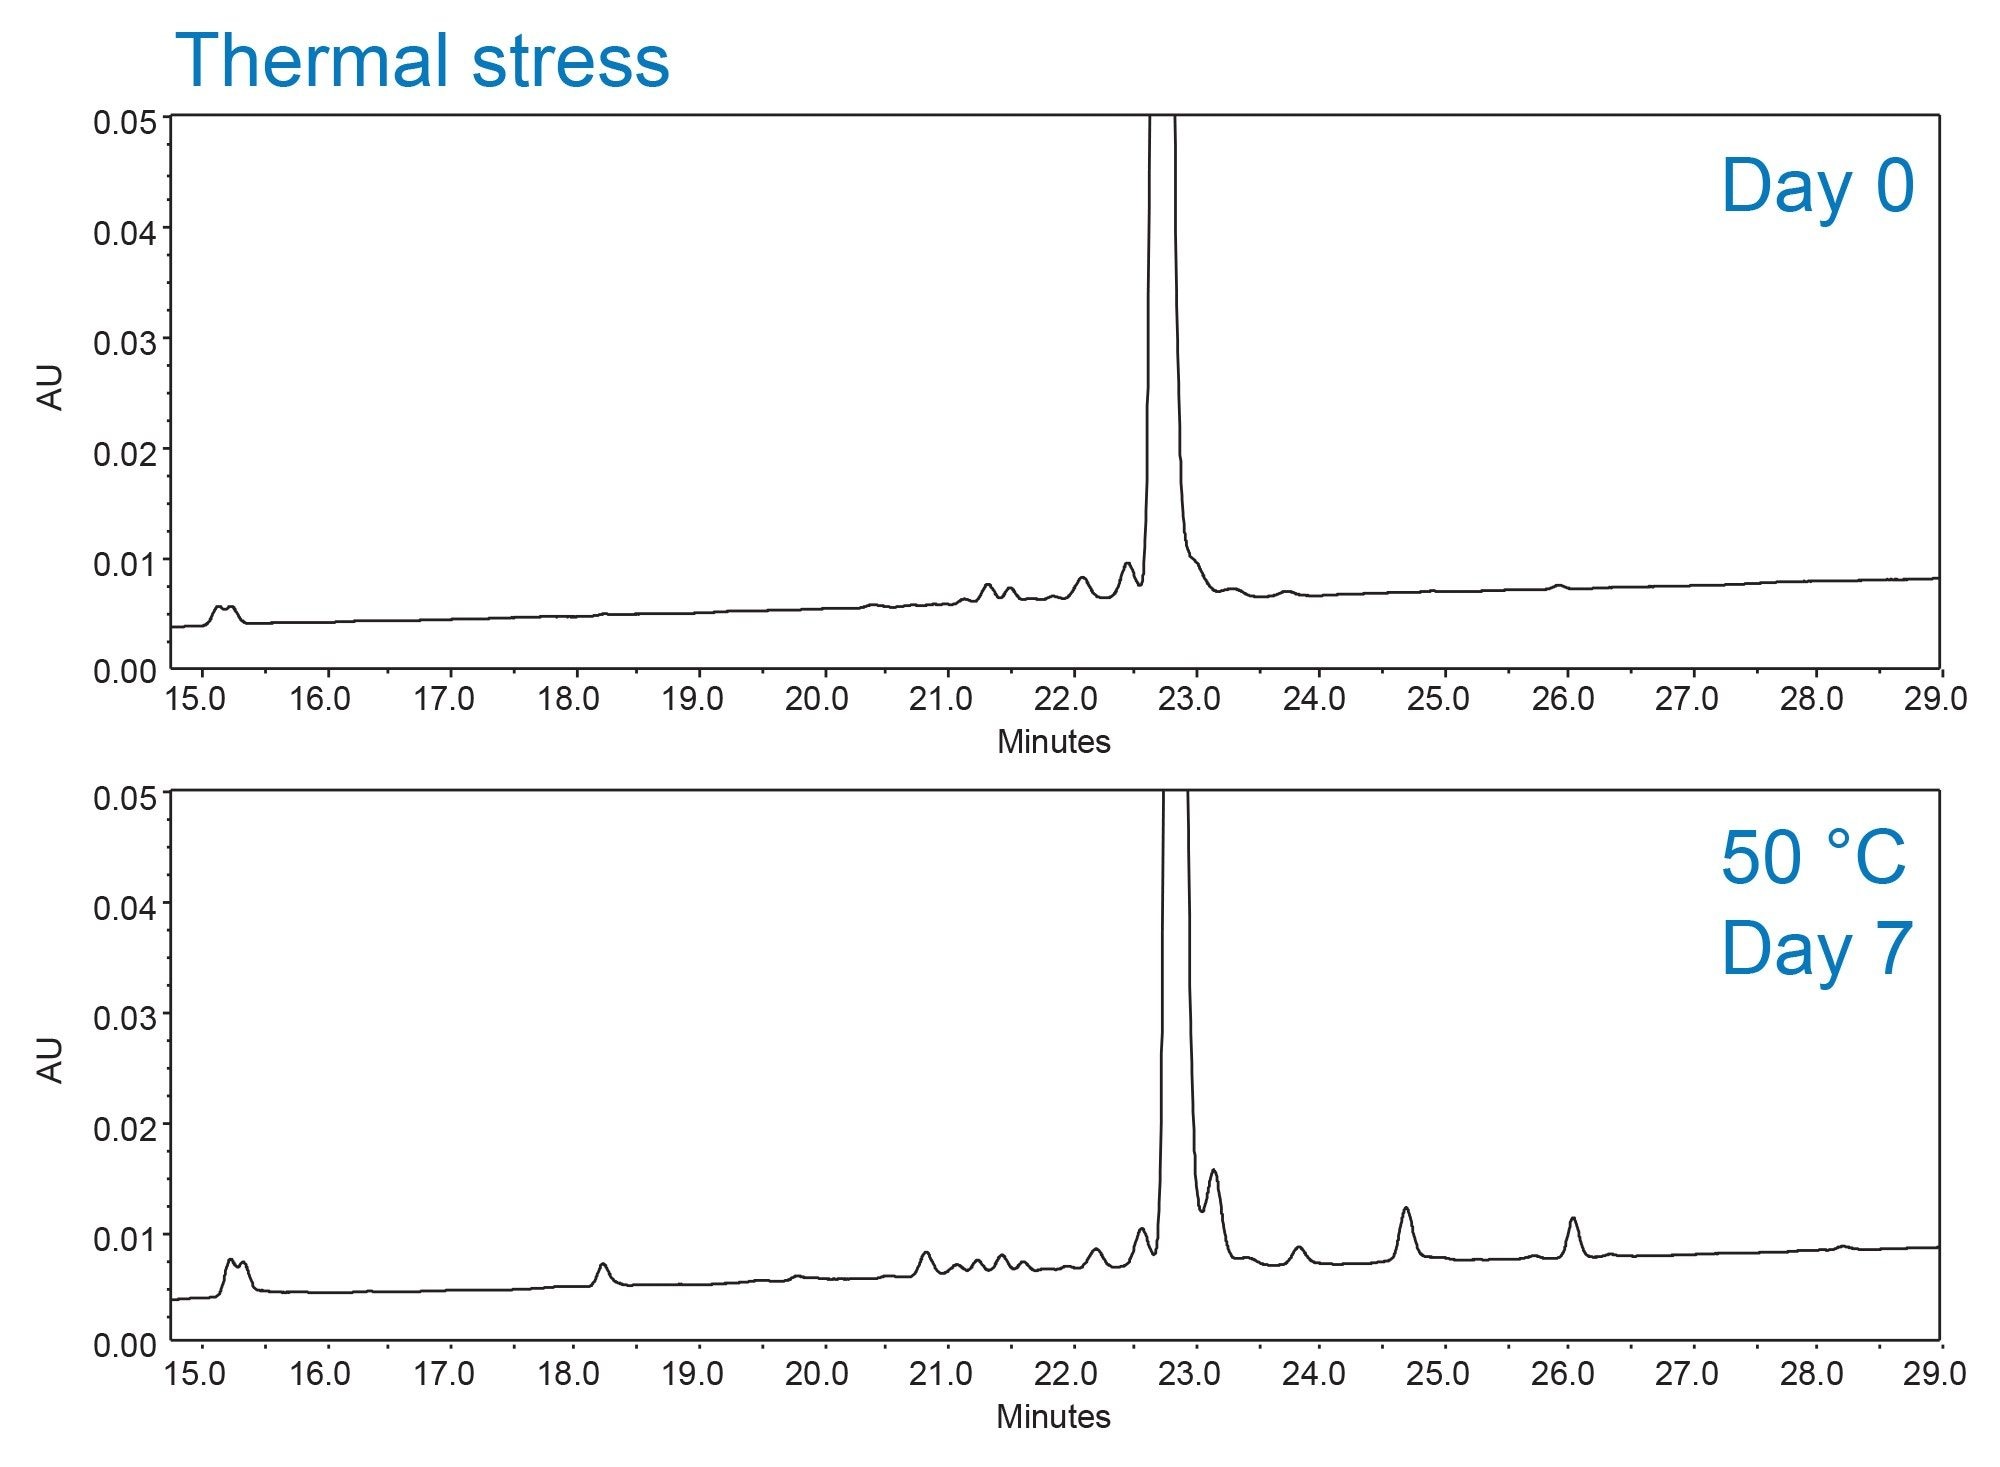
In this application note, an AQbD workflow is demonstrated for the development and optimization of an impurity profiling method for exenatide. As shown in Figure 1, research-grade exenatide contained several process-related impurities. To further characterize potential degradation pathways, exenatide was thermally stressed at 50 °C for 7 days to generate a more complete impurity profile.2,3 Method development was initially performed on an ACQUITY Premier UPLC System, leveraging small particle size columns to achieve higher separation efficiency and shorter run times. For long-term routine use in regulated laboratories, the method was scaled to an HPLC column to be compatible with the Alliance iS Bio HPLC System, enabling the use of several error reducing tools designed to improve efficiency in quality control environments. This study integrates risk assessment, DoE driven method screening and optimization, complementary UV and mass-based detection for impurity tracking, and scaling from UPLC to HPLC systems. Together, these elements enabled the development of a method capable of reliably separating process and product related impurities suitable for routine impurity monitoring.
Experimental
Research-grade exenatide drug substance was reconstituted in acetate buffer (pH 4.5) at a concentration of 5 mg/mL and subjected to thermal degradation at 50 °C for 7 days. Prior to analysis, samples were diluted 50-fold to a final concentration of 0.1 mg/mL using 6 M guanidine HCl + 0.1% formic acid (pH 2).
Method Development Conditions
|
LC system: |
ACQUITY Premier System |
|
Detection: |
TUV Detector λ = 220 nm and ACQUITY QDa II Mass Detector 400-1,500 m/z |
|
Columns: |
ACQUITY Premier Peptide BEH™ C18 Column, 130A, 1.7µm, 2.1 x 100 mm (p/n: 186009482) ACQUITY Premier Peptide CSH™ C18 Column, 130A, 1.7µm, 2.1 x 100 mm (p/n: 186009488) |
|
Column temperature: |
50–80 °C |
|
Sample temperature: |
20 °C |
|
Injection volume: |
6 µL |
|
Mobile phase A: |
0.1% TFA in water 0.1% FA in water |
|
Mobile phase B: |
0.1% TFA in acetonitrile 0.1% FA in acetonitrile |
|
Gradient time: |
25–50 minutes (0.5–1.0 % B/min) |
|
Gradient: |
20–28% gradient initial strong solvent 40–55% gradient final strong solvent |
Final Method Conditions
|
LC system: |
Alliance iS Bio HPLC System |
|
Detection: |
TUV Detector, λ = 220 nm |
|
Column: |
XSelect™ Premier Peptide CSH C18 Column, 130A, 2.5µm, 4.6 x 150 mm (p/n: 186009909) |
|
Vials |
QuanRecovery™ with MaxPeak™ HPS Vial and pre-slit PTFE silicone cap (p/n: 176004434) |
|
Column temperature: |
65 °C |
|
Sample temperature: |
20 °C |
|
Injection volume: |
43 µL |
|
Mobile phase A: |
0.1% TFA in water |
|
Mobile phase B: |
0.1% TFA in acetonitrile |
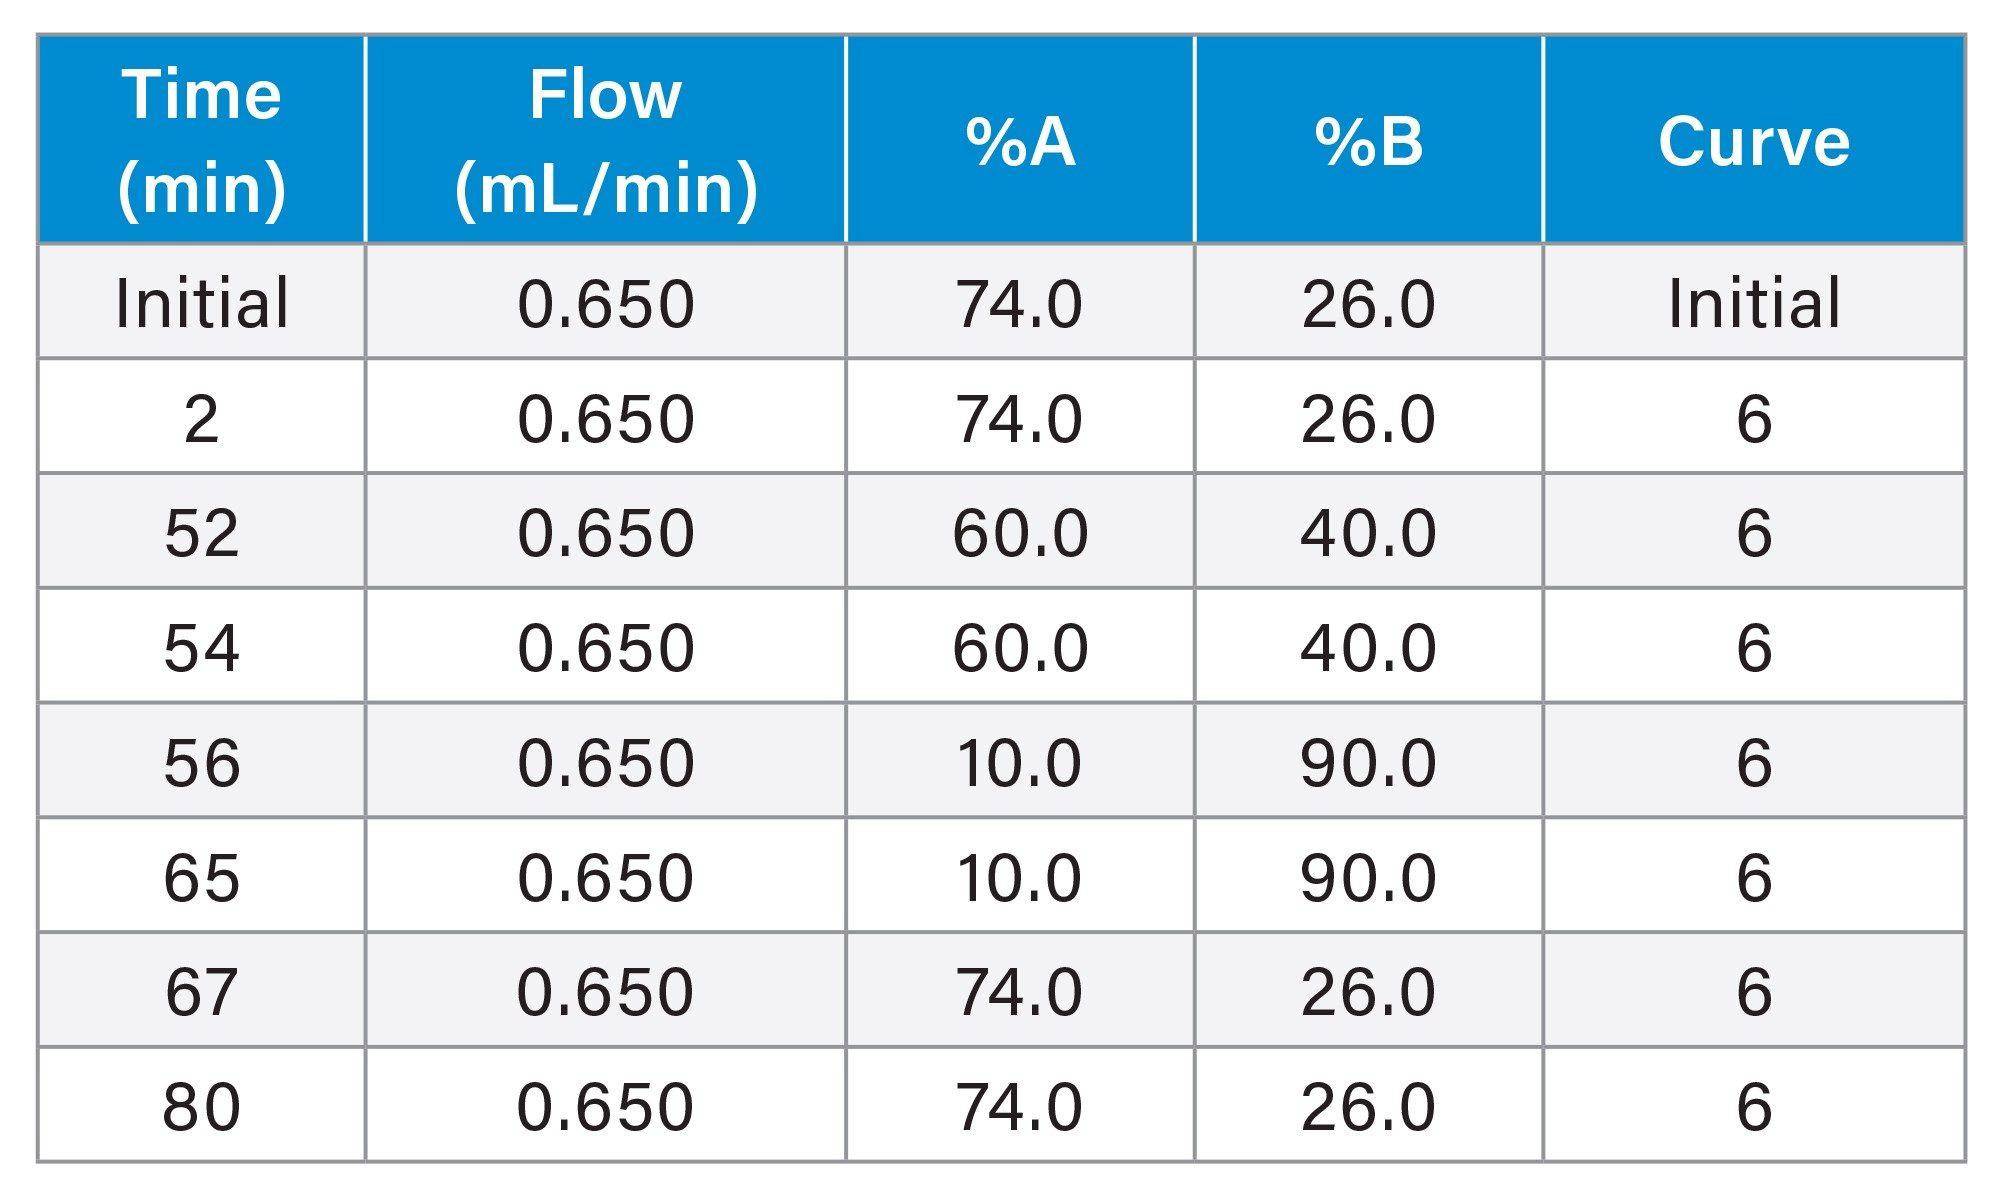
Gradient Table
Software
|
Chromatography data system: |
Empower™ 3.8.1 Software |
|
Method development software: |
Fusion QbD™ Software (S-Matrix Corporation, Version 9.9.2 SR3.b) |
Results and Discussion
AQbD Workflow
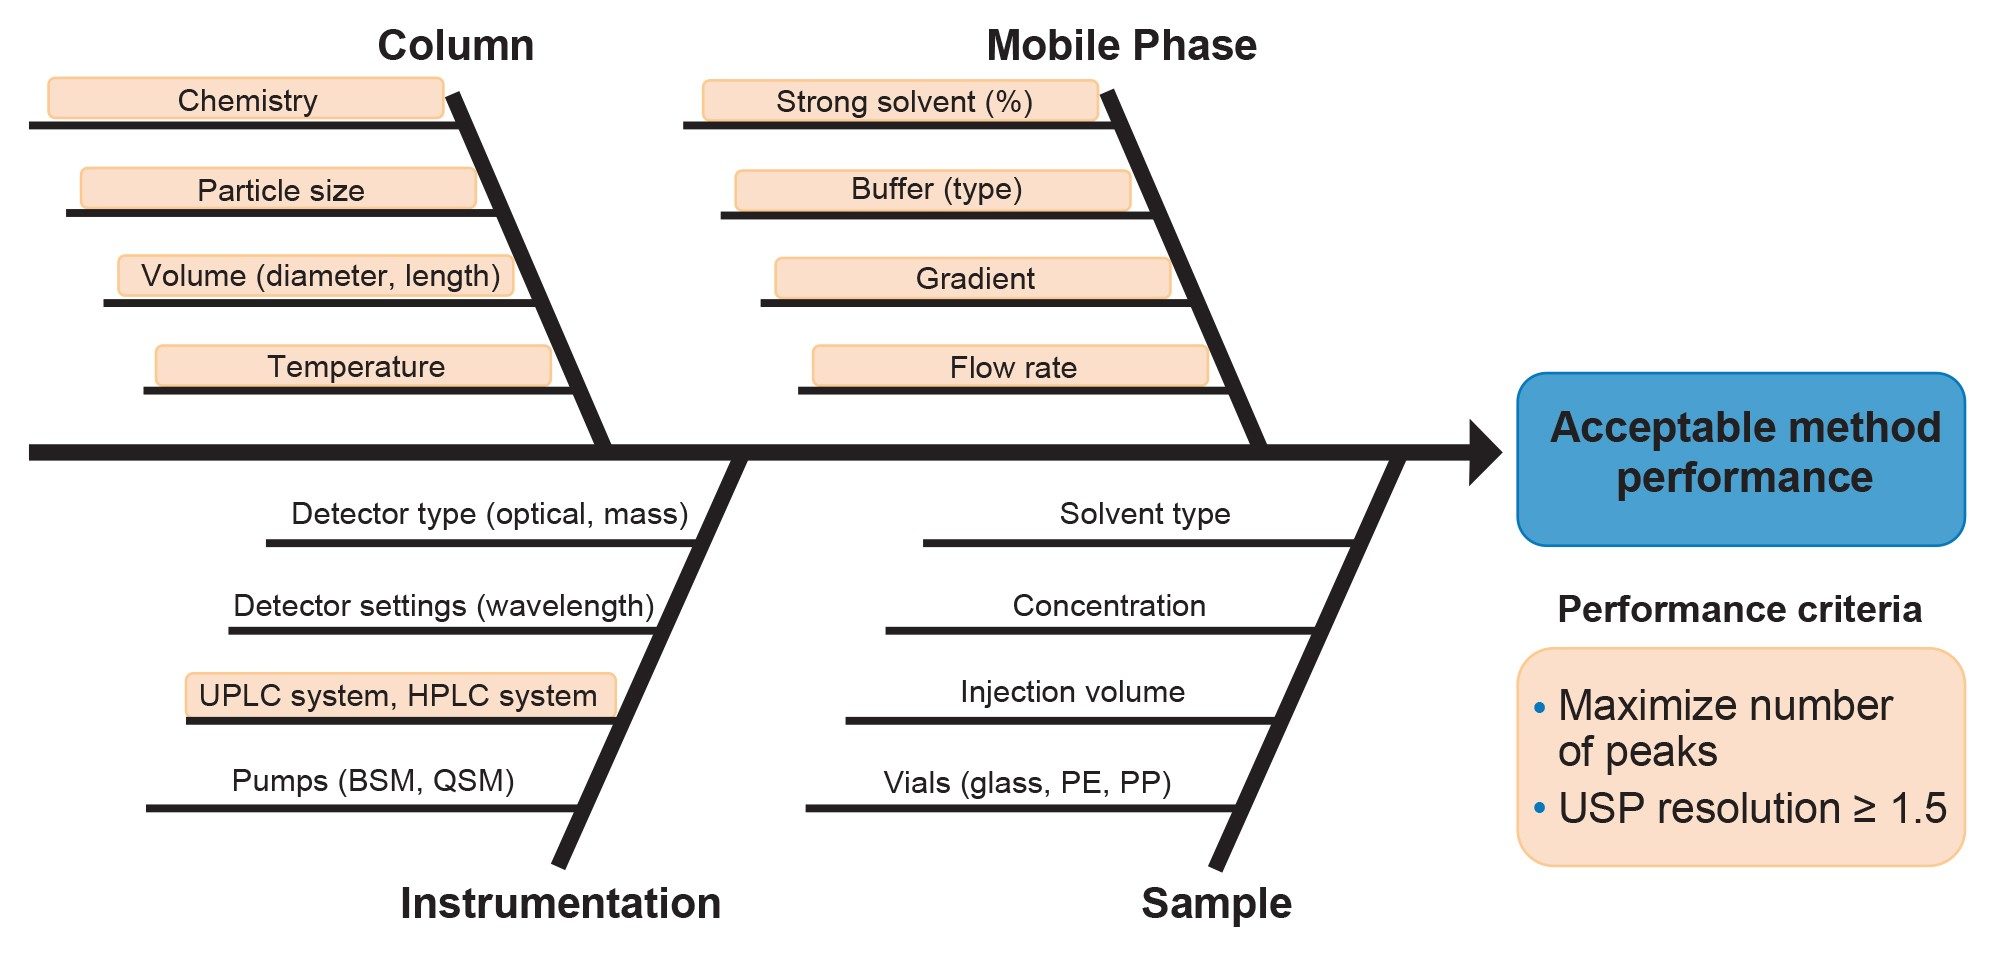
In this study, an AQbD workflow comprising of 4 phases was applied to develop a method for separating exenatide from process- and product-related impurities generated during a forced thermal degradation study. The first phase of the workflow focuses on defining method performance goals and specific acceptance criteria. This includes establishing the analytical objectives and the intended purpose of the method. Clearly defining these elements provides a structured foundation for subsequent development activities. The second phase of the workflow involves risk management, during which CMPs expected to have the greatest potential impact on method performance are identified and evaluated. Parameter selection is guided by scientific understanding and prior experience with similar analytical methods. As illustrated in the fishbone diagram shown in Figure 2, commonly recognized CMPs include column chemistry, mobile phase composition, instrumentation, and sample preparation. Among these, the parameters that will be evaluated in this study are highlighted in orange.
The third phase consists of applying DoE, which is a structured and systematic approach used to establish quantitative relationships between method parameters and analytical performance. This phase is typically divided into 2 DoE sub-phases: method screening and method optimization. During the method screening DoE, a broad range of chromatographic parameters are evaluated to identify method conditions with the greatest potential to meet the ATP. Promising conditions identified during screening are subsequently refined in the method optimization DoE, which focuses on defining optimal parameter settings and establishing a method design space. In the fourth and final phase, insights gained from the DoE studies are used to define a method operable design region (MODR) within the established design space. Method conditions within the MODR are expected to consistently meet the predefined performance criteria. To verify the accuracy of the modeled results, selected MODR verification points are typically confirmed through experimental testing.
To accelerate the AQbD workflow, the ACQUITY QDa II Mass Detector was employed as a complementary detection tool during method development. This detector provides an effective balance between ease of use and analytical capability, offering mass-based selectivity without the complexity associated with more advanced mass spectrometry systems. The use of the ACQUITY QDa II Mass Detector enables targeted monitoring of specific m/z values, which is particularly advantageous during extensive DoE studies where changes in method parameters can significantly affect retention and selectivity. Under these conditions, reliance on optical detection alone can make peak tracking difficult. In contrast, mass-based detection allows peaks to be accurately identified by their m/z values, independent of chromatographic shifts.
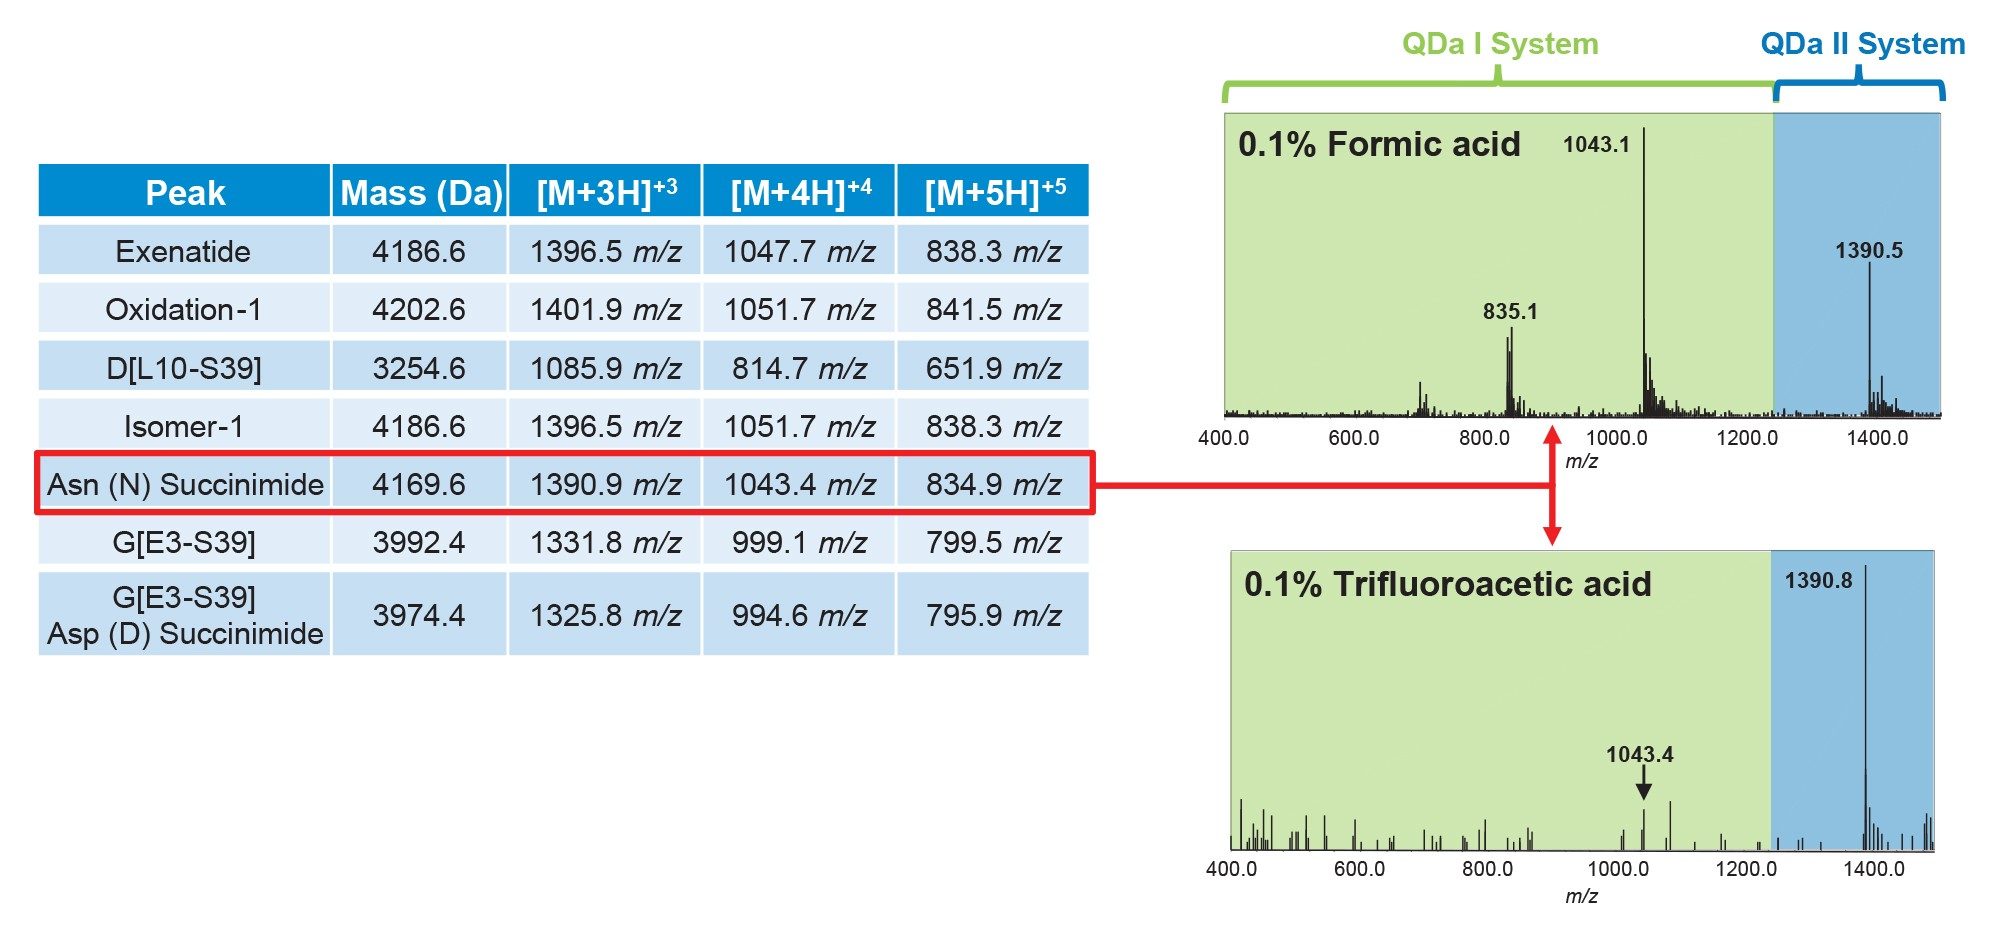
A key performance advantage of the ACQUITY QDa II Mass Detector is its extended mass range of up to 1500 m/z, enabling broader analyte coverage and improved sensitivity, especially for higher molecular weight impurities. Figure 3 summarizes several known product-related impurities and their m/z values at different charge states. As part of the DoE evaluation, 2 acidic mobile phase modifiers, trifluoroacetic acid (TFA) and formic acid (FA) were assessed, resulting in different charge state distributions. As shown on the right side of Figure 3, using 0.1% FA produced the highest signal intensity at the +4-charge state for 1 product-related impurity, whereas 0.1% TFA yielded the highest signal at the +3-charge state. The extended mass range of the ACQUITY QDa II Mass Detector allows for these impurity peaks to be consistently tracked across DoE runs for both acidic modifiers, enabling more efficient data interpretation and integration throughout method development.
Method Screening
In alignment with the AQbD workflow and the principles outlined in ICH Q14, the first phase of analytical procedure development is to clearly define the method goals and associated performance criteria. During the screening stage, the objective is to develop a broad understanding of how key chromatographic variables influence separation behavior and to identify the most promising conditions for subsequent optimization. In this study, the screening stage was designed to identify RPLC conditions that maximize the detectability of impurity peaks in a thermally stressed exenatide sample. The performance goal at this stage is intentionally simple, rather than targeting full baseline resolution, the intent was to identify combinations of chromatographic conditions that yield the greatest number of detectable impurity peaks. These conditions will serve as the foundation for method optimization, where additional method parameters will be further refined in the method optimization stage.
The screening DoE evaluated chromatographic parameters ranked as having the greatest potential impact on method performance. The 4 parameters evaluated include column chemistry (ACQUITY Premier Peptide CSH C18 or BEH C18 Column), organic modifier (acetonitrile or methanol), acidic modifier (TFA or FA), and gradient time (25–50 minutes). These parameters are known to significantly influence retention, selectivity, and peak shape in peptide RPLC methods. Experimental runs were performed using an ACQUITY Premier UPLC System with a TUV Detector and an ACQUITY Premier QDa II Mass Detector, providing complementary UV and mass-based detection to support impurity tracking and enable data-driven selection of conditions for subsequent optimization experiments.
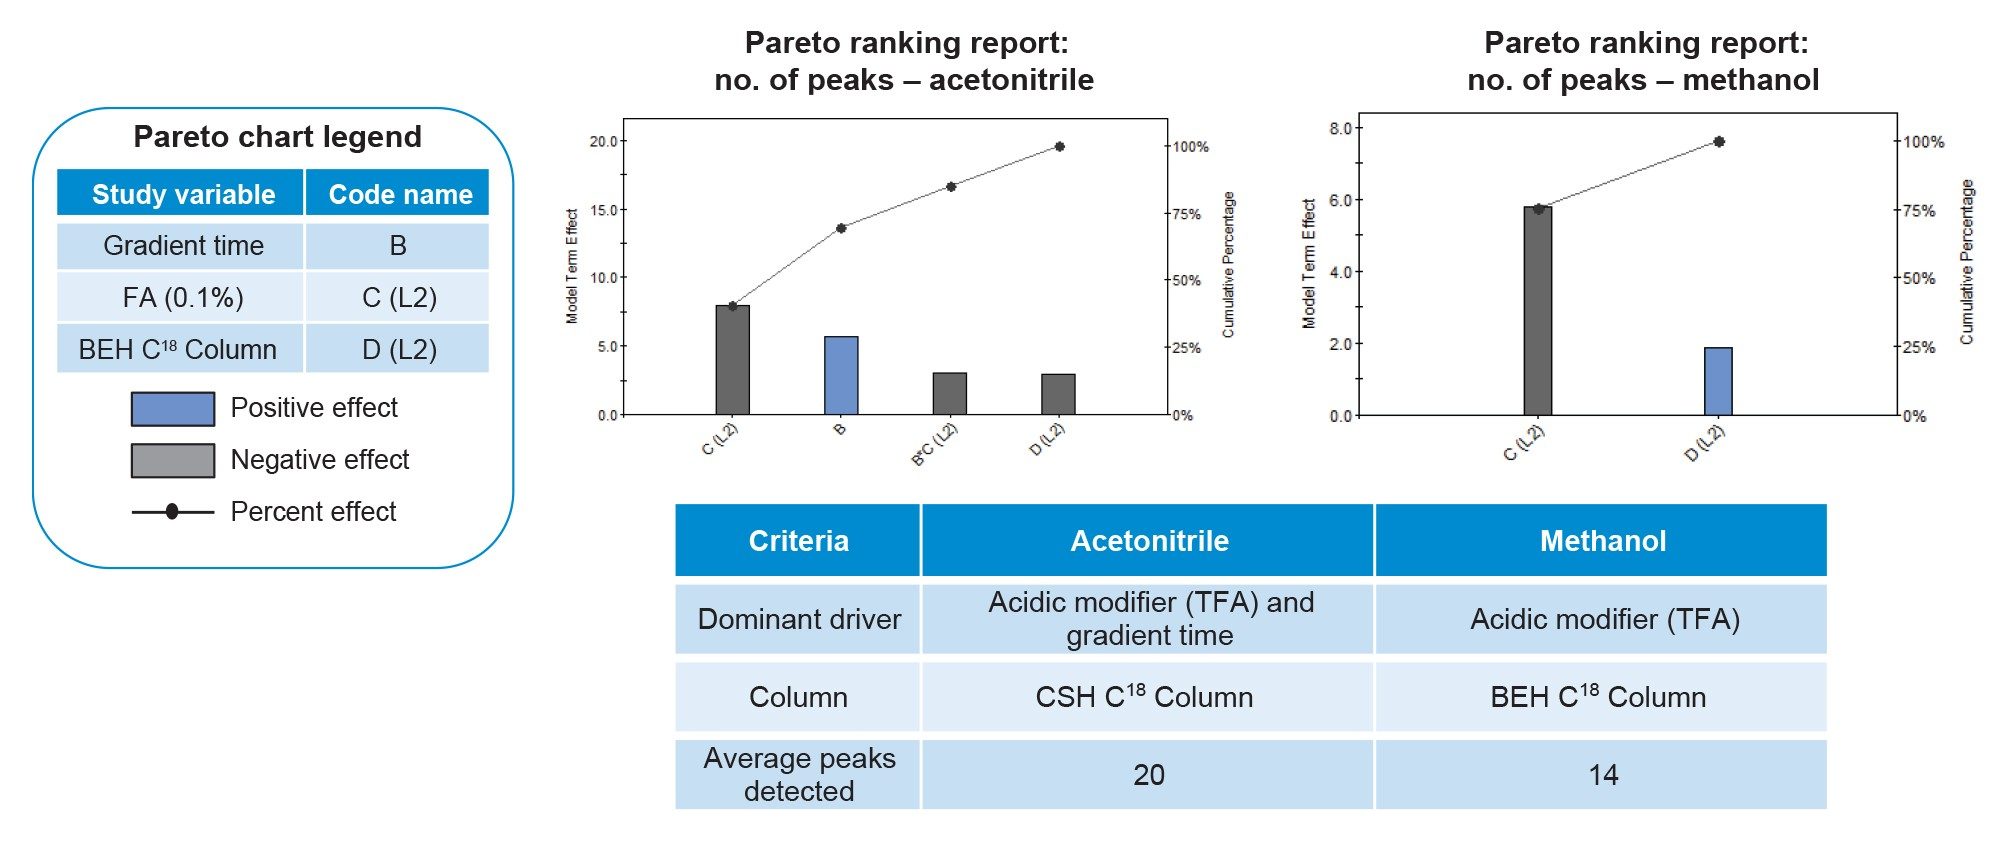
To expedite the method development process and enable a structured, data-driven implementation of AQbD, Fusion QbD Software was used as the primary experimental design and data analysis platform. The software supports risk-based method development through integrated DoE design, multivariate modeling, and knowledge management, providing a framework aligned with ICH Q14 to efficiently guide method screening and optimization. After integration of the screening DoE experiments chromatograms in Empower 3 CDS, the results were imported into Fusion QbD Software for analysis. The software provides tools such as response modeling, design space visualization, and risk assessment, to evaluate parameter effects and support decision making. For the screening DoE, Pareto ranking charts were used to assess the relative impact of the tested parameters. In Figure 4, the bars represent individual method parameters arranged in descending order of impact, with blue bars indicating a positive effect and gray bars indicating a negative effect. The line overlaid on the bars shows the cumulative percentage of the total effect across all parameters. Experiments using acetonitrile and methanol were analyzed in separate reports. For experiments using acetonitrile, the Pareto chart shows that the use of TFA, longer gradient times, and the ACQUITY Premier Peptide CSH C18 Column resulted in the greatest number of detected impurity peaks. In contrast, for methanol-based experiments, the use of TFA and the ACQUITY Premier Peptide BEH C18 Column separated the greatest number of impurity peaks. However, when results were compared across both organic modifiers, the ACQUITY Premier Peptide CSH C18 Column separated on average six more impurity peaks relative to the ACQUITY Premier Peptide BEH C18 Column. Based on these findings, the acetonitrile-based conditions were advanced into the method optimization stage.
With the column chemistry and mobile phase composition established during the screening stage, the final step prior to method optimization was to scale the current conditions from a UPLC to a HPLC system. The ACQUITY Premier UPLC System was initially used to expedite method development by leveraging 1.7-micron particle size columns to reduce run times and lower solvent consumption during screening. To support compatibility with routine quality control environments and long-term impurity profiling, the selected screening conditions were subsequently scaled to the Alliance iS Bio HPLC System. Method scaling was performed in accordance with the guidelines outlined in USP General Chapter <621>.4 To maintain comparable separation efficiency and selectivity, the same stationary phase chemistry was used and the ratio of column length to particle size was kept similar between systems. Accordingly, the ACQUITY Premier Peptide CSH C18 Column (130A, 1.7µm, 2.1 x 100 mm) was scaled to the XSelect Premier Peptide CSH C18 Column (130A, 2.5µm, 4.6 x 150 mm). Using this column geometry, calculations listed in USP General Chapter <621> were applied to scale injection volume, flow rate, and gradient time, resulting in HPLC conditions that closely matched the chromatographic performance achieved during UPLC screening.
Method Optimization
At the conclusion of the screening stage, 19 process and product-related impurity peaks were detected and partially resolved. For the method optimization stage, the performance goal will be to maximize the number of peaks that achieve baseline resolution (resolution ≥ 1.5) while minimizing method runtime. Based on the outcomes of the screening DoE and prior method knowledge, 4 method parameters were selected for optimization:flow rate (0.650–0.900 mL/min), gradient time (50–100 minutes), gradient final strong solvent percentage (40–55%), and column temperature (50–80 °C). Flow rate and gradient time were included to optimize gradient slope and separation efficiency, particularly for closely eluting impurity peaks. The final gradient strong solvent percentage was selected to ensure adequate elution of hydrophobic impurities while trying to minimize method runtime. Column temperature was included to evaluate mass transfer and selectivity, as well as evaluate its potential impact on peak shape. Together, these parameters define a focused optimization design space that enables a systematic, multivariate evaluation of critical method parameters and their interactions.
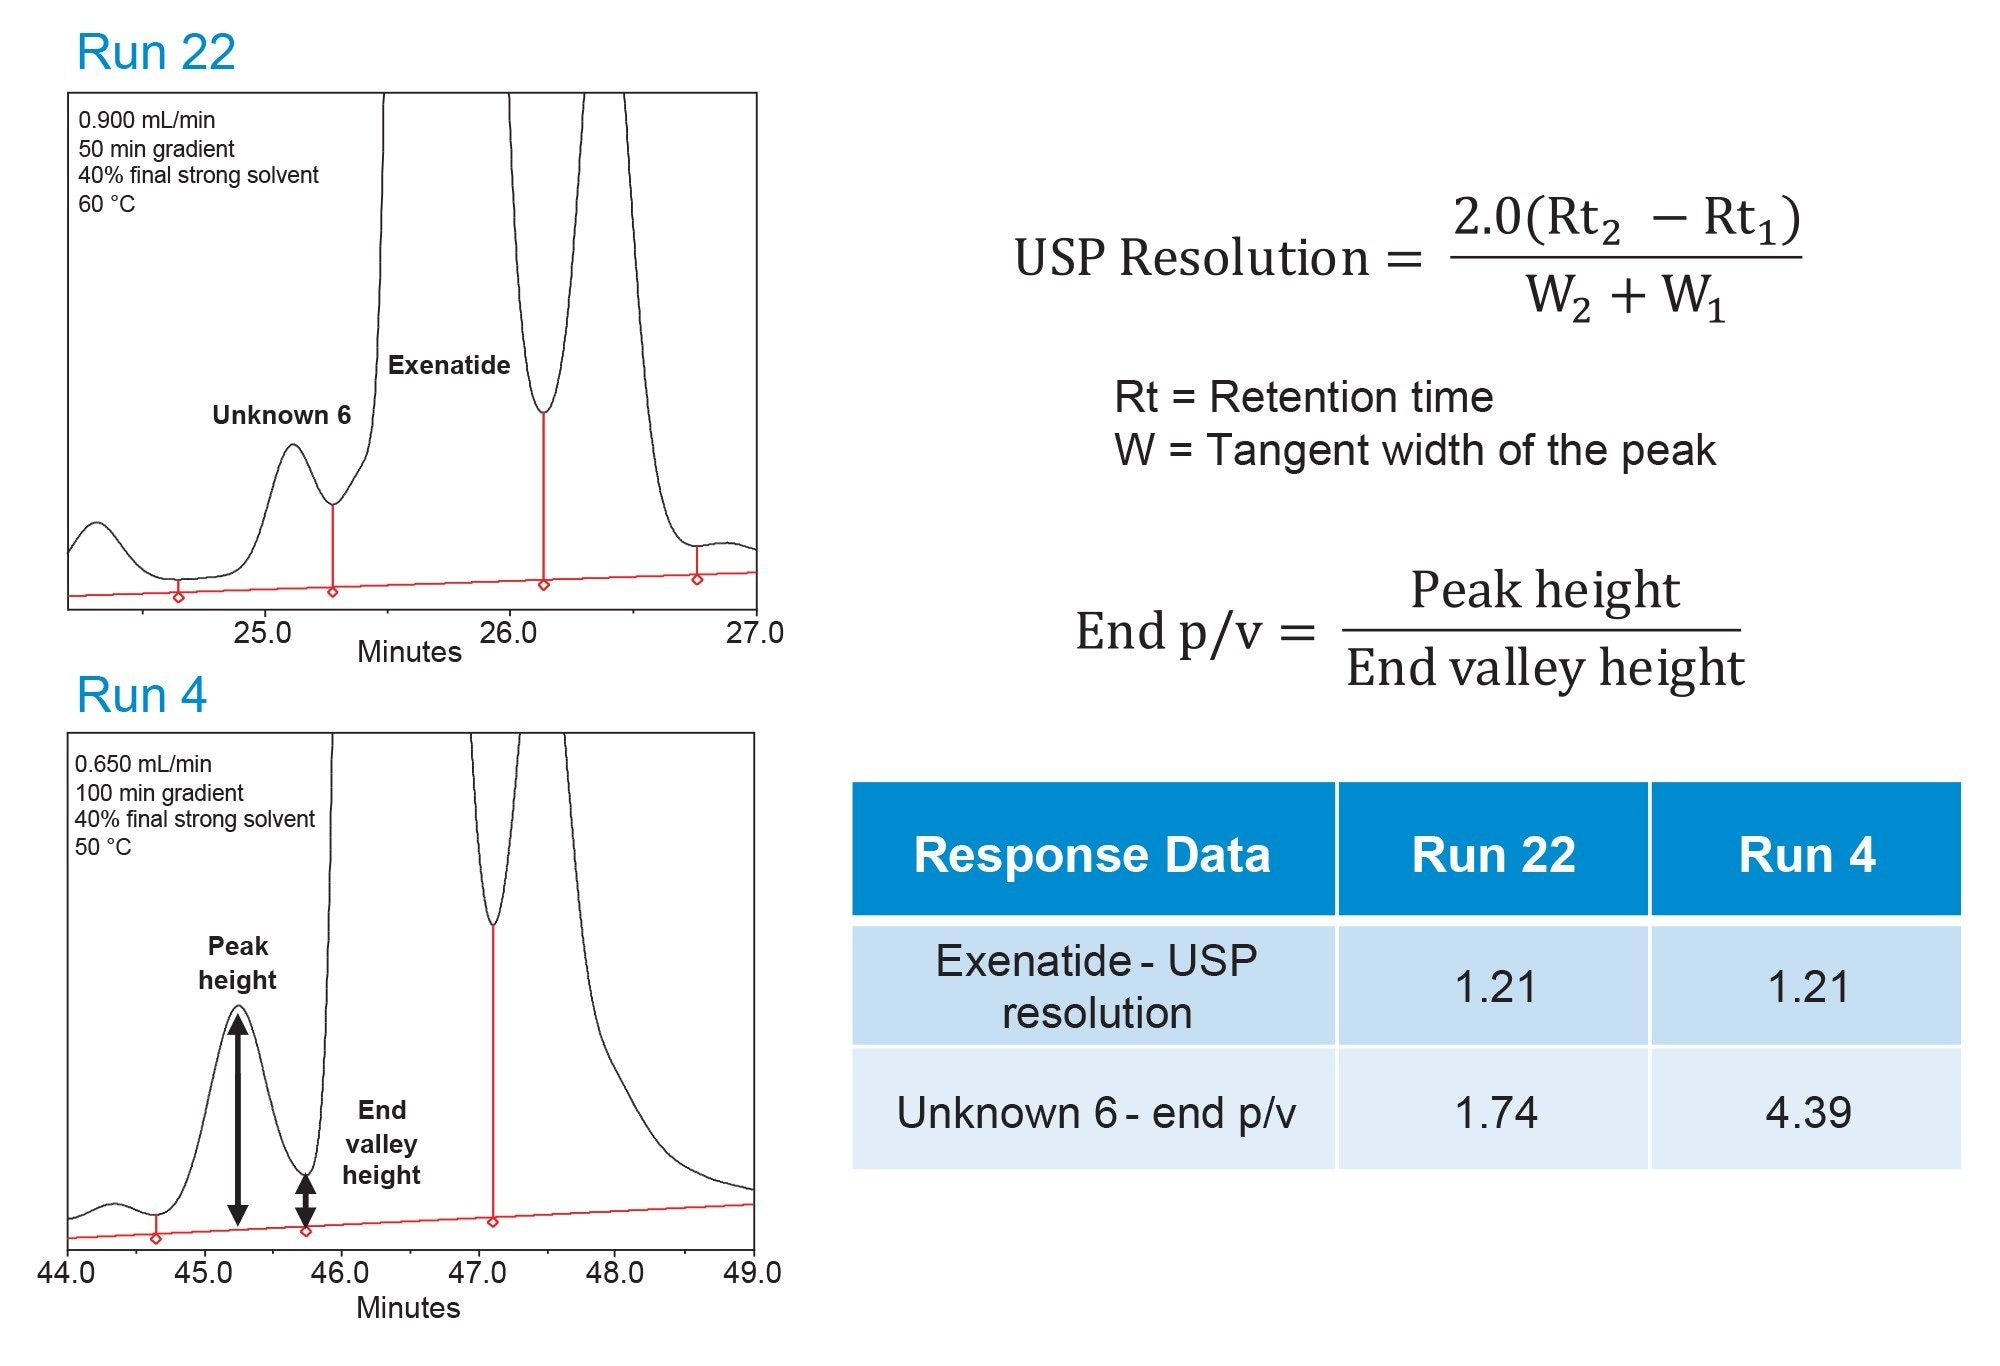
An important consideration during data analysis is the selection of appropriate system suitability metrics to accurately evaluate chromatographic performance. In this study, many impurity peaks are partially or fully coeluted, making USP half-height resolution unsuitable because peaks must be resolved at a minimum of half-height. Instead, USP resolution based on tangent widths is used, as it can be applied to partially resolved peaks. However, in certain cases, tangent-based resolution calculations can overestimate true separation due to the influence of noise, asymmetric peak shapes, or the presence of shoulder peaks, resulting in resolution values that do not visually reflect the quality of separation in the chromatogram. As illustrated in Figure 5, the chromatogram for run 4 shows visibly improved separation compared to run 22, however, both runs report a USP resolution value of 1.21. To complement the USP resolution data, the additional peak-to-valley ratio system suitability metric was incorporated to provide a more representative assessment of separation quality across the optimization DoE experiments.4 This metric is calculated as the ratio of peak height to valley height and directly reflects the depth of the valley between adjacent peaks. Because it captures how two partially coeluting peaks are separated, peak-to-valley ratio offers a complementary measure of separation when USP resolution alone is insufficient. In the tabular results, the peak-to-valley metric clearly differentiates between the 2 runs, with run 4 exhibiting a value more than twice that of run 22. This outcome is consistent with the visual assessment of the chromatograms and enables the modeling software to better discriminate between experimental conditions, thereby improving the reliability of data interpretation during method development.
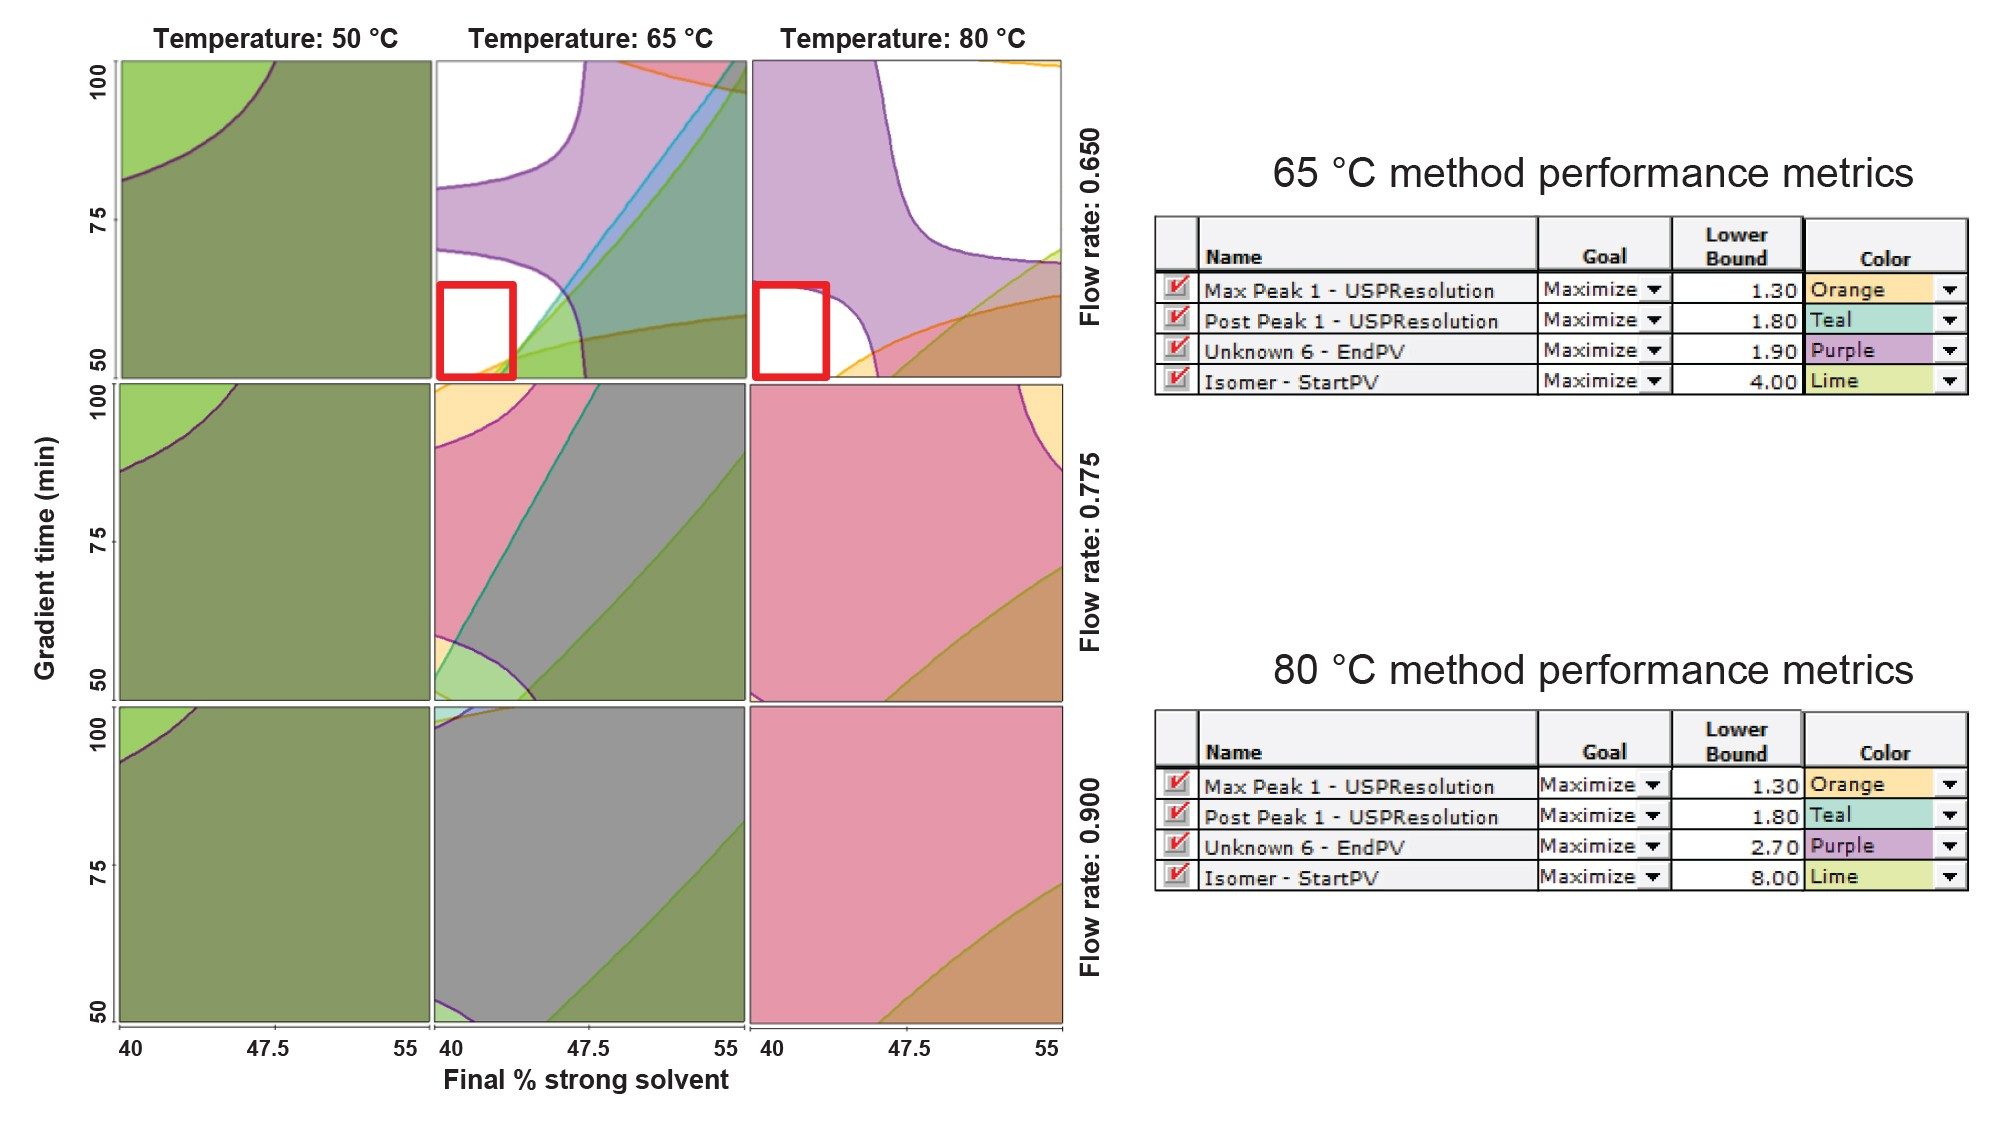
After applying both system suitability metrics, the results of the optimization DoE can be summarized using visualization tools such as resolution maps, as shown in Figure 6. Resolution maps provide a comprehensive view of the method performance across the design space, and Figure 6 presents 9 resolution maps that collectively illustrate the combined effects of the four evaluated method parameters. The application of both USP resolution and peak-to-valley metrics as performance criteria enabled identification of a narrowed range of method conditions that achieved adequate separation of exenatide and coeluting impurities, as indicated by the unshaded region within the red box. Although additional unshaded regions also met the separation criteria, these conditions were associated with longer analysis times. As a result, method conditions with shorter run times were prioritized to balance chromatographic performance with efficiency. Separate performance thresholds were applied for column temperatures of 65 °C and 80 °C because the peak-to-valley metric is strongly influenced by peak height. Increasing column temperature led to an increase in peak height, therefore, to avoid misinterpretation of separation quality, the data was evaluated independently for each temperature condition.
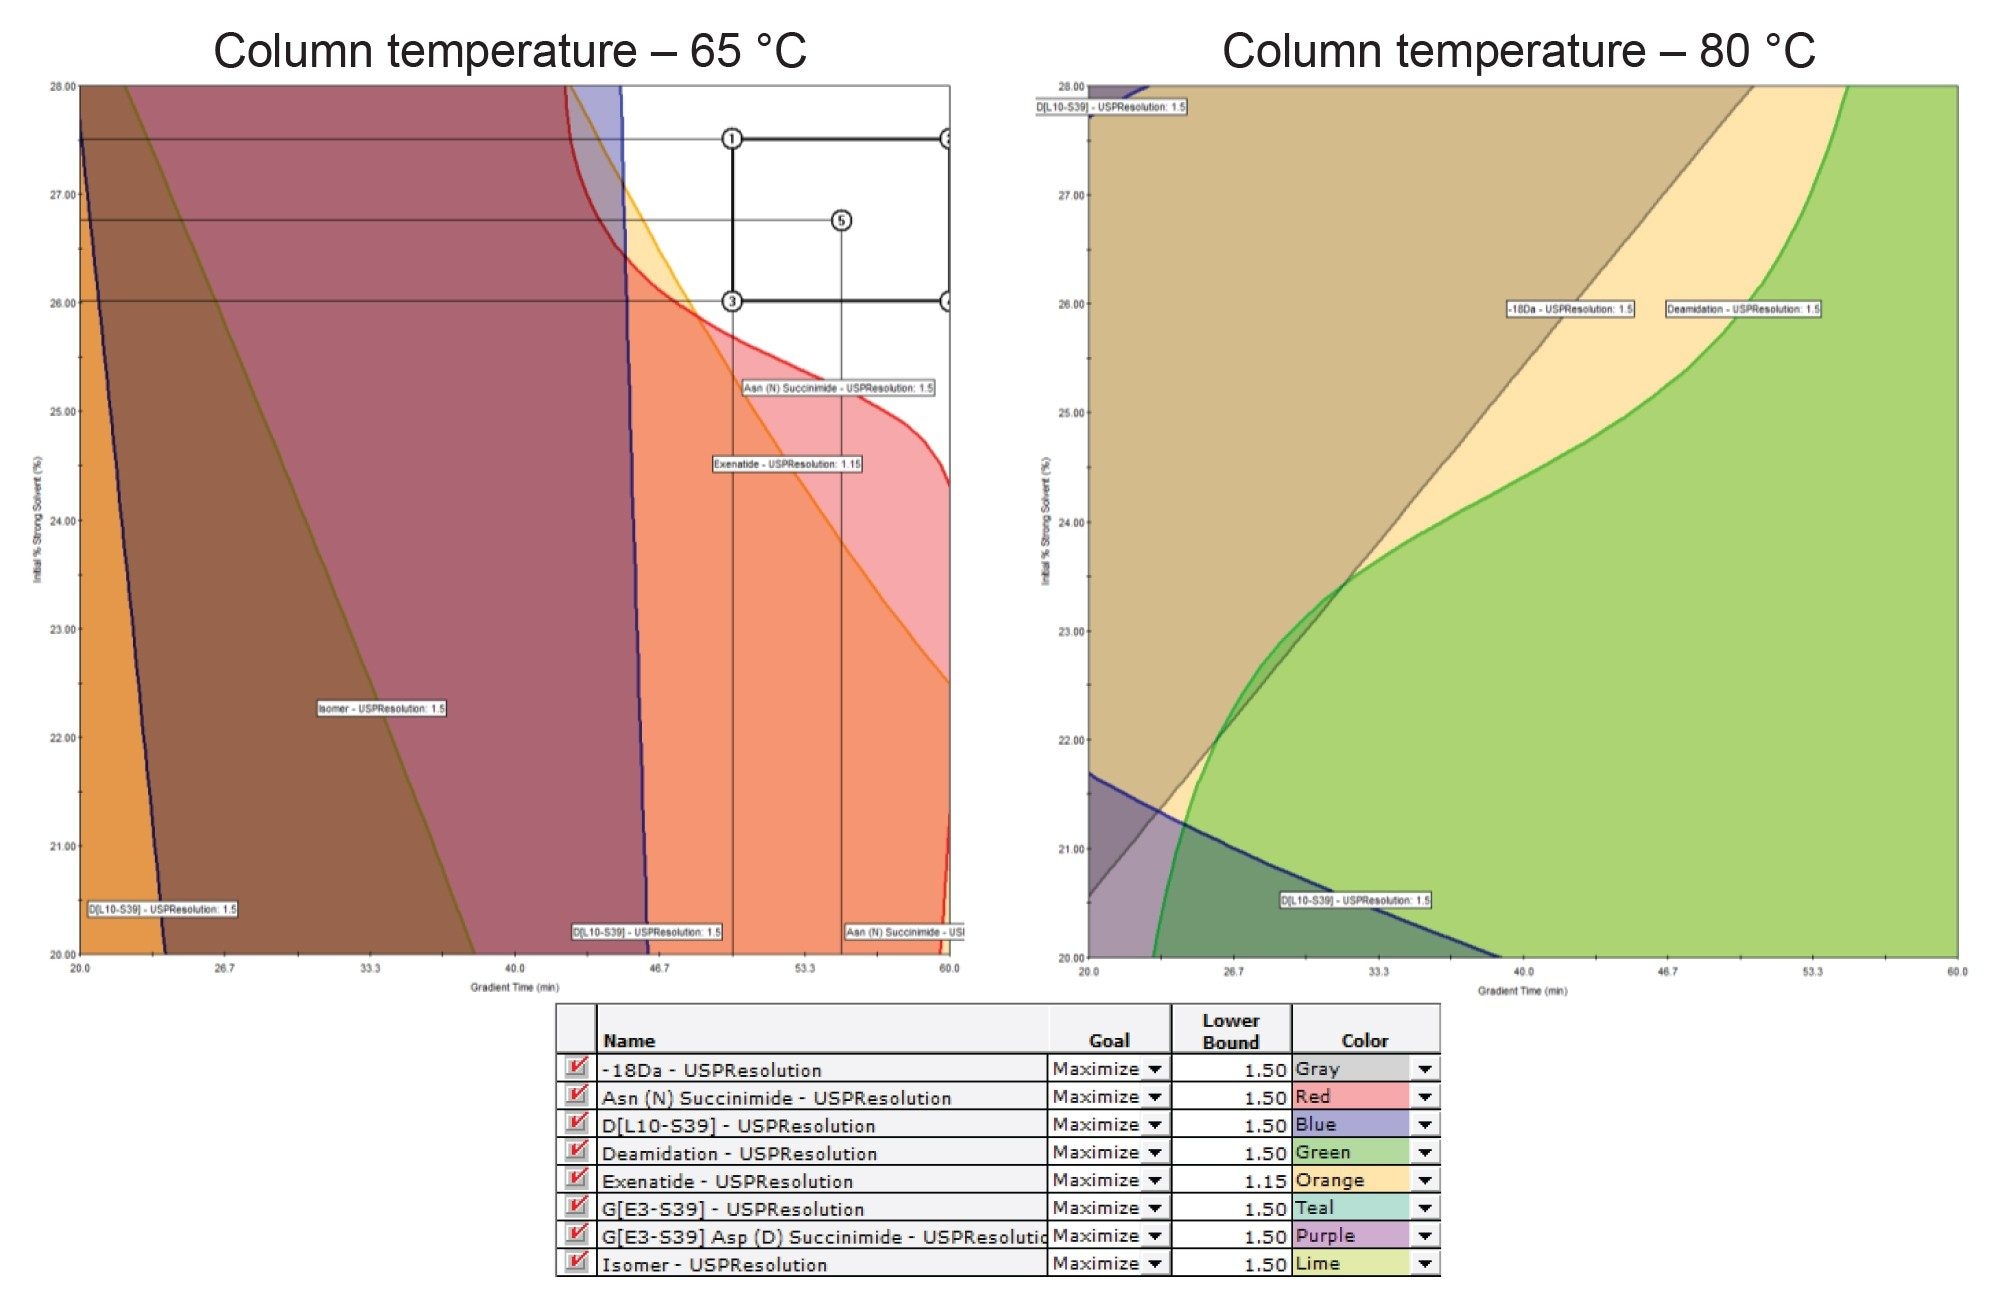
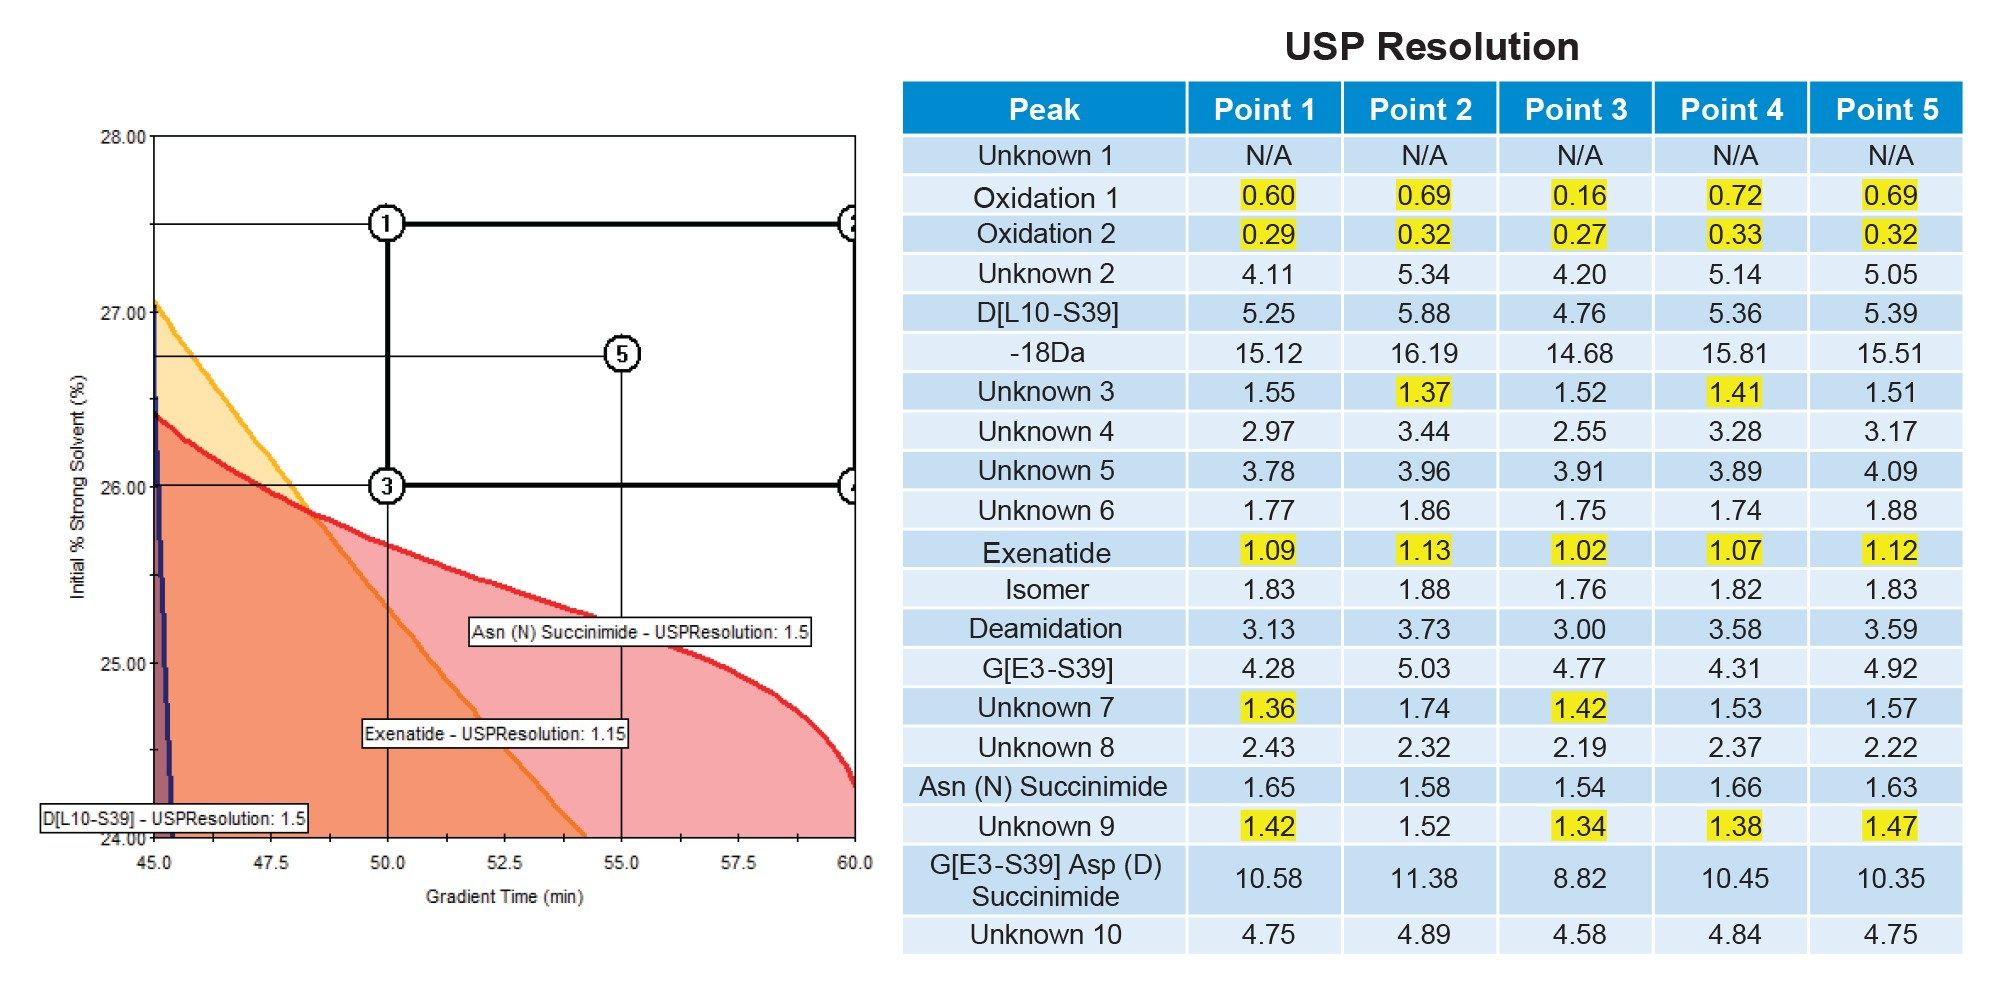
Since the initial optimization DoE identified 2 areas of interest, a final optimization DoE was designed to evaluate both unshaded regions. This final DoE assessed the effects of column temperature (65 °C or 80 °C), gradient time (20–60 minutes), and the initial strong solvent percent (20–28%). Method parameters previously identified as optimal, including flow rate (0.650 mL/min) and final strong solvent percentage (40%), were held constant. The performance metric used to evaluate these method conditions was a USP resolution of at least 1.5 for a majority of the identified product-related impurities from exenatide. As shown in Figure 7, an unshaded region met the USP resolution criteria for all relevant impurity peaks at 65 °C. In contrast, at 80 °C, several impurity peaks failed to meet the 1.5 USP resolution threshold, indicating that none of the evaluated conditions at this temperature achieved the desired separation. Therefore, the unshaded region identified at 65 °C was selected for establishing the MODR.
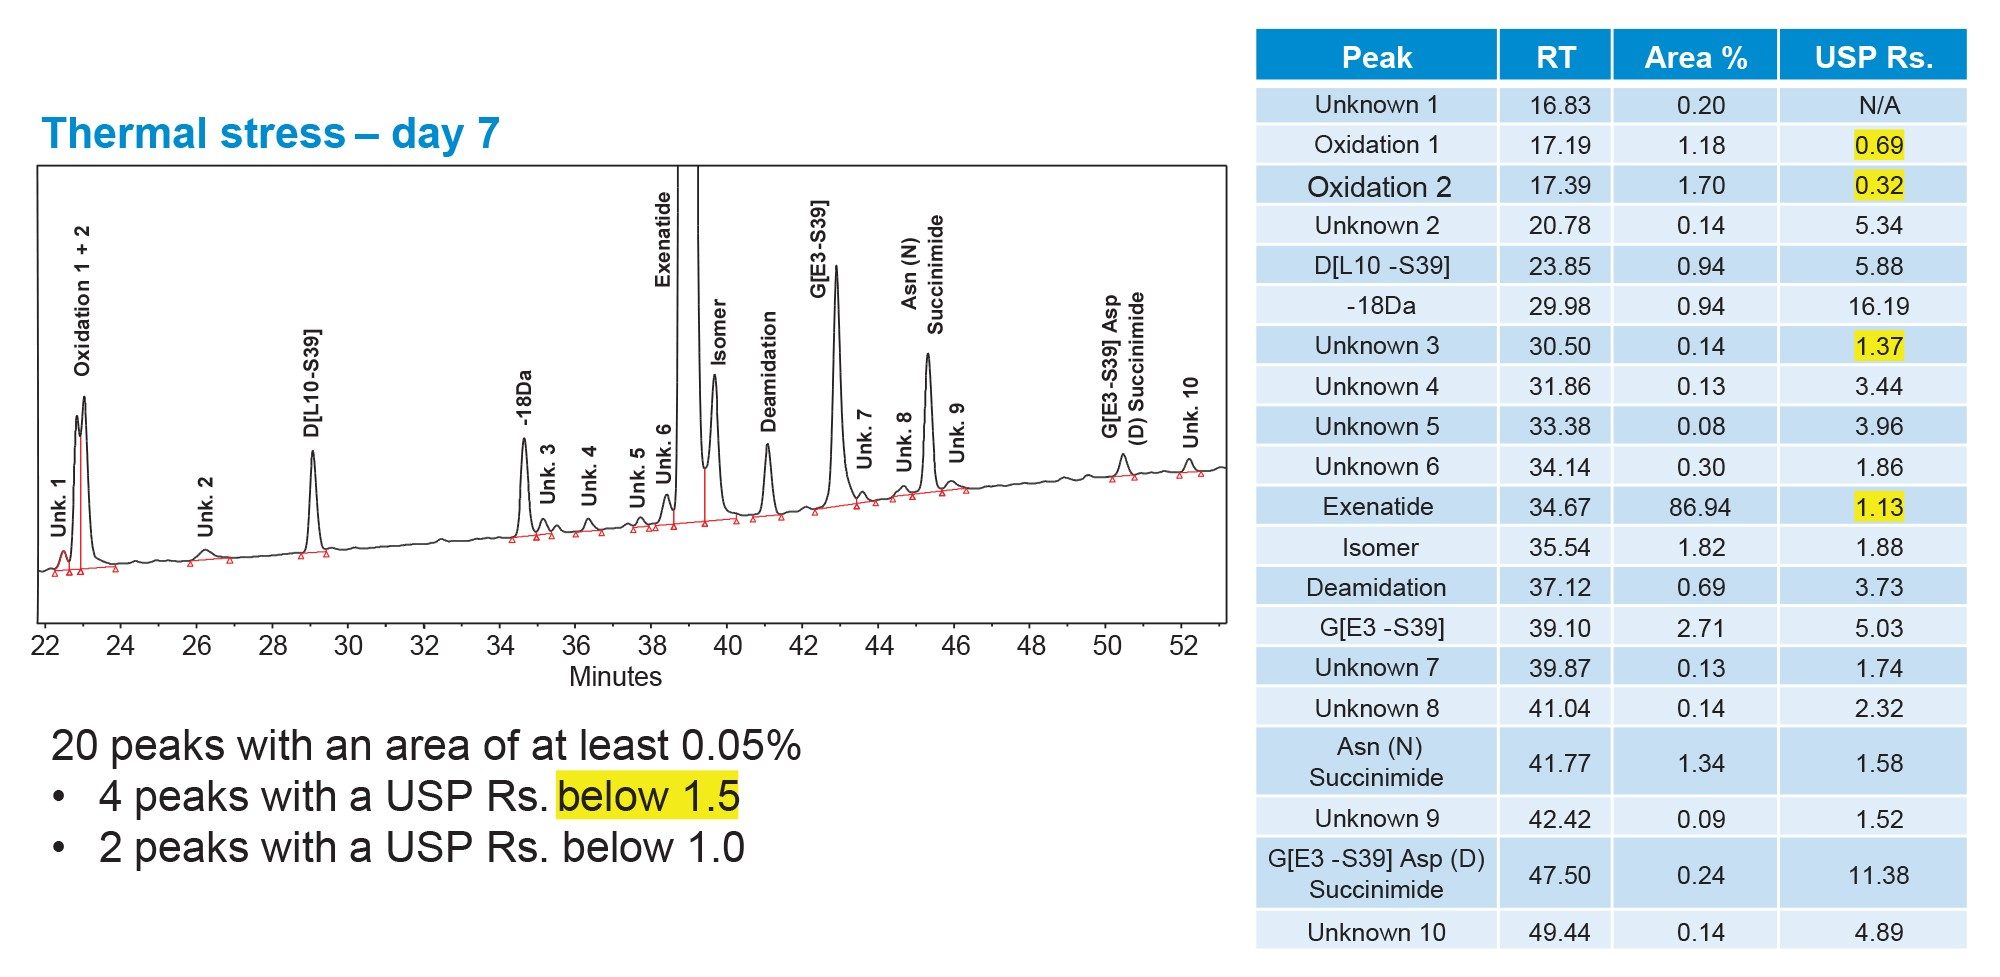
To verify the accuracy of the Fusion QbD model predictions, 5 selected MODR verification points were experimentally evaluated. A representative chromatogram is shown in Figure 8, where 20 peaks with an integrated area of at least 0.05% were observed. Of these 20 peaks, only 4 exhibited a USP resolution below 1.5, 2 of which were process-related impurities. The remaining 2 unresolved peaks corresponded to oxidized species eluting at the beginning of the chromatogram, which could not be fully resolved under any evaluated method conditions. Comparison of the USP resolution values across all 5 MODR verification points (Figure 9) demonstrates consistent performance throughout the MODR, rather than at a single set of conditions. Collectively, these results demonstrate that the methods established within the MODR achieve separation of the majority of process and product-related impurities in exenatide and may be suitable for routine monitoring on the Alliance iS Bio HPLC System.
Conclusion
This study demonstrates the effective application of an AQbD-based approach, consistent with the major principles outlined in ICH Q14, to systematically develop and optimize an impurity profiling method for exenatide. Through a structured screening and optimization strategy, key chromatographic variables influencing impurity detectability and separation were identified, enabling the detection of 20 process- and product-related impurities. The combined use of complementary UV and mass-based detection for impurity tracking, together with Fusion QbD Software for multivariate modeling, Pareto ranking, and resolution visualization maps, enabled data-driven decision making and establishment of a MODR. Evaluation of multiple system suitability metrics such as USP resolution and peak-to-valley ratio improved discrimination between partially resolved impurities and strengthened method understanding during optimization. Experimental verification of multiple MODR points demonstrated comparable method performance across the defined operating space. Overall, the developed method provides reliable separation of the majority of relevant exenatide impurities and is suitable for routine impurity monitoring on the Alliance iS Bio HPLC System.
References
- ICH Q14 Guideline on Analytical Procedure Development. International Council for Harmonisation of Technical Requirements for Pharmaceuticals for Human Use. November 2023.
- Han D, Ippoliti S, Birdsall RE, Nyholm K. Application of LC-UV/MS Workflows to Increase Efficiency in Impurity Profiling of GLP-1 Analogs. Waters Application Note. May 2025. 720008812.
- Han D, Ippoliti S, Birdsall RE, Nyholm K. Accelerating Method Development and Manufacturing of GLP-1 Analogs with LC-UV/MS. Waters Application Note. May 2025. 720008800.
- Chromatography. USP General Chapter <621>. 2022.
720009264, March 2026