Sequence Mapping of sgRNA Digests: Leveraging Xevo™ MRT Mass Spectrometer Performance and Streamlining Data Analysis with MAP Sequence 2.0
Catalin Doneanu, Alexandre F Gomes, Tatiana Johnston, Chris Preston, Matt Gorton, Bala Addepalli, Scott Berger, Ying Qing Yu
Waters Corporation, Milford, MA, United States
Published on November 18, 2025
Abstract
Recent advances in liquid chromatography-mass spectrometry (LC-MS) and bioinformatics technologies have enhanced our detailed understanding of therapeutic RNA molecules. This application note presents a compliance-ready workflow for sequence mapping of digested single-guide RNAs (sgRNA). The workflow incorporates sample preparation using a variety of digestion enzymes, including RNase T1 as well as RapiZyme™ MC1 and RapiZyme Cusativin ribonucleases. UPLC™-MSE data (DIA – data independent acquisition) was acquired on the Xevo MRT Mass Spectrometer and automated data analysis was performed with the waters_connect™ MAP Sequence Application (v2.0). The Xevo MRT Mass Spectrometer combines cutting-edge multi-reflecting time-of-flight technology with hybrid quadrupole time-of-flight (QTOF) capabilities, delivering sub-ppm mass accuracy that ensures confident identification of digested RNA products. In this study, complete (100%) sequence coverage of an sgRNA was achieved after combining the individual digestion results generated for all three enzymes investigated. The unique assignments for the accurate mass measurements of the sgRNA digestion products were confirmed by their fragmentation using the ramped elevated energy MSE fragmentation performed in the collision cell on the Xevo MRT Mass Spectrometer.
Benefits
- Confident characterization of sgRNA ribonuclease digestion products with sub-ppm average root mean square (RMS) mass accuracy for both digestion product precursors and their corresponding fragment ions
- A compliance-ready informatics workflow featuring the waters_connect MAP Sequence Application (v2.0) streamlines oligonucleotide sequence mapping of sgRNA digests
- RapiZyme MC1 and RapiZyme Cusativin, two recently introduced ribonucleases, offer unique cleavage specificity and the opportunity to generate overlapping digestion products, enabling complete (100%) and confident sequence coverage for sgRNAs
Introduction
sgRNAs were first described in 2012,1 when two RNA molecules essential for CRISPR-Cas9-mediated DNA cleavage— the trans-activating CRISPR RNA (tracrRNA), which serves as a scaffold for the Cas9 nuclease and the CRISPR RNA (crRNA), responsible for DNA target recognition— were fused into a single RNA construct. This fusion created the sgRNA, a critical component of the CRISPR-Cas9 gene editing system.1,2 The sgRNA molecule directs the Cas9 nuclease to introduce precise double-stranded breaks in DNA, enabling targeted genetic modifications.
Since its discovery, which was honored with the 2020 Nobel Prize in Chemistry, CRISPR technology has transformed gene editing applications. Beyond basic research, it has been adapted for rapid diagnostic tools, such as COVID-19 tests developed during the 2020 global pandemic,3 and holds promise for therapeutic interventions in genetic diseases, cancer, and infectious diseases. As sgRNAs are typically synthesized via solid-phase oligonucleotide synthesis, their analytical characterization requires confirmation of both the intact molecular weight4 and the sequence verification to ensure functional accuracy.5
Traditional LC-MS workflows for sgRNA digest oligo mapping have been labor-intensive and time-consuming, relying heavily on manual data analysis and interpretation. Recently,6 a UPLC-MSE (DIA) and informatics workflow was presented that was designed for automated sgRNA sequence mapping following enzymatic digestion with a panel of ribonucleases, including RNase T1, hRNAse 4, and two RNase T2 enzymes: RapiZyme MC1 and Cusativin.
This application note extends the capability of this workflow (Figure 1) when implemented on a Xevo MRT Mass Spectrometer (Figure 1), focusing on the multi-enzyme digestion of the Waters sgRNA LC-MS standard, where complete sequence coverage for the digested products and sequence-confirming fragmentation was obtained.
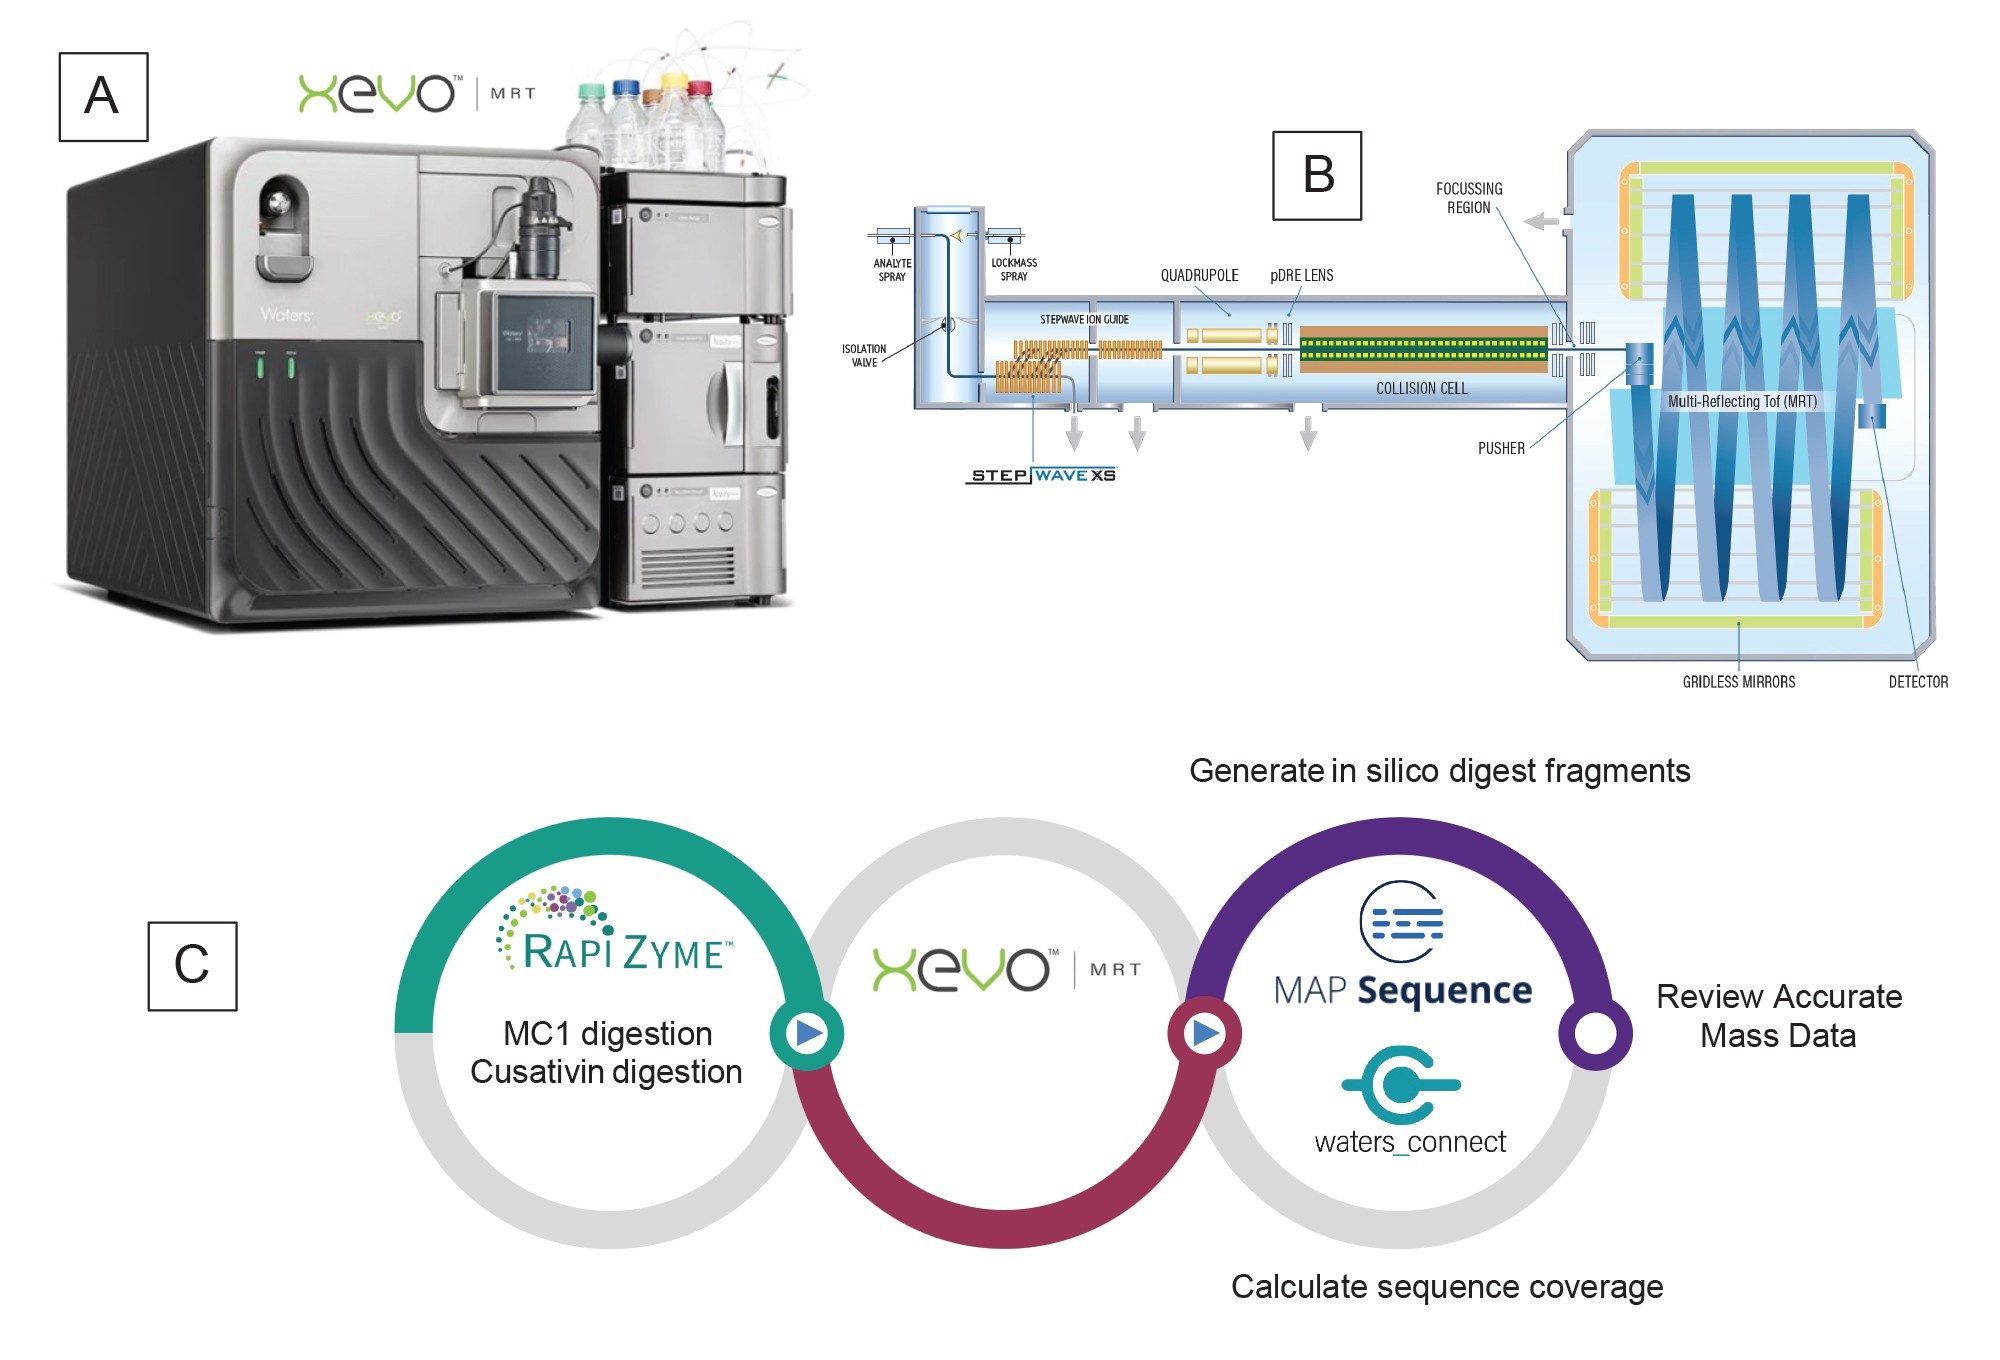
Figure 1. (A) Xevo MRT (Multi-Reflecting Time-of-flight) QTOF Mass Spectrometer with the ACQUITY Premier System; (B) Schematic diagram of the Xevo MRT QTOF Mass Spectrometer; (C) Workflow diagram for UPLC-MSE processing of sgRNA digests using the MAP Sequence App v2.0.
Experimental
Reagents and Sample Preparation
N,N-diisopropylethylamine (DIPEA, 99.5% purity, catalog number 387649-100 ML) was purchased from MilliporeSigma (St Louis, MO) and 1,1,1,3,3,3-hexafluoro-2-propanol (IonHance™ HFIP, p/n:186010781) was obtained from Waters (Milford, MA). Methanol (LC-MS grade, catalog number 34966-1L) and acetonitrile (LC-MS grade, catalog number 34967-6XL) were obtained from Honeywell (Charlotte, NC). HPLC grade Type I deionized (DI) water was purified using a Milli-Q® system (Millipore, Bedford, MA). Mobile phases were prepared fresh daily. Ultrapure nuclease-free water (catalog number J71786.AE) for sgRNA digestions was purchased from Thermo Fisher Scientific (Waltham, MA).
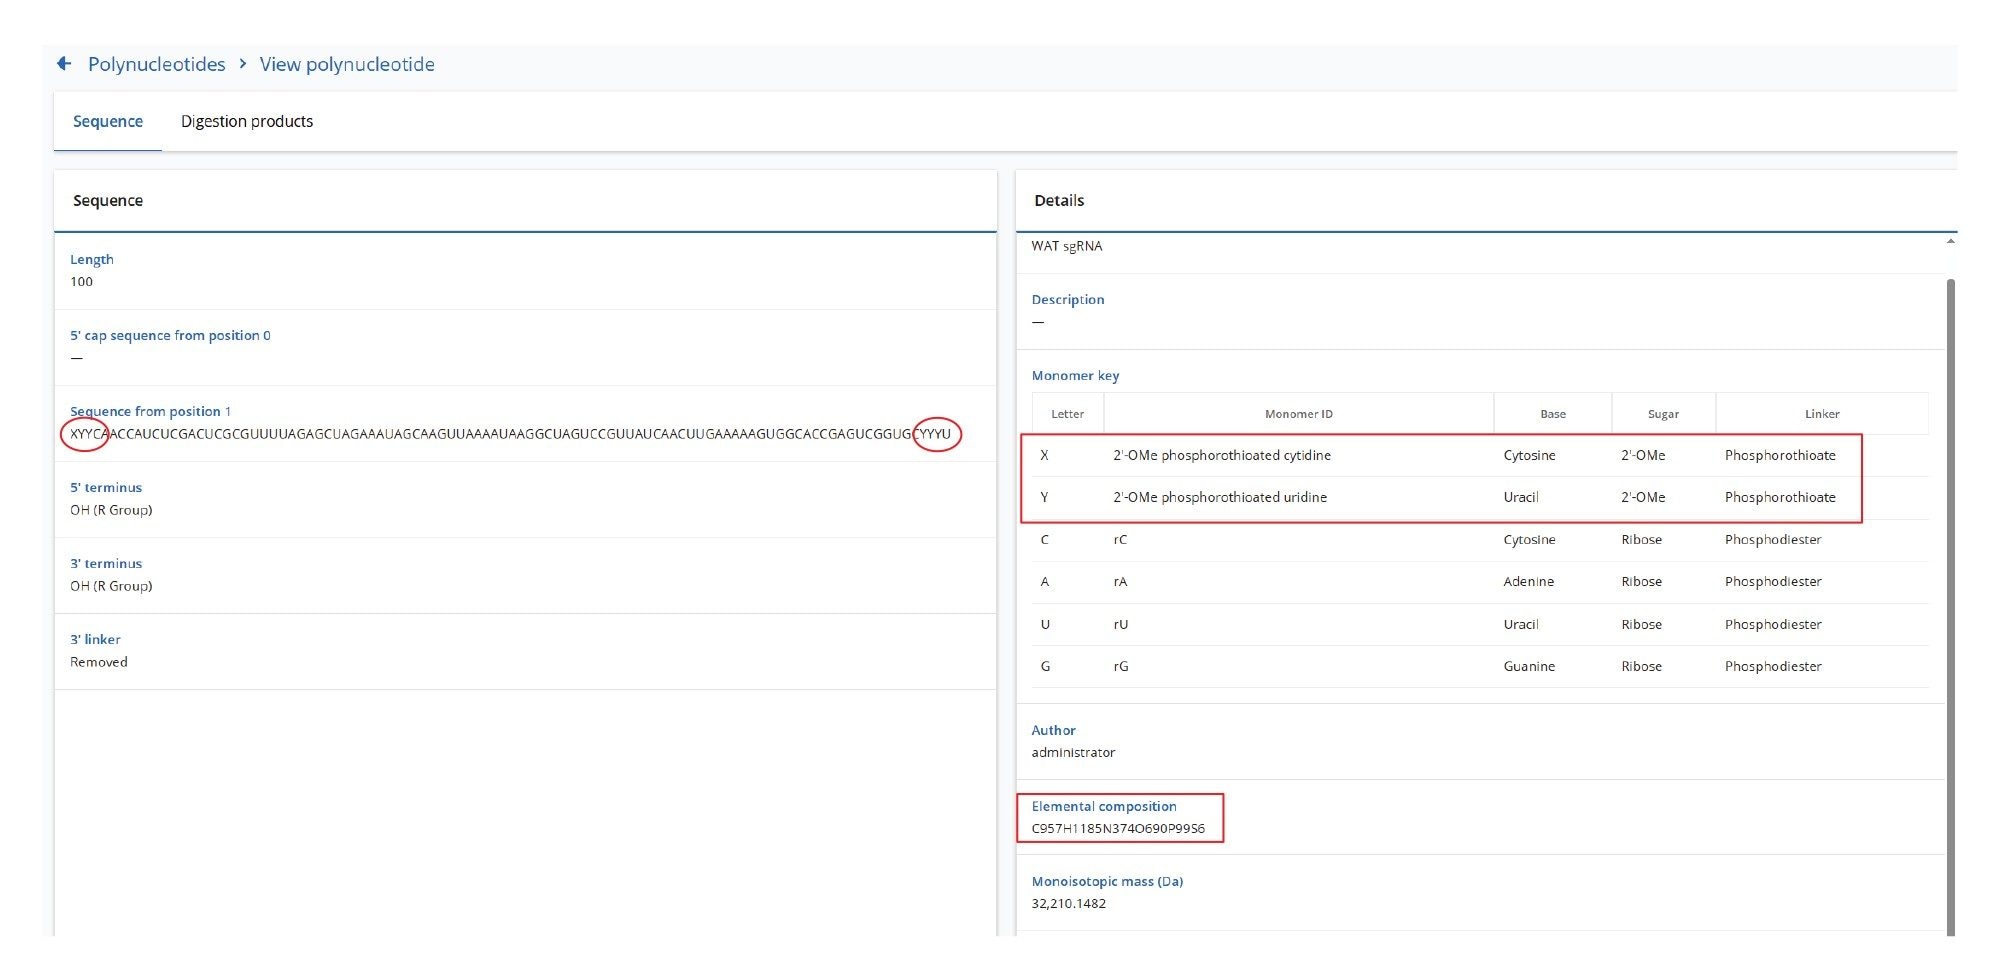
The Waters sgRNA LC-MS Standard (p/n: 186011357) is a 100-mer sgRNA, encoding specifically for the mouse GATA2 transcription factor. Its sequence is: 5’ - C*U*U* CAA CCA UCU CGA CUC GCG UUU UAG AGC UAG AAA UAG CAA GUU AAA AUA AGG CUA GUC CGU UAU CAA CUU GAA AAA GUG GCA CCG AGU CGG UGC U*U*U* U-3’. It contains a 2’-OMe modification on its first three 5’ nucleotides (C*U*U*, denoted as the XYY sequence as shown in Figure 9), as well as on its last three 3’ nucleotides (U*U*U*, sequence YYY in Figure 9). The asterisk indicates that all these six nucleotides are phosphorothioated. A 50 µM stock solution of the Waters sgRNA LC-MS Standard was prepared using nuclease-free water.
Fungus-derived animal free purified ribonuclease T1 (catalogue no IFGRNASET1AFLY500KU) was ordered from Innovative Research (Novi, MI) and the lyophilized enzyme was dissolved in 5 mL of 100 mM ammonium bicarbonate (catalogue no 5.33005-50G, MilliporeSigma) to prepare a solution containing 100 units/µL. For sgRNA digestion with RNase T1, 2 µL of 5 µM sgRNA were mixed with 28 µL of nuclease-free water and denatured at 90 oC for 2 minutes. Next, 10 µL of RNase T1 enzyme (1000 units) were added and the digestion was allowed to proceed at 37 oC for 15 minutes. The digestion mixture was prepared in a QuanRecovery™ MaxPeak™ 300 µL Vial. The digest was analyzed immediately by LC-MS using 5 µL injections.
The digestion protocols used for RapiZyme MC1 (Waters p/n: 186011190, 10000 units/tube) and RapiZyme Cusativin (p/n: 186011192, 10000 units/tube) are very similar. For RapiZyme MC1, the sgRNA (10µL, 5 µM solution) was denatured at 90 oC for 2 minutes in a buffer containing 200 mM ammonium acetate (catalog no AM9071-500ML, Thermo Fisher, Waltham, MA), pH 8.0. For RapiZyme Cusativin, the sgRNA (10µL, 5 µM solution) was denatured at 90 oC for 2 minutes in a buffer containing 200 mM ammonium acetate, pH 9.0. Both samples were cooled on ice and spun in a microcentrifuge to collect the sample droplets. After adding 50 units of digestion enzyme (1 µL of either RapiZyme MC1 or Cusativin) and 9 µL of nuclease-free water to obtain a final volume of ~ 20 µL, the sgRNA was digested at 30 oC for 30 minutes in an Eppendorf® thermomixer. The enzymatic digestion was stopped by exposure to 70 ºC for 15 minutes for MC1 digesions, and to 75 ºC (15 minutes) for Cusativin, in order to inactivate the enzymes. The digest was analyzed immediately by LC-MS using 5 µL injections.
All datasets were acquired with waters_connect Informatics Platform (v4.1.0.17) and subsequently processed using the SYNTHETIC Library App (v 2.0) and the MAP Sequence App (v2.0).
LC Conditions
|
LC-MS system: |
Xevo MRT (multi-reflecting time-of-flight) QTOF Mass Spectrometer coupled with ACQUITY™ Premier UPLC (Binary) System |
|
Column: |
ACQUITY Premier Oligonucleotide BEH™ C18 Column 300 Å, 1.7 µm, 2.1 x 150 mm, (p/n: 186010541) |
|
Column temperature: |
70 °C |
|
Flow rate: |
400 µL/min |
|
Mobile phases: |
Solvent A: 0.1% DIPEA (N,N-diisopropylethylamine), 1% HFIP (1,1,1,3,3,3-hexafluoroisopropanol) in DI water, pH 8.5 Solvent B: 0.0375% DIPEA, 0.075% HFIP in 65% acetonitrile |
|
Sample temperature: |
8 °C |
|
Sample vials: |
QuanRecovery MaxPeak HPS Vials (p/n: 186009186) |
|
Injection volume: |
5 µL |
|
Wash solvents: |
Purge solvent: 10% methanol in DI water Sample manager wash solvent: 50% MeOH Seal wash: 10% methanol in DI water |
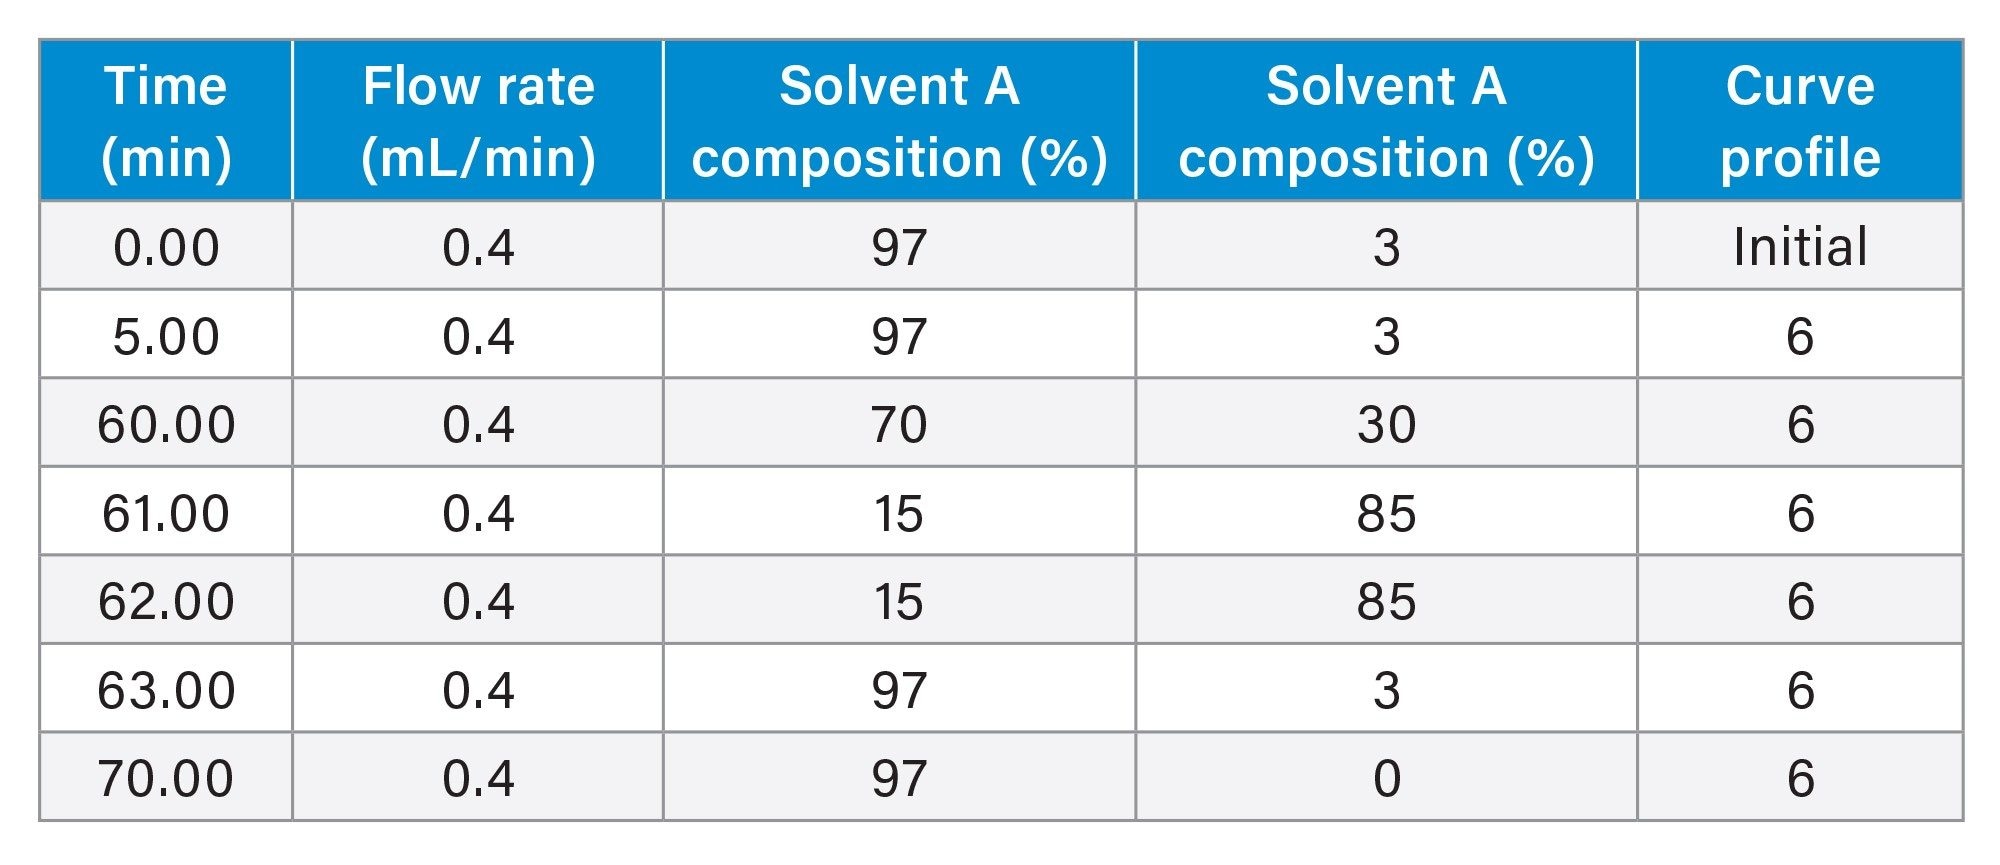
Gradient Table
MS Conditions
|
MS system: |
Xevo MRT QTOF Mass Spectrometer |
|
Ionization mode: |
ESI(-) |
|
Acquisition mode: |
MSE |
|
Acquisition rate: |
2 Hz |
|
Capillary voltage: |
1.5 kV |
|
Cone voltage: |
40 V |
|
Source offset: |
10 V |
|
Source temperature: |
120 oC |
|
Desolvation temperature: |
550 °C |
|
Cone gas flow: |
0 L/h |
|
Desolvation gas flow: |
1000 L/hr |
|
TOF mass range: |
50–4000 (MSE acquisition) |
|
Low energy CE: |
6 V |
|
High energy CE ramp: |
15 to 25 V |
|
Lock-mass: |
50 pg/µL Leu Enk in 0.1% formic acid, 50% ACN |
|
Data acquisition: |
waters_connect Informatics Platform v4.1.0.17 |
|
Data processing: |
SYNTHETIC Library v2.0 MAP Sequence v2.0 |
Results and Discussion
An informatics workflow (Figure 1) featuring the waters_connect MAP Sequence App (v 2.0) was used to facilitate automated data processing of UPLC-MSE datasets acquired following the enzymatic digestion (in separate reactions) of an sgRNA standard with three different enzymes: RNase T1, RapiZyme MC1, and RapiZyme Cusativin.6,7 The informatics processing workflow consisted of three steps which performed within the waters_connect MAP Sequence v 2.0 App:
1. In-Silico Digestion: The app generates predicted, in-silico digested oligonucleotide digestion products and sequence coverage, based on selecting the target sgRNA sequence from the SYNTHETIC Library App v 2.0 and the digestion enzyme of choice. Combined sequence coverage from multiple enzyme digests can also be displayed.
2. Data Processing and Mass-based Peak Assignments: The App processes the UPLC-MSE data, matching the in-silico predicted neutral monoisotopic masses of digested oligonucleotides to the experimentally acquired MS1 data. In addition, the elevated energy MSE data channel is used for assigning the corresponding fragment ions to each digestion product, therefore increasing the confidence for all digestion product assignments and enabling the resolution of ambiguous isomeric and isobaric nucleotides.
3. Sequence Coverage Visualization: The resulting sequence coverage for each sgRNA digest is summarized and visualized in the Results section. The combined sequence coverage obtained from multiple digest runs can also be displayed.
All data acquisition and processing were conducted within the waters_connect Informatics Platform, designed for users requiring software tools that maintain data integrity and support organizations subjected to regulatory scrutiny.
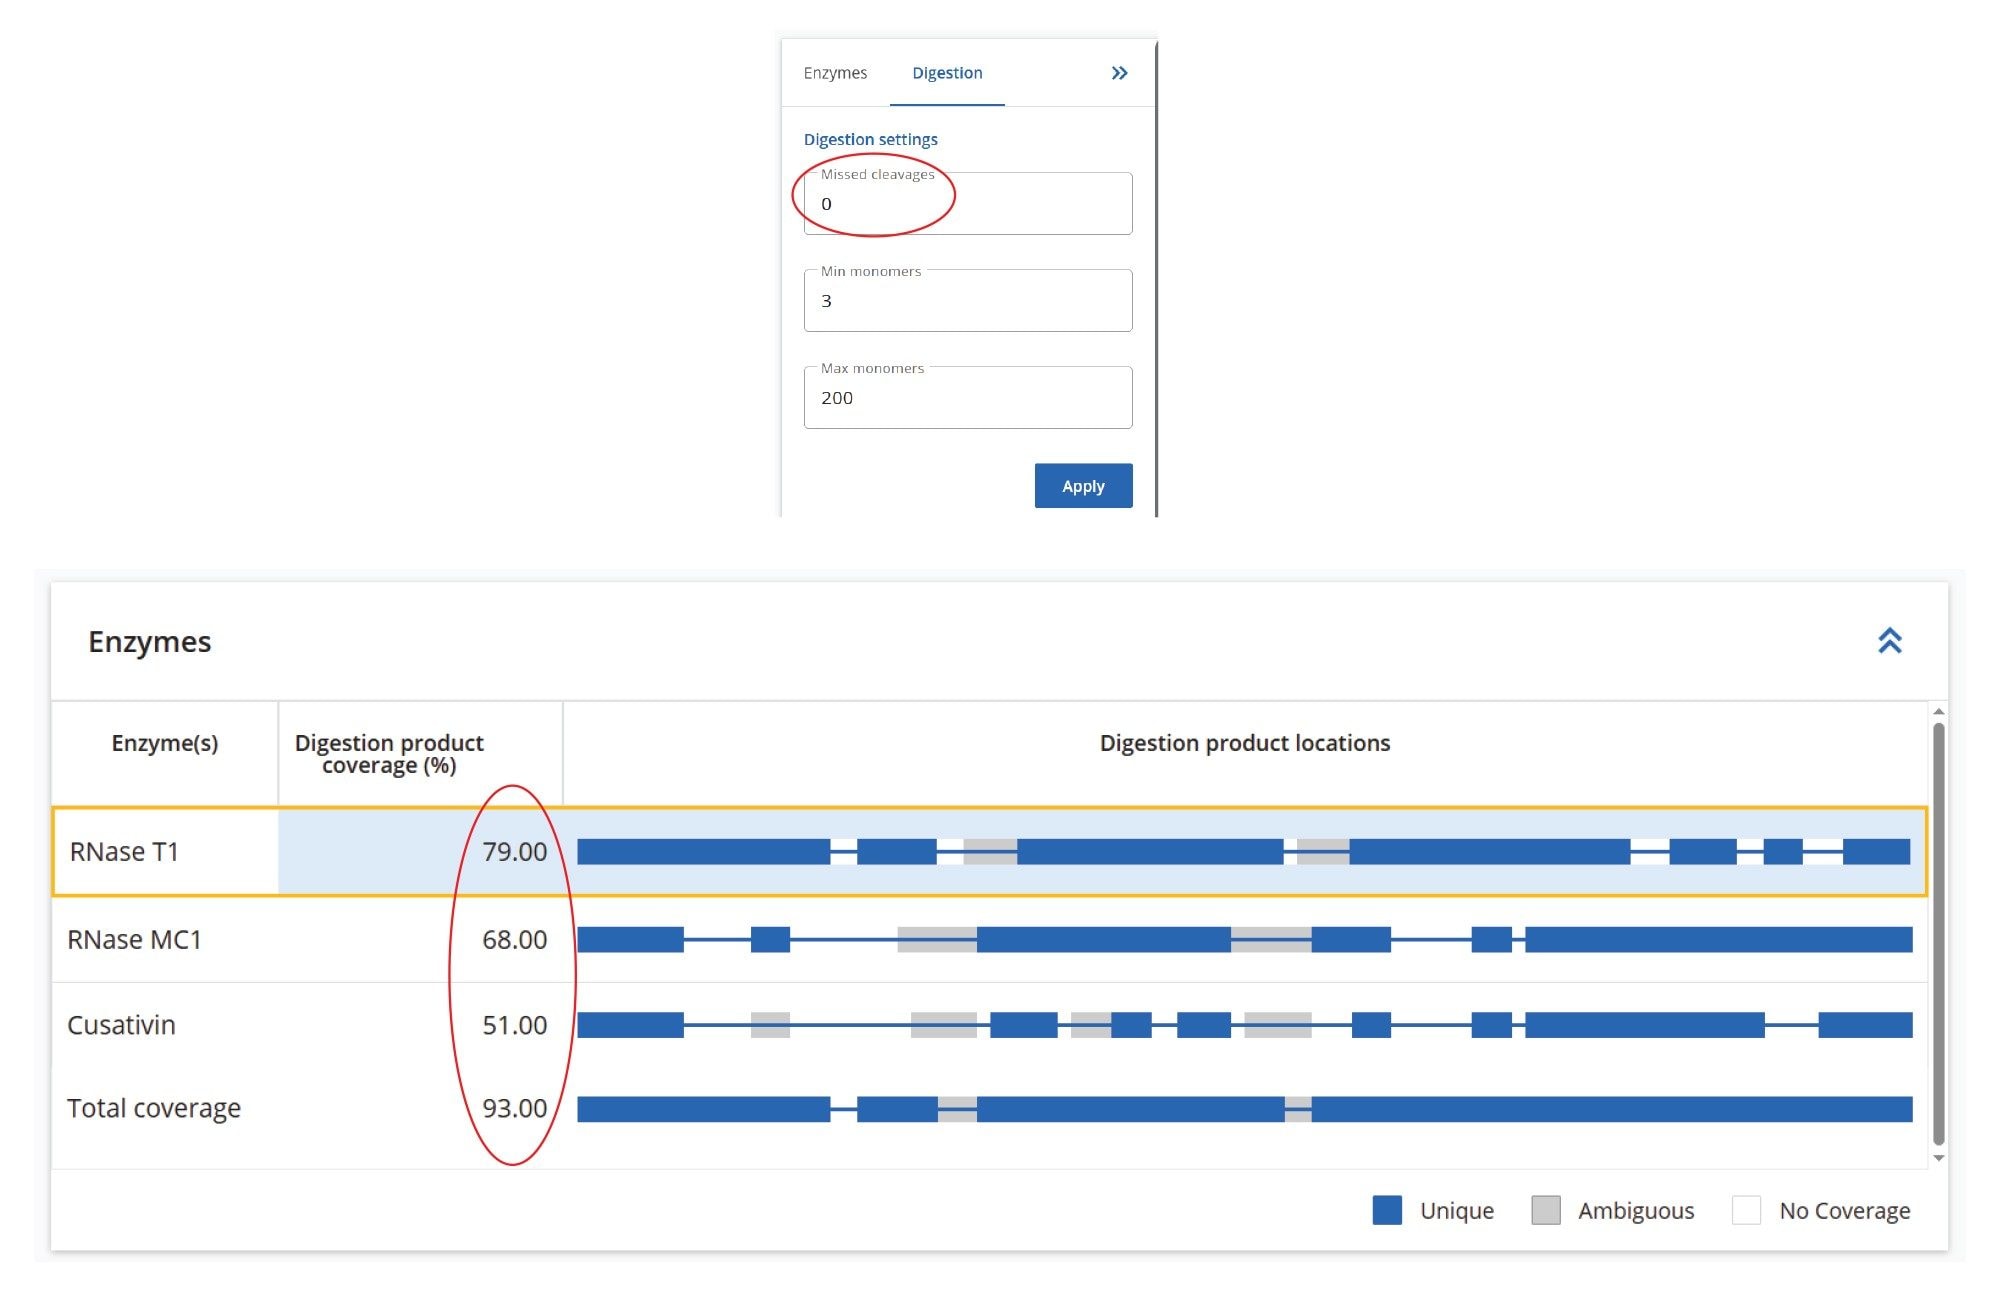
The data processing workflow begins with entering the sgRNA sequence into the SYNTHETIC Library App (v2.0), as illustrated in Figure 2. The Waters sgRNA standard includes two modified nucleotides: a 2’-OMe phosphorothioated cytidine, designated as nucleotide X, and a 2’-OMe phosphorothioated uridine, designated as nucleotide Y (see Figures 2 and 8 for the complete sgRNA sequence). Based on this sequence, the App automatically calculated the elemental composition as well as the monoisotopic and average masses of the 100-mer oligonucleotide. In addition, the SYNTHETIC Library App predicted sequence coverage for the same sgRNA digested with various enzymes. The predicted sequence coverages (Figure 3) for the Waters sgRNA Standard individually digested with three enzymes— RNase T1, RapiZyme MC1, and RapiZyme Cusativin— is displayed with the assumption of no missed cleavages. This predictive capability highlights how combining the individual sequence coverage results from multiple enzyme mapping analyses can potentially increase the overall sequence coverage of the RNA substrate.
Three UPLC-MSE datasets were acquired for the Waters sgRNA LC-MS oligo Standard digested with RNase T1, RapiZyme MC1 and RapiZyme Cusativin. These datasets were acquired on the Xevo MRT Mass Spectrometer (Figure 1A,B), which uses MRT to achieve exceptional MS resolution, speed, sensitivity with sub-ppm mass accuracy for precursors and fragment ions.
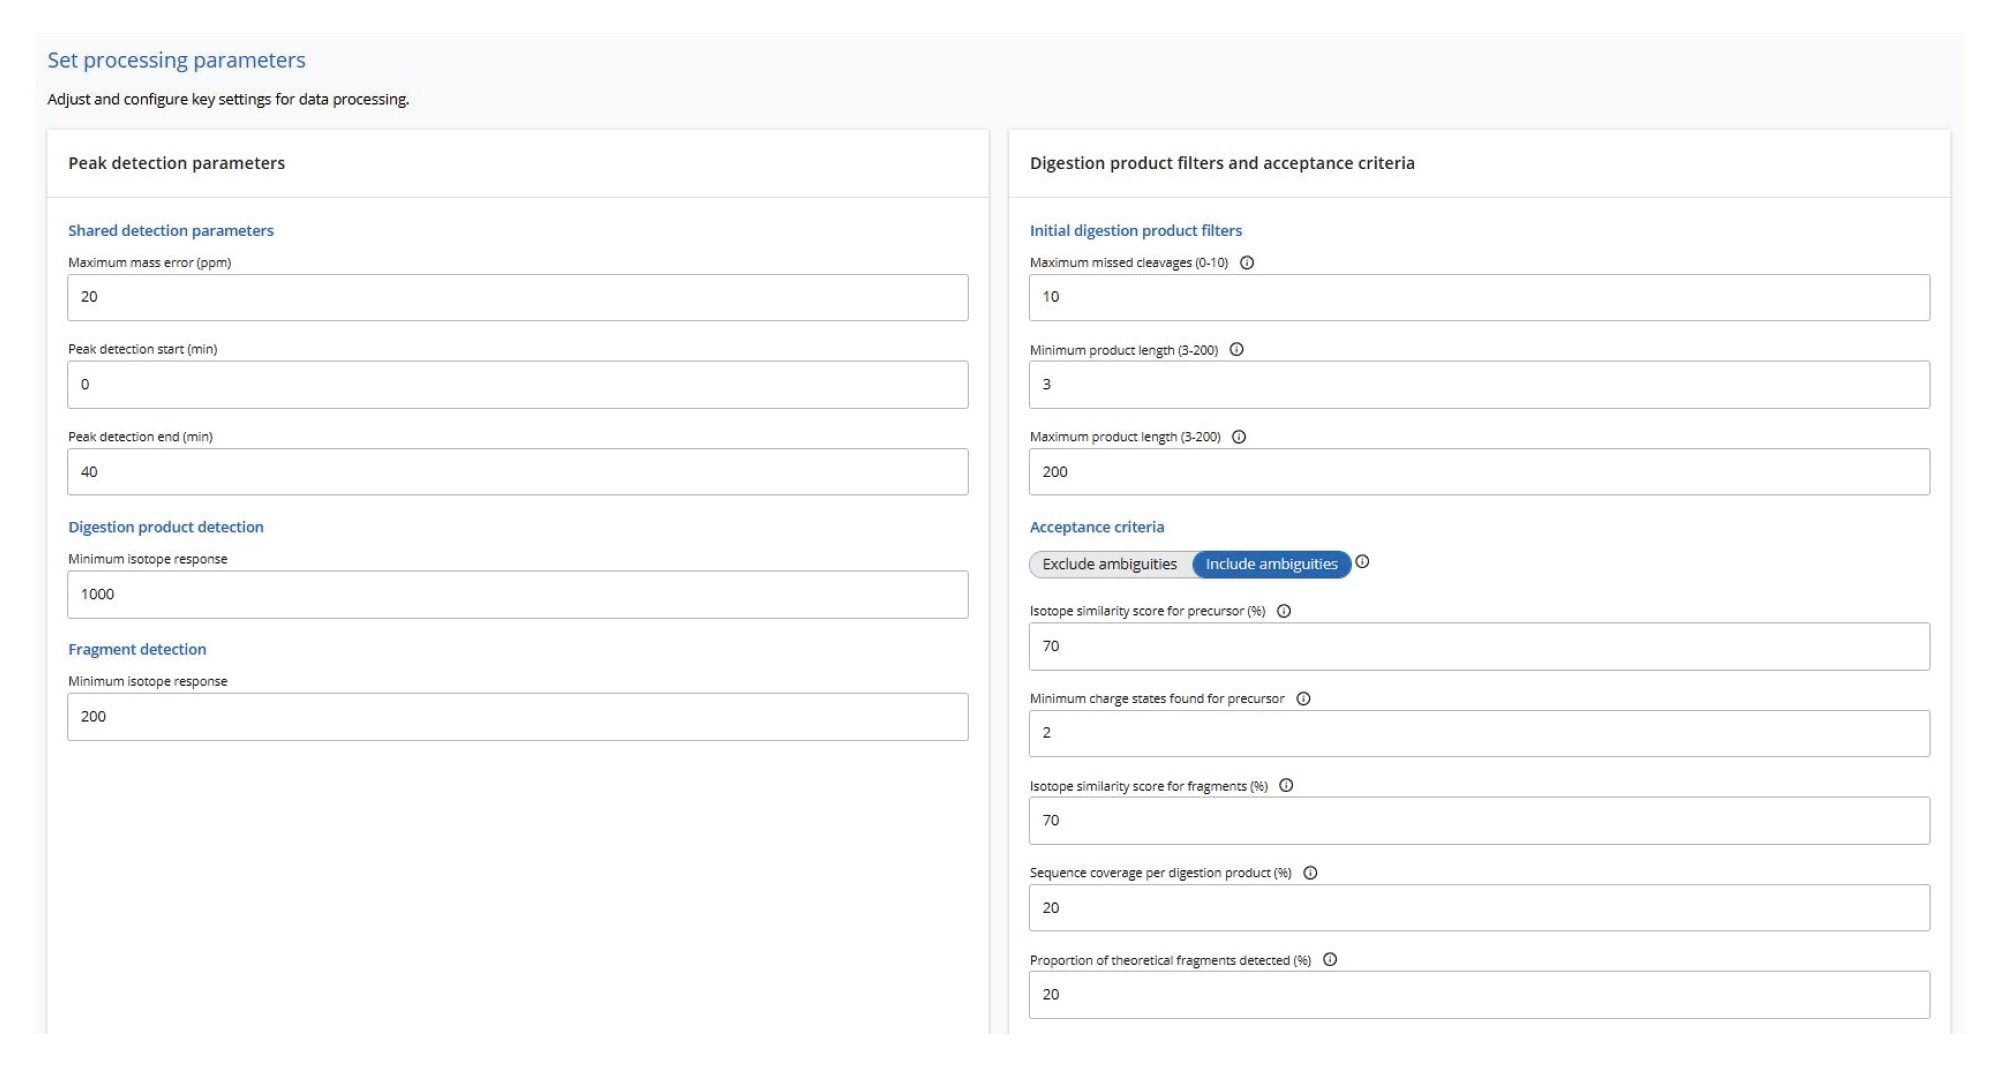
Automated processing of all datasets was carried out using the waters_connect MAP Sequence App (ver 2.0), applying the processing parameters as shown in Figure 4. Both data channels— low-energy MSE for digested oligonucleotide precursors and elevated-energy MSE for their corresponding fragment ions— were analyzed with a maximum mass error tolerance of 20 ppm. The initial search allowed for up to 10 missed cleavages, although filtering options can be applied to display results with fewer missed cleavages. Isotopic distributions of both precursor and fragment ions were assessed using an isotope similarity score to ensure high-quality matches between theoretical and experimental patterns, typically requiring a score of at least 70 out of 100. For fragment ions, additional criteria included a minimum sequence coverage of 20% per digested oligonucleotide product and detection of at least 20% of the theoretical fragment ions for that oligonucleotide.
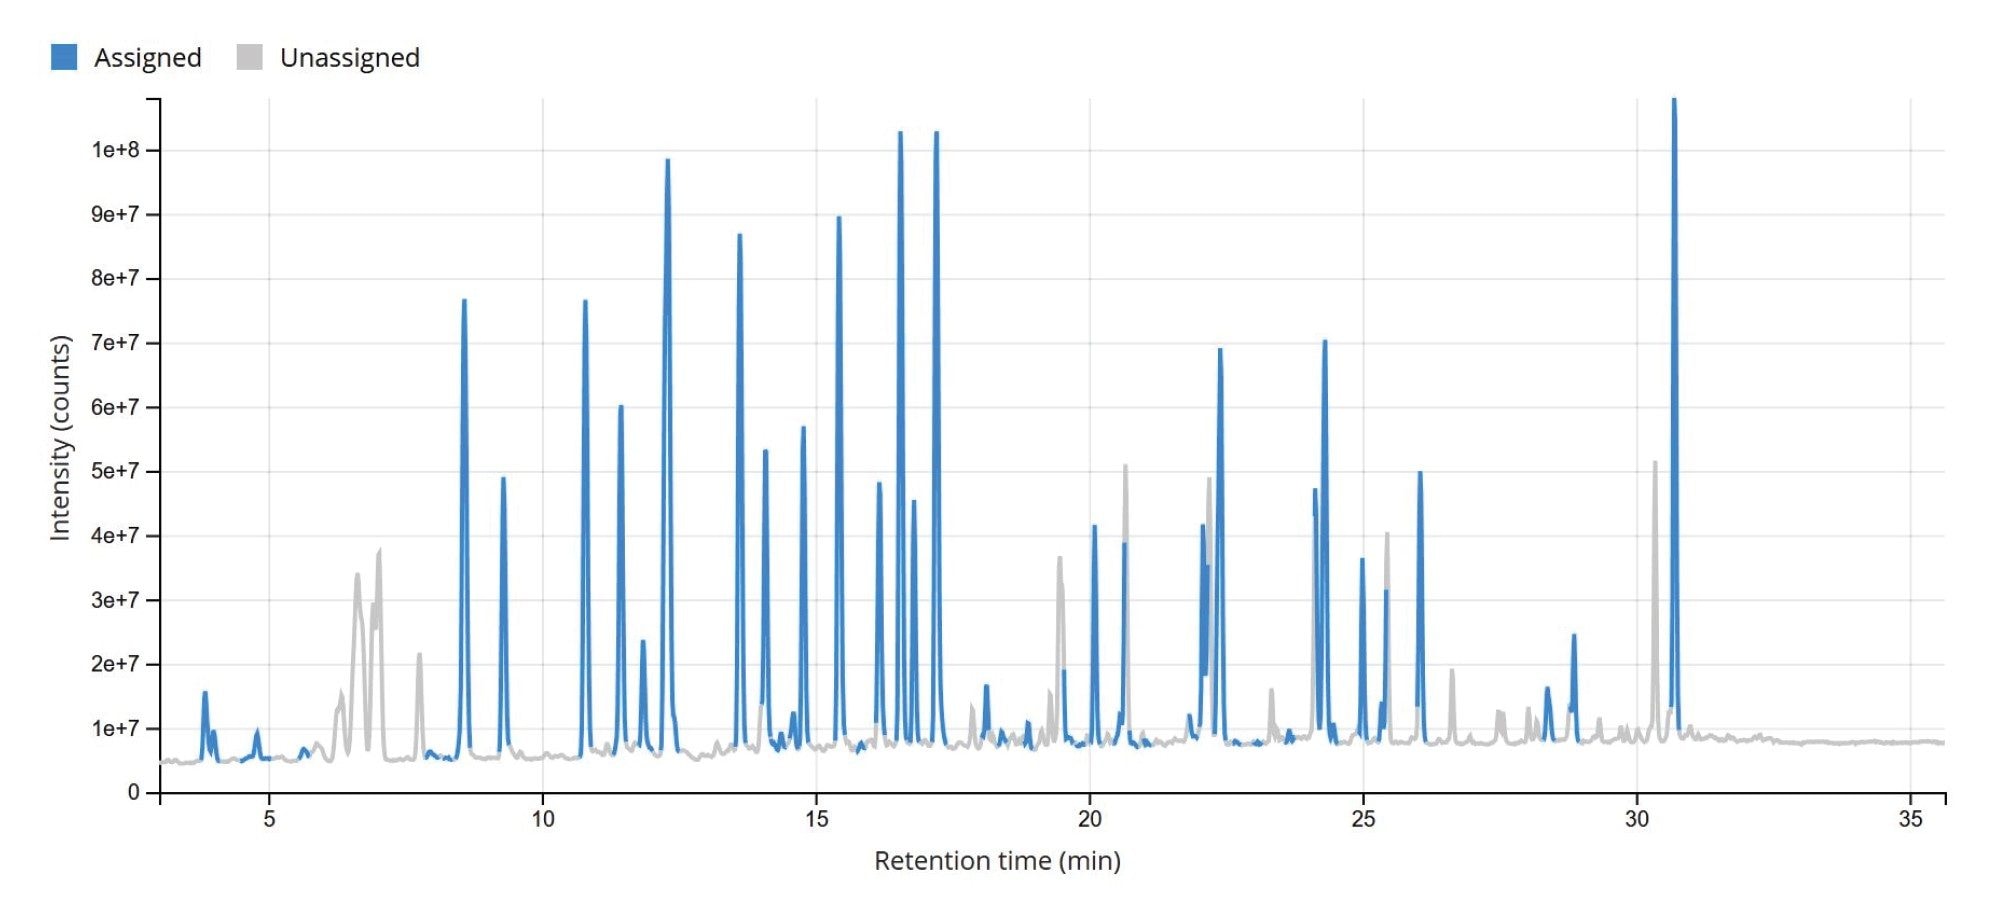
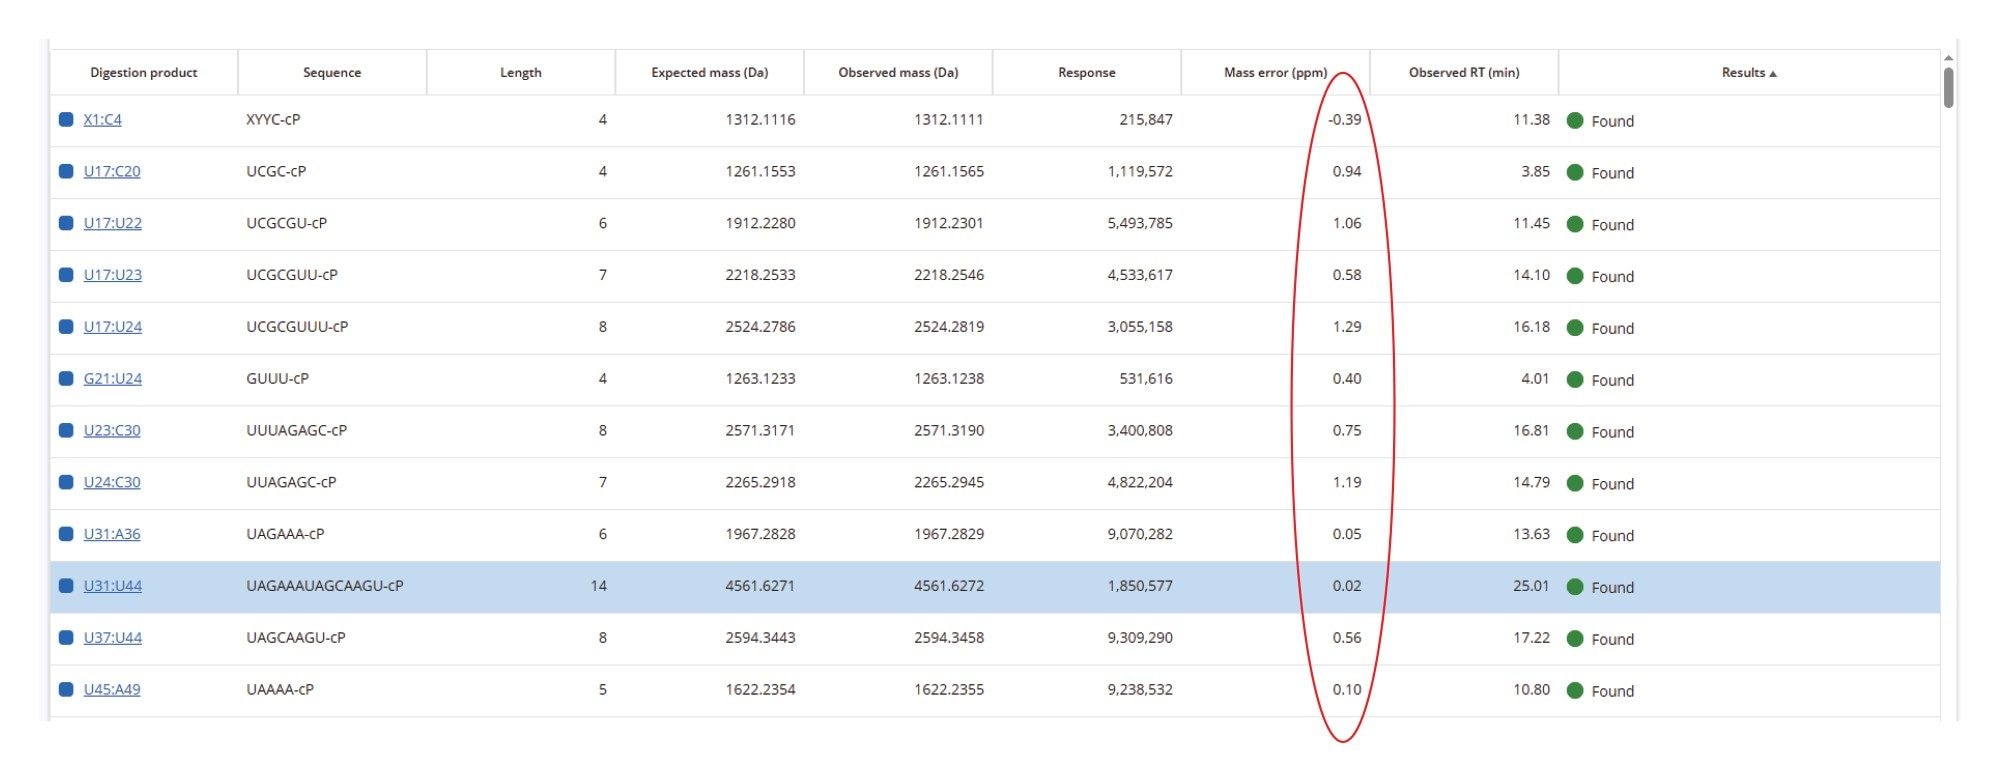
The TIC chromatogram resulting from the digestion of Waters sgRNA with RapiZyme MC1 is displayed within the MAP Sequence App v2.0, as shown in Figure 5. The blue trace indicates that the majority of the detected chromatographic signal corresponds to theoretically predicted MC1 digestion products. A portion of the results table, generated using the processing parameters outlined in Figure 4, is shown in Figure 6. Green circles next to each digestion product denote unique identifications based on both low-energy MSE data (precursor ions) and elevated-energy MSE data (fragment ions). All digestion products were confidently identified by matching experimentally observed monoisotopic oligonucleotide precursor masses to their in-silico predicted counterparts. The average RMS mass accuracy across all assigned digestion products was within the sub-ppm range (<1 ppm). Additional details for each assigned precursor are accessible by clicking the corresponding sequence, highlighted in blue in the left column of the table.
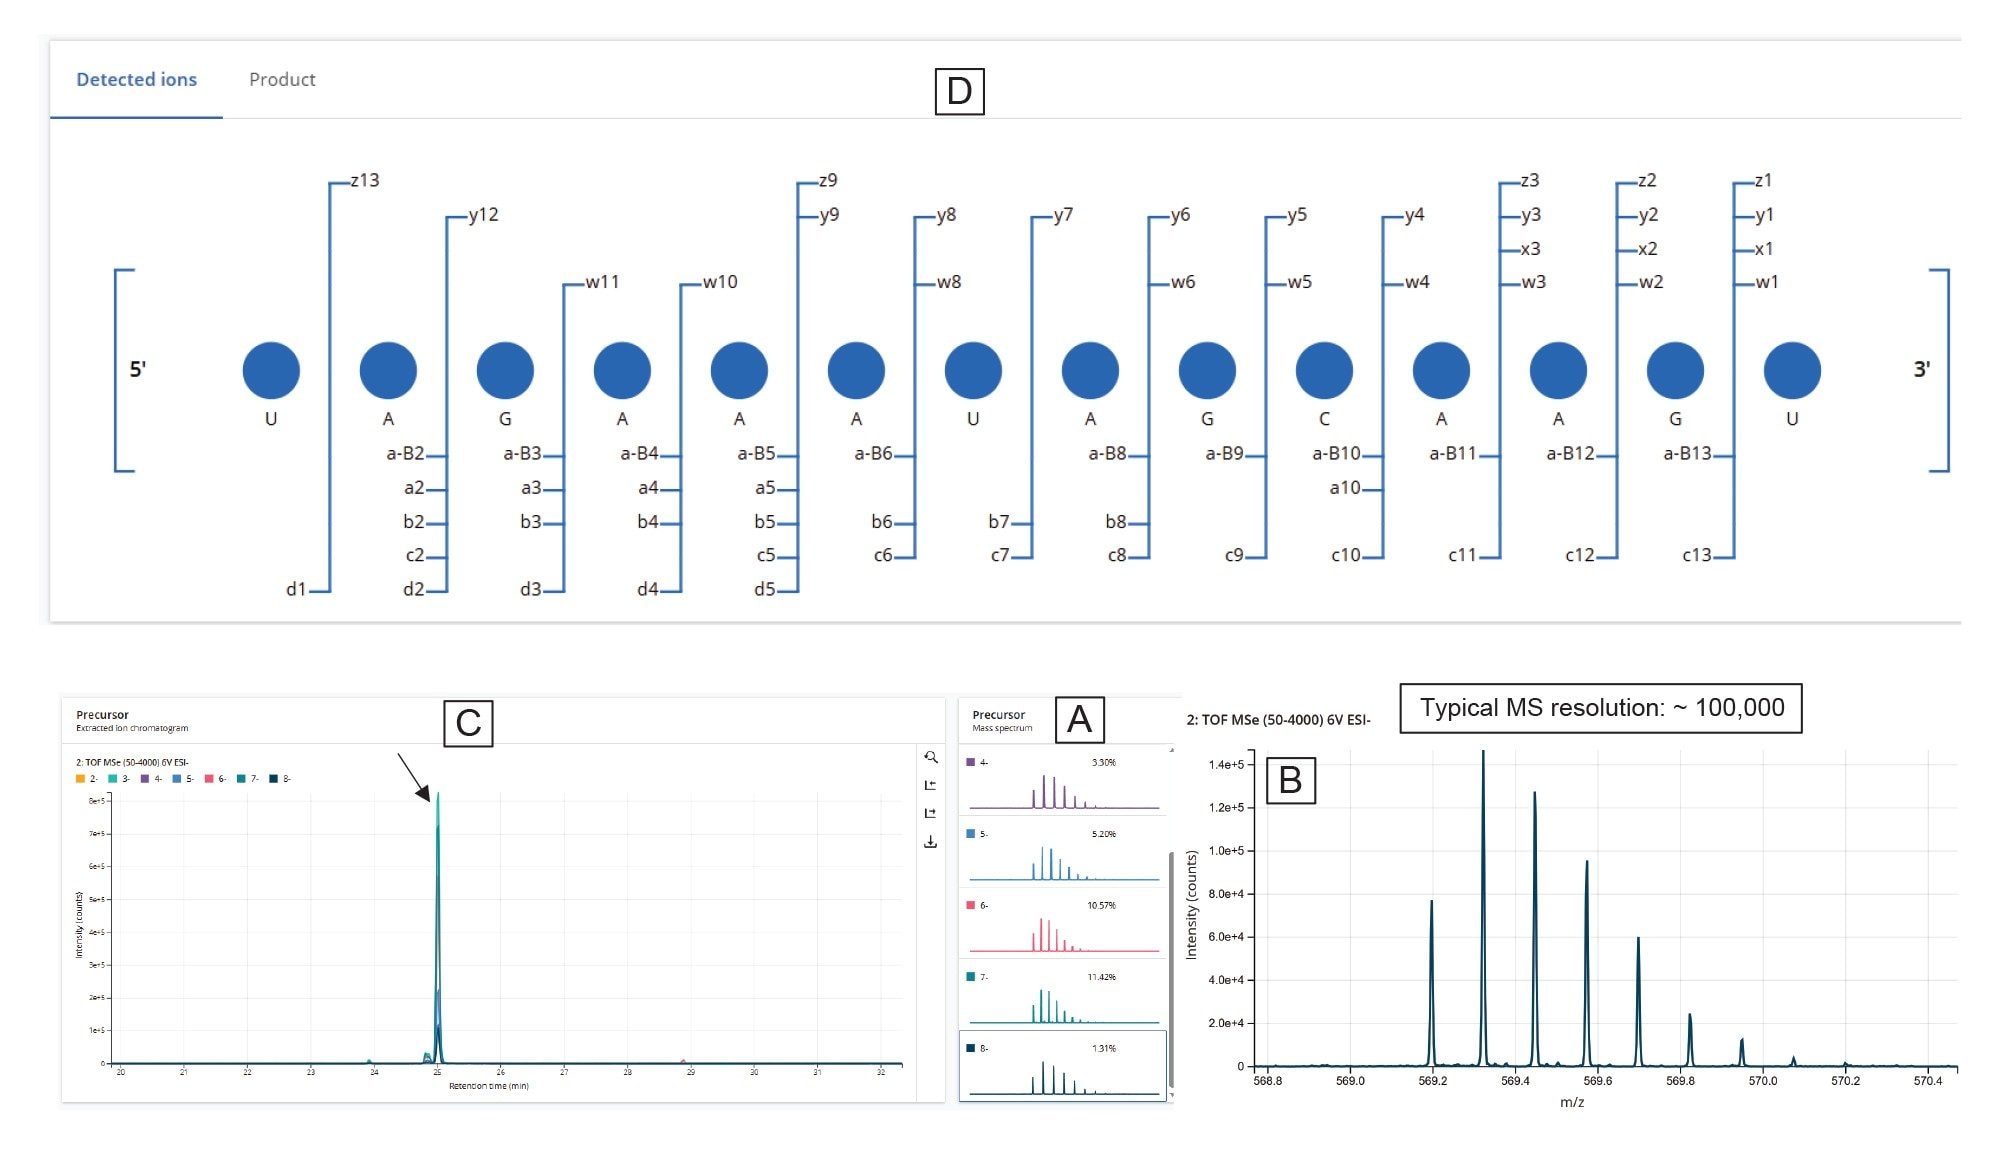
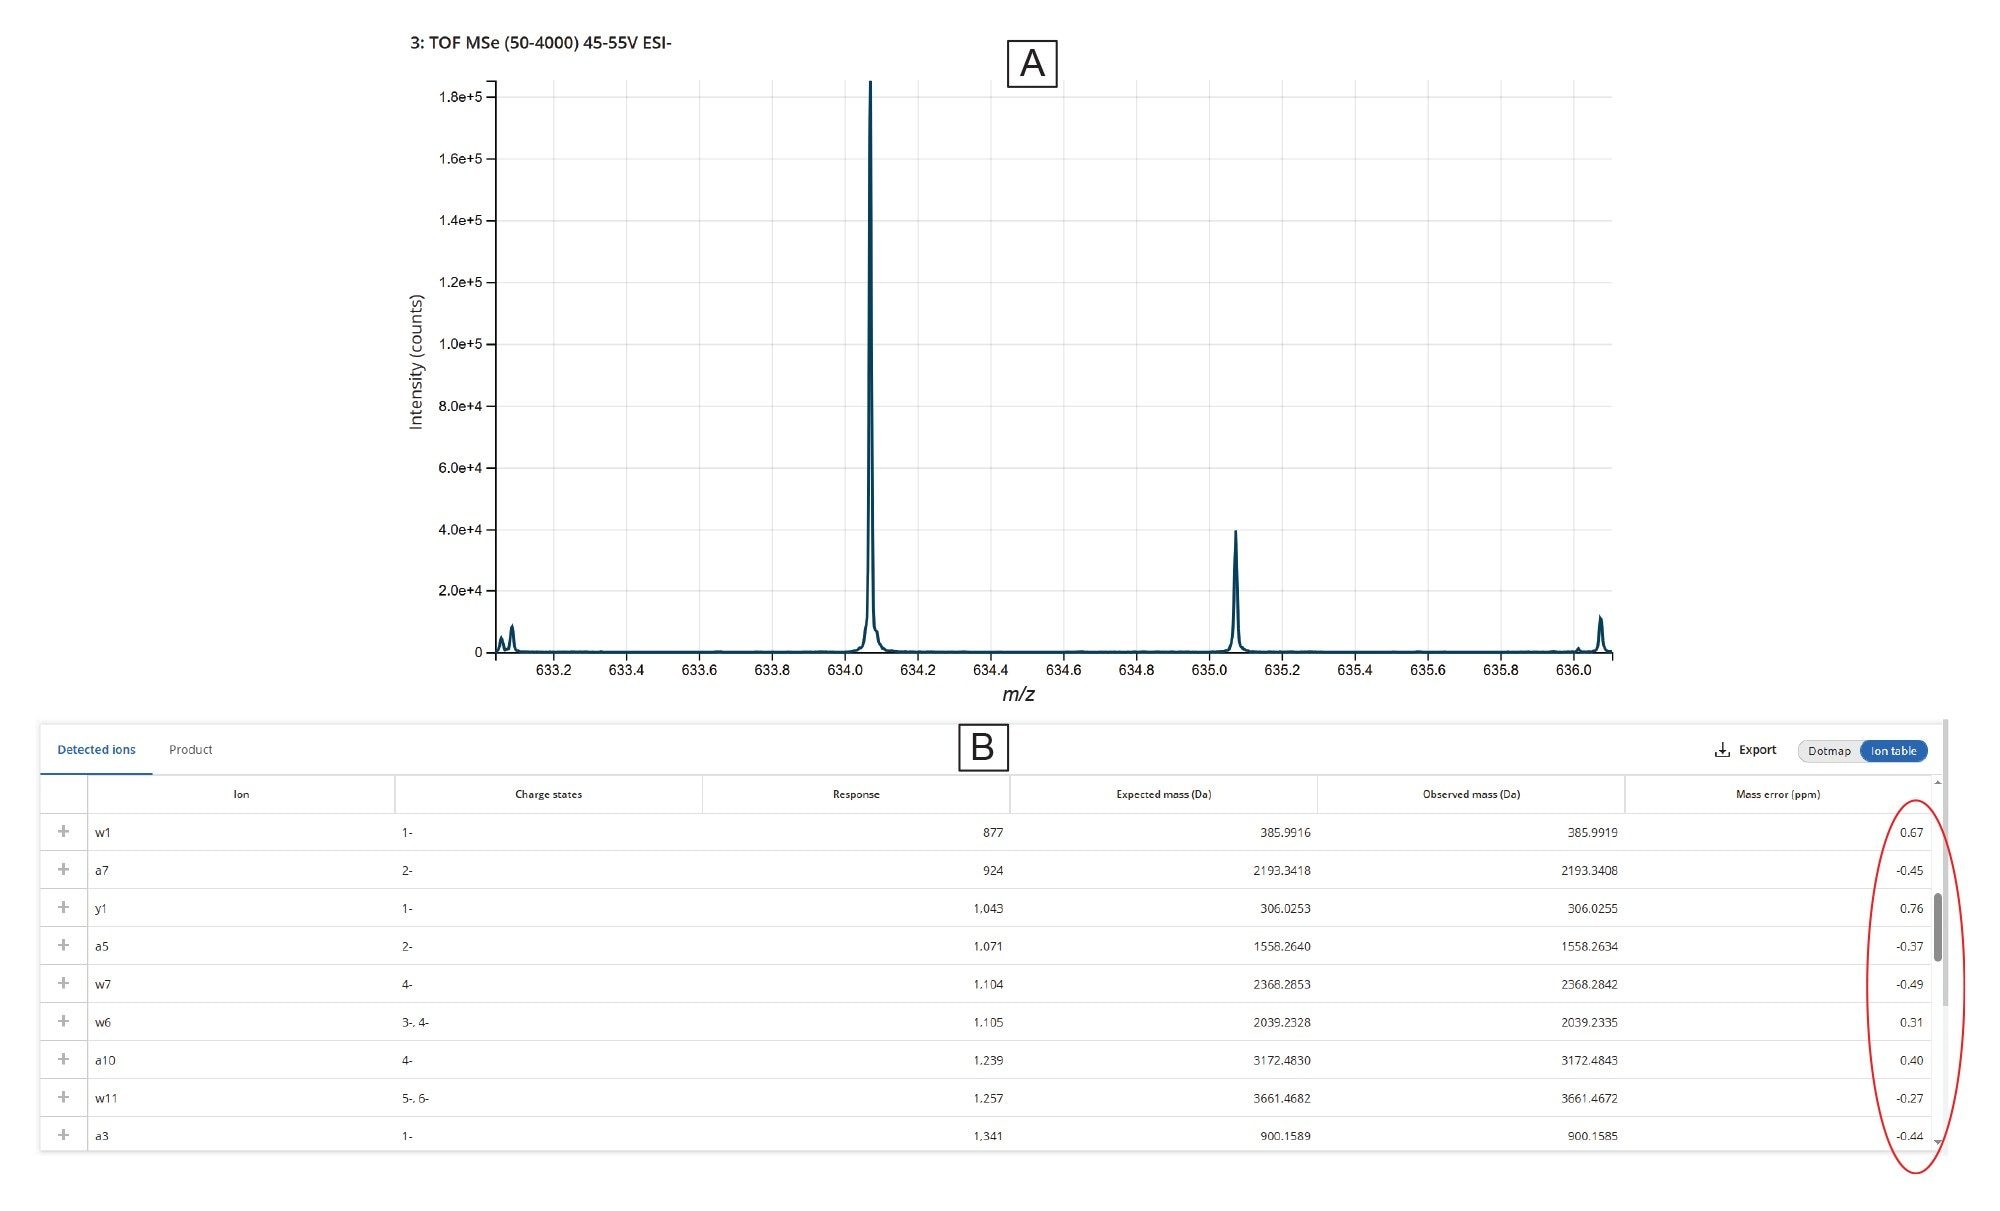
As an example, the U31:U44 digestion product—a 14-mer shown at the bottom of Figure 6—is further detailed in Figure 7. All isotopic peaks corresponding to the seven charge states (ranging from -2 to -8) detected for U31:U44 are shown in panel 7A, while the enlarged view for the M–8H]⁸⁻ charge state is displayed in panel 7B. The high-resolution capability of the Xevo MRT Mass Spectrometer instrument (100,000 resolving power) enabled full isotopic resolution of this charge state. The overlaid extracted ion chromatograms (XICs) for all charge states, indicates a common elution time of 25.0 minutes (Figure 7C). The assigned dot-map fragmentation diagram of this digestion product, labeling all matched fragment ions and confirming complete (100%) sequence coverage from elevated-energy MSE fragmentation, is displayed in Figure 7D.
In addition to the information presented in panels A–D of Figure 7, the MAP Sequence App v2.0 provided more detailed fragment ion data, as shown in the table from Figure 8A. This table lists all assigned fragment ions resulting from the fragmentation of the U31:U44 digestion product, along with their respective mass accuracies. Across all assigned digestion products, the average RMS mass accuracy for assigned fragment ions remains within the sub-ppm range (<1 ppm). Furthermore, individual isotopic distributions for each fragment ion can also be visualized, as illustrated in Figure 8B.
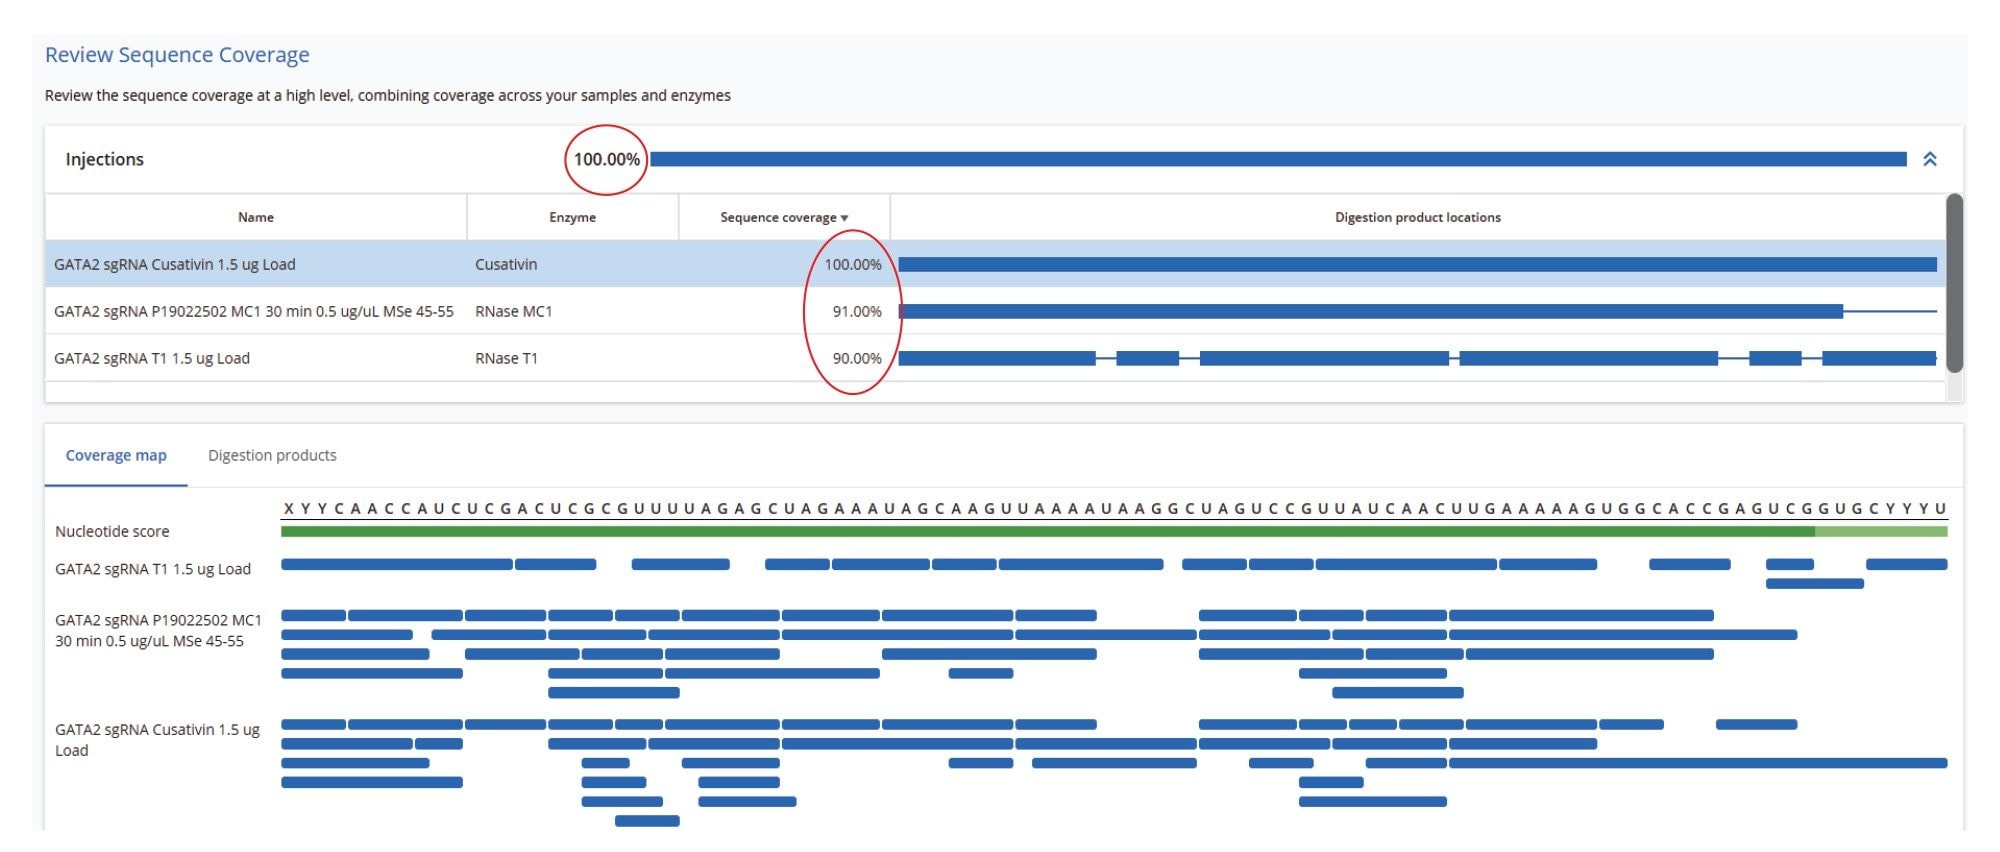
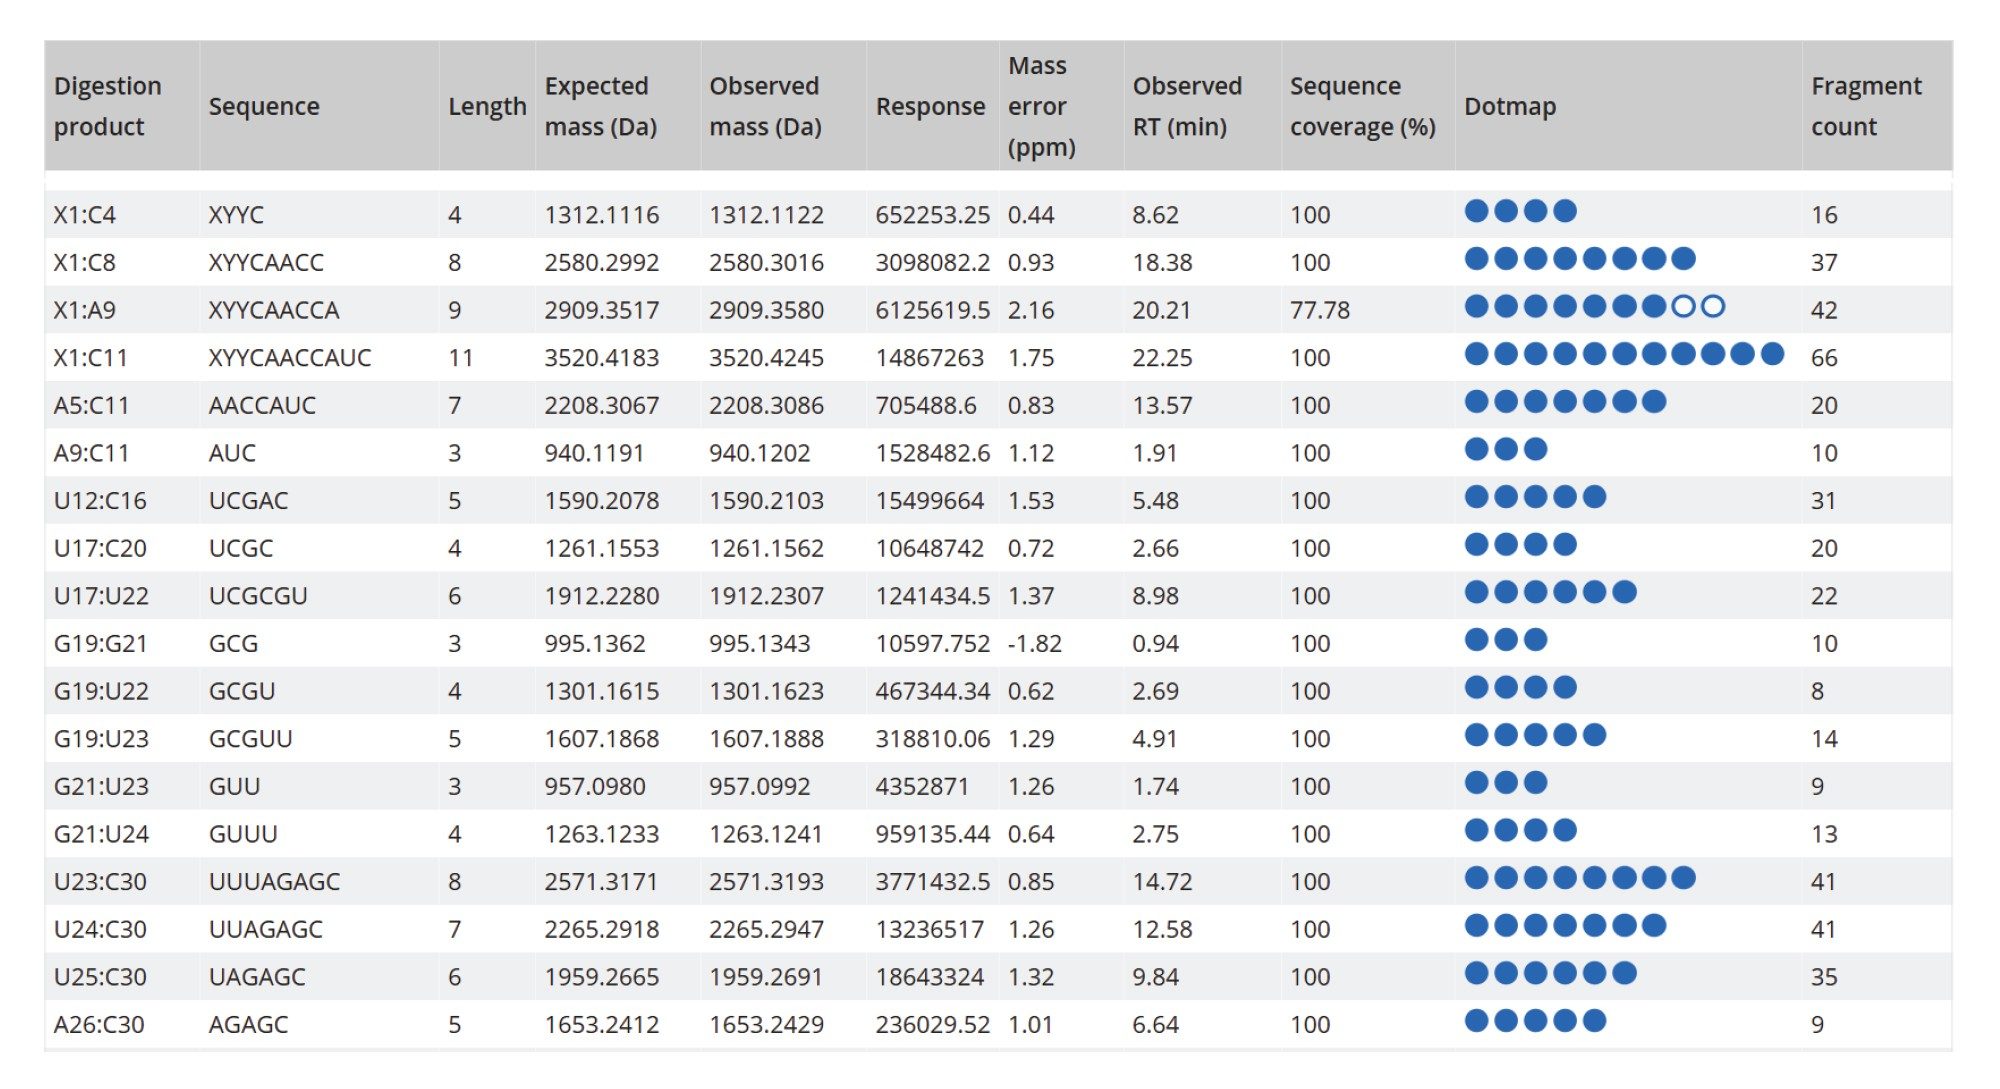
The sequence coverage results for the Waters sgRNA, obtained after processing all three digests, are shown in Figure 9. The RapiZyme Cusativin enzyme achieved complete (100%) digested oligonucleotide sequence coverage due to its unique digestion specificity - cleaving at seven distinct dinucleotide sites - and its capacity to generate controlled missed cleavages. These longer digestion fragments, resulting from 2–4 missed cleavages, are more likely to have unique masses, and their sequences were also verified by fragment ion assignments, as illustrated in the figure containing the MAP Sequence Report output (Figure 10). RapiZyme Cusativin specifically cleaves at the 3’-end of cytidine residues, with four major cleavage sites (C_A, C_U, C_G, and U_A) and three minor sites (A_U, G_U, and U_U).6-11 The enzyme predominantly produces digestion products terminating with a 3’ cyclic phosphate (cP).
RapiZyme MC1 also demonstrated excellent performance, achieving 91% digested oligonucleotide sequence coverage. As a T2 ribonuclease, MC1 cleaves at the 5’-end of uridine residues, showing three major cleavage preferences (A_U, C_U, and U_U) and two minor ones (C_A and C_G), 6-11, likewise yielding products with a 3’ cP. Due to these enzymatic properties, both Cusativin and MC1 provide greater sequence coverage compared to conventional RNase T1 digestion.6-11 As shown in Figure 9, the MAP Sequence 2.0 App was able to combine results from multiple enzyme digest maps, ensuring complete and redundant sequence coverage for the Waters sgRNA.
Conclusion
- An informatics workflow, incorporating the waters_connect MAP Sequence App (v2.0) was successfully demonstrated for UPLC-MSE oligonucleotide sequence mapping of sgRNA digests using the Xevo MRT QTOF Mass Spectrometer.
- Confident peak assessments for analysis of sgRNA digests was achieved with the Xevo MRT QTOF Mass Spectrometer, which delivered the required sensitivity and dynamic range while maintaining an average RMS mass accuracy of less than 1 ppm for both precursors and fragment ions of digestion products.
- Complete sgRNA sequence coverage (100%) was achieved by employing a combination of digestion enzymes.
- RapiZyme MC1 and RapiZyme Cusativin provided unique cleavage specificity and predictable missed cleavages, features that generated longer, unique, overlapping digestion products. Automated confirmation of modifications and linear sequence was achieved with the combined digests.
References
- Jinek M, Chylinsky K, Fonfara I, Hauer M, Doudna JA, Charpentier E. A Programmable Dual-RNA-Guided DNA Endonuclease in Adaptive Bacterial Immunity, Science, 2012, 337, 816–821.
- Jiang F, Doudna JA. CRISPR-Cas9 Structures and Mechanisms, Annu Rev Biophys, 2017, 46, 505–529.
- Ganbaatar U, Liu C. CRISPR-Based COVID-19 Testing: Toward Next Generation Point of Care Diagnostics, Front Cell Infect Microbiol, 2021, 11, https://doi.org/10.3389/ fcimb.2021.663949
- LC-MS Analysis of siRNA, Single Guide RNA and Impurities using the BioAccord System with ACQUITY Premier System and New Automated INTACT Mass Application, 2022, Waters application note. 720007546.
- Goyon A, Scott B, Kurita K, Crittenden CM, Shaw D, Lin A, Yehl P, Zhang K. Full Sequencing of CRISPR/Cas9 Single Guide RNA (sgRNA) via Parallel Ribonuclease Digestions and Hydrophilic Interaction Liquid Chromatography High-Resolution Mass Spectrometry Analysis, Anal Chem, 2022, 93, 14792–14801, doi: 10.1021 /acs.analchem. 1c03533.
- RNA Digestion Product Mapping Using an Integrated UPLC-MS and Informatics Workflow, 2024, Waters application note. 720008553.
- Tunable Digestion of RNA Using RapiZyme RNases to Confirm Sequence and Map Modifications, 2024, Waters application note. 720008539.
- Oligo Mapping of mRNA Digests Using a Novel Informatics Workflow, 2025, Waters application note. 720008677.
- Analysis of mRNA Cap Impurity Profiles and Capping Efficiency Using RapiZyme MC1 Ribonuclease, 2025, Waters application note. 720008793.
- Grunberg S, Wolf EJ, Jin J, Ganatra MD, Becker K, Ruse C, Taron CH, Correa IR, Yigit E. Enhanced Expression and Purification of Nucleotide-specific Ribonucleases MC1 and Cusativin, Protein Expr Purif Acid Res, 2022, 190, 105987, doi: 10.1016/j. pep.2021.105987.
- Thakur P, Atway J, Limbach PA, Addepalli B. RNA Cleavage Properties of Nucleobase-Specific RNase MC1 and Cusativin Are Determined by the Dinucleotide-Binding Interactions in the Enzyme-Active Site, Int J Mol Sci, 2022, 23, 7021.
720009130, November 2025