Rapid Identification of the In Vivo Biotransformations of a Targeted Protein Degrader (PROTACs) Using Xevo G3 QTof and waters_connect Software Platform
Robert S. Plumb
Waters Corporation, United States
Published on June 05, 2025
Abstract
PROteolysis TArgeting Chimeras (PROTACs) are heterobifunctional molecules that act by completely degrading target proteins in disease treatment. As such, they offer the potential to address previously intractable targets. The detection and identification of in vitro / in vivo biotransformation forms an essential part of the drug discovery and development process. The large molecular weight and chemical composition of PROTACs molecules complicates the process of metabolite identification. Here, we demonstrate the detection and identification of the in vivo metabolite of a model PROTACs compound using the Xevo™ G3 QTof Mass Spectrometer, ACQUITY™ Premier UPLC™ Chromatography System, and waters_connect™ for Metabolite Identification Workflow.
Benefits
- High-sensitivity MS and MS/MS data acquired under UHPLC chromatographic conditions enabled the detection and identification of trace-level metabolites.
- Rapid data analysis and identification of metabolic soft spots allows for the fast turnaround of information to project teams.
- Chemical intelligence to identify metabolism sites allow for the accurate identification of drug metabolites, thus reducing false positives and data review time.
- Simple data visualization and integration allow for comparison of results throughout the analytical batch, facilitating rapid comparison of data trends related to dose level and sampling occasion.
Introduction
PROTACs are a relatively new class of drug molecules that function by hijacking the cellular ubiquitin mediated degradation machinery to entirely remove the target protein, thus eliminating both the enzyme and non-enzyme functions.1 PROTACs are synthetic molecules comprised of two protein-binding moieties: one capable of engaging with an E3 ubiquitin ligase and the other with the target protein of interest. These two molecules are covalently connected by a linker, which can vary in length and chemical composition.
Understanding the metabolic fate of a compound is an essential part of the drug discovery and development process, e.g., identifying metabolic soft spots in compound evaluation and ensuring sufficient coverage in clinical development. Liquid chromatography - high-resolution mass spectrometry (LC-HRMS) and more recently, ultra-high-performance liquid chromatography - HRMS (UHPLC-HRMS) combined with automated, chemically intelligent, data analysis2–4 have become the primary analytical approach for drug metabolite profiling and identification. Previous in vitro studies5 have highlighted that the PROTACs linkers moieties are susceptible to N-dealkylation and amide hydrolysis at the points of attachment, resulting in the cleavage of the PROTACs molecule into two fragments. The complex nature of these PROTACs molecules provides an increased challenge to the metabolite identification process as the target binding moiety (TBM), ligase binding moiety (LBM) and linker must all be tracked and accounted for in the data analysis.
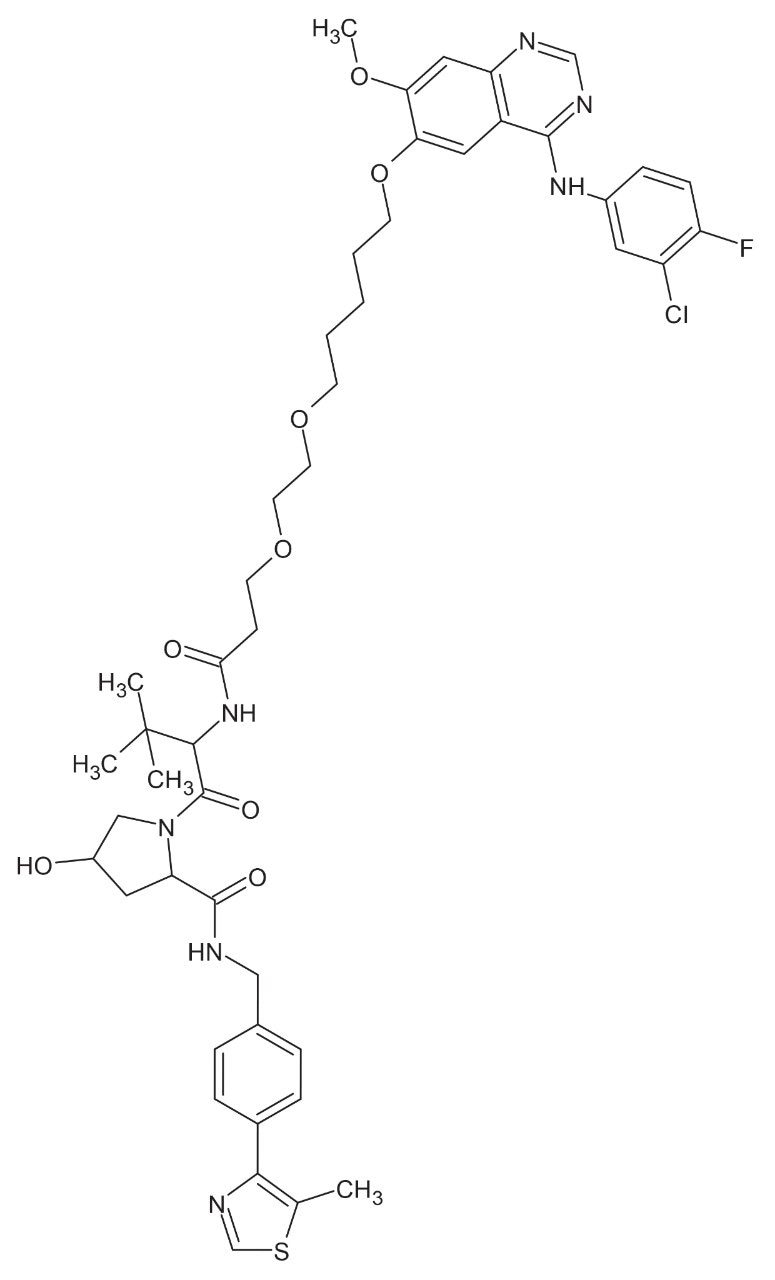
PROTACs–3–gefitinib (C47H57ClFN7O8S), Figure 1, is a PROTACs version of the tyrosine kinase inhibitor gefitinib, which was approved for the treatment of non-small cell lung cancer.5 This PROTACs molecule is formed from the gefitinib target protein binding moiety joined to a Von Hippel-Lindau (VHL) E3 ligase via an aliphatic linker, with a mono isotopic mass (M.I.M) = 933.3661 Da. Previous studies in preclinical species and humans6, 7 have shown that gefitinib is well absorbed with a good bioavailability and undergoes extensive biotransformation to a large number of metabolites via both functionalization and conjugation in animals and humans.
The aim of this study was to investigate the metabolism of PROTACs–3–gefitinib (a model PROTACs molecule) with an ACQUITY Premier UPLC Chromatography system coupled to the Xevo G3 QTof Mass Spectrometer using the waters_connect Software Platform for Metabolite Identification, following subcutaneous administration in male rats.
Experimental
Sample Description
Plasma and urine samples were obtained following the single subcutaneous administration of PROTACs–3–gefitinib at 10 mg/kg to male rats. Plasma samples were collected at 0.083, 0.25, 0.5, 1, 3, 6, 8, and 24 hr post dose, while urine samples were collected over the time ranges 0–1, 1–3, 1–8, and 8–24 post dose. The samples were stored frozen -80 C prior to analysis. Full details of the study are provided in Waters™ Application Note 720008485.
Plasma from time points 1, 3 h & 24 h and rat urine from time points 0–1 hr, 1–3 hr, 1–8 hr, and 8–24 were screened for drug-related metabolites. The samples were prepared by protein precipitation with 4 volumes of acetonitrile: methanol (75:25) (containing gefitinib d6 IS at 50 ng/mL). The resulting samples were vortex mixed and centrifuged at 14,000 g for 5 min at 5 ºC. The supernatant layer was then transferred to an autosampler vial for analysis.
Method Conditions
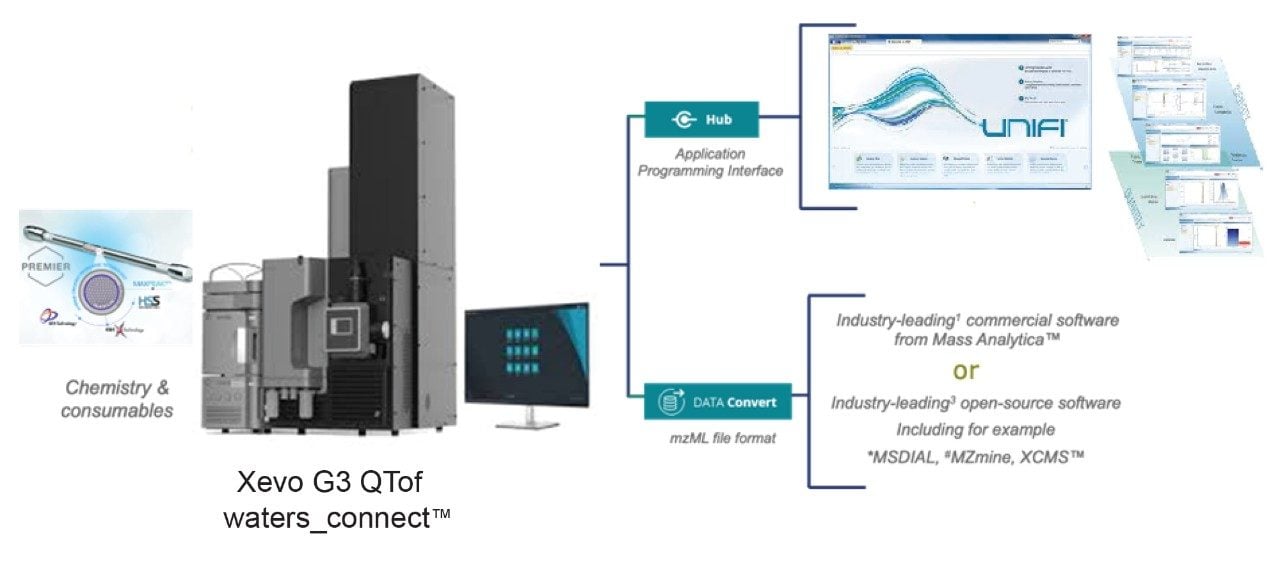
The plasma and urine extracts (2 µL) were analyzed using an ACQUITY Premier UPLC System, comprising a binary solvent manager, sample manager and column manager connected to a Xevo G3 QTof Mass Spectrometer. Chromatographic separations were performed using a 2.1 x 100 mm ACQUITY Premier HSS T3 1.8 µm Column maintained at 60 °C. The column was eluted with a linear reversed – phase gradient over 10 minutes at a flow rate of 0.6 mL/min. Data were collected in continuum mode using alternate high/low collision energy switching (MSE). The low collision energy was set to 4 eV (function 1) with a collision energy ramp (20 to 60 eV) used for the elevated energy data (function 2). A scan time of 0.1 s was used for both functions, allowing for an optimal compromise between number of points acquired across chromatographic peaks and the ion statistics required for mass accuracy. LeuEnk (m/z 556.2766 (ESI+) was used as the external lock mass with a scan collected every 30 s at a cone voltage of 40 V. The resulting data was then investigated using waters_connect for Metabolite Identification to identify drug-related features, the workflow shown in Figure 2.
LC Conditions
|
LC system: |
ACQUITY Premier UPLC System |
|
Vials: |
LCGC Certified Clear Glass 12 x 32 mm Screw Neck Vial, Total Recovery. p/n: 186000384C |
|
Column(s): |
ACQUITY UPLC HSS T3 Column, 100 Å, 1.8 µm, 2.1 mm X 100 mm. p/n: 186003539 |
|
Column temperature: |
60 °C |
|
Sample temperature: |
20 °C |
|
Injection volume: |
2 µL |
|
Flow rate: |
0.6 mL |
|
Mobile phase A: |
Aqueous 0.1% formic acid, 1 mM ammonium formate |
|
Mobile phase B: |
95% acetonitrile 5% water, 0.1% formic acid, 1 mM ammonium formate |
Gradient Table

MS Conditions
|
MS system: |
Xevo G3 QTof Mass Spectrometer |
|
Ionization mode: |
Positive Ion ESI |
|
Acquisition range: |
50–1200 |
|
Capillary voltage: |
1 kV |
|
Collision energy: |
Ramp 5–60 eV |
|
Cone voltage: |
40 V |
|
Acquisition mode: |
Data Independent Analysis (DIA) (MSE) |
|
Acquisition speed: |
20 Hz |
Data Management
|
Chromatography software: |
waters_connect Software Platform |
|
MS software: |
waters_connect Software Platform for Metabolite Identification |
|
Informatics: |
waters_connect 2.0.0.9 with UNIFI™ 1.9.13 |
Results and Discussion
The data derived from the UPLC-HRMS analysis of the urine and plasma sample extract was processed using waters_connect for Metabolite Identification. Following the input of the parent compound chemical structure, this software employed chemical intelligence and common mammalian biotransformation pathways to interrogate the derived data for potential drug related metabolites. The process includes the following steps: 1) creation of an analysis method, 2) library entry creation for parent compound and chemically intelligent targeting of unknown metabolites, 3) data filtering and review, and 4) data visualization and review.
Drug metabolism studies are performed throughout the discovery and development process. In early development, there is little knowledge of the metabolic fate of the molecule, whereas in late-stage clinical development, the candidate drug has been extensively investigated in both in vitro and in vivo studies. waters_connect for Metabolite Identification allows for known metabolites to be targeted via the construction of a library containing parent compound and confirmed structures, which are then used to interrogate the UPLC-HRMS data. The data set can also be inspected for previously unknown, novel metabolites using a combination of the structure of the parent compound, diagnostic fragment ions and common metabolic reactions, including both functionalization and conjugation.
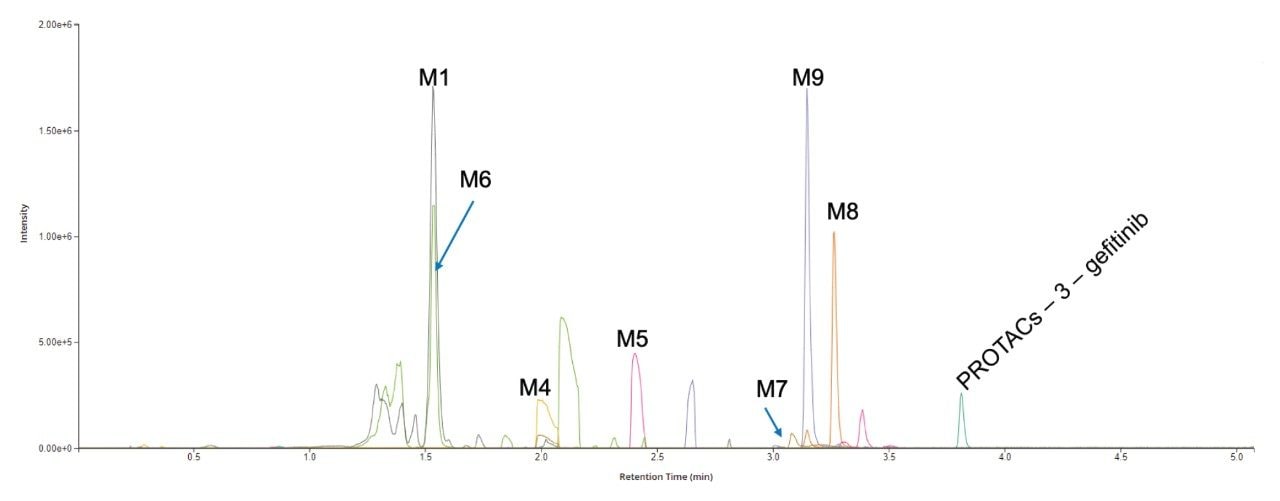
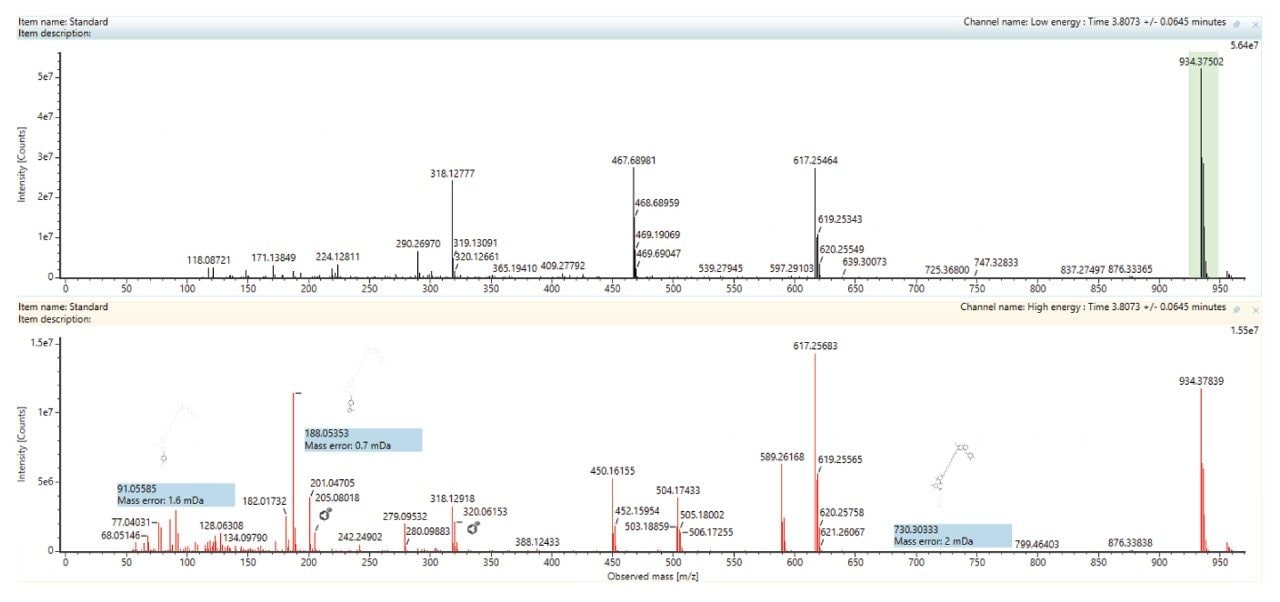
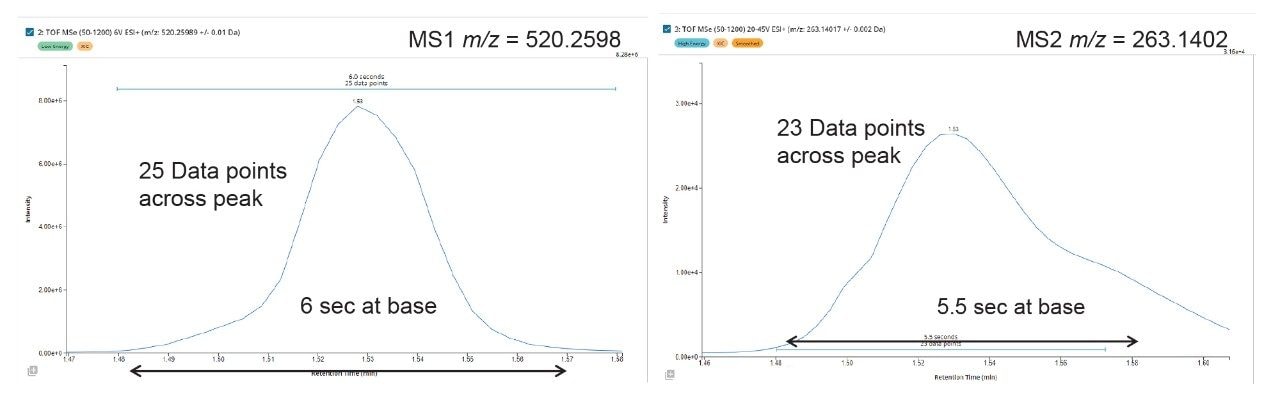
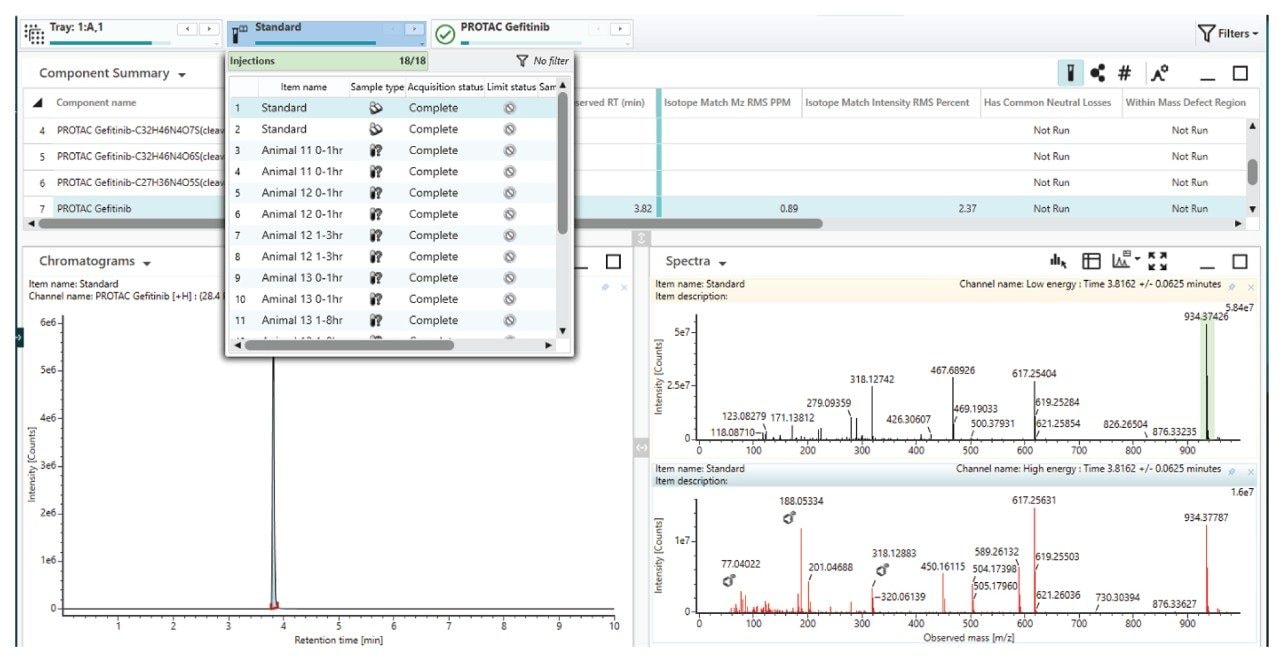
The analysis of the UPLC-HRMS data showed that the PROTACs–3–gefitinib peak eluted with a retention time of tR = 3.81 min (Figure 3) and gave rise to an MS1 precursor ion of m/z = 934.3729 Da with a mass error of 0.5 ppm. The MS2 product ion spectra showed diagnostic fragment ions at m/z = 617.2566, 318.1290, and 188.0533 Da (average mass error 3.3 ppm) (Figure 4). These ions were rationalized as loss of VHL ligase, the gefitinib like moiety and the thiazole – benzene ring complex from the VHL ligase moiety respectively. The presence of a chlorine atom in the gefitinib-like region of the PROTACs molecule gave a diagnostic isotopic pattern which was used and identify drug-related metabolic features. The chromatographic peak widths for this separation were determined to be approximately 5 seconds at the base, and the acquisition speed of the Xevo G3 QTof mass spectrometer enabled >20 points to be collected across the LC peak in both low and high collision energy—allowing for excellent peak definition and spectral quality, Figure 5.
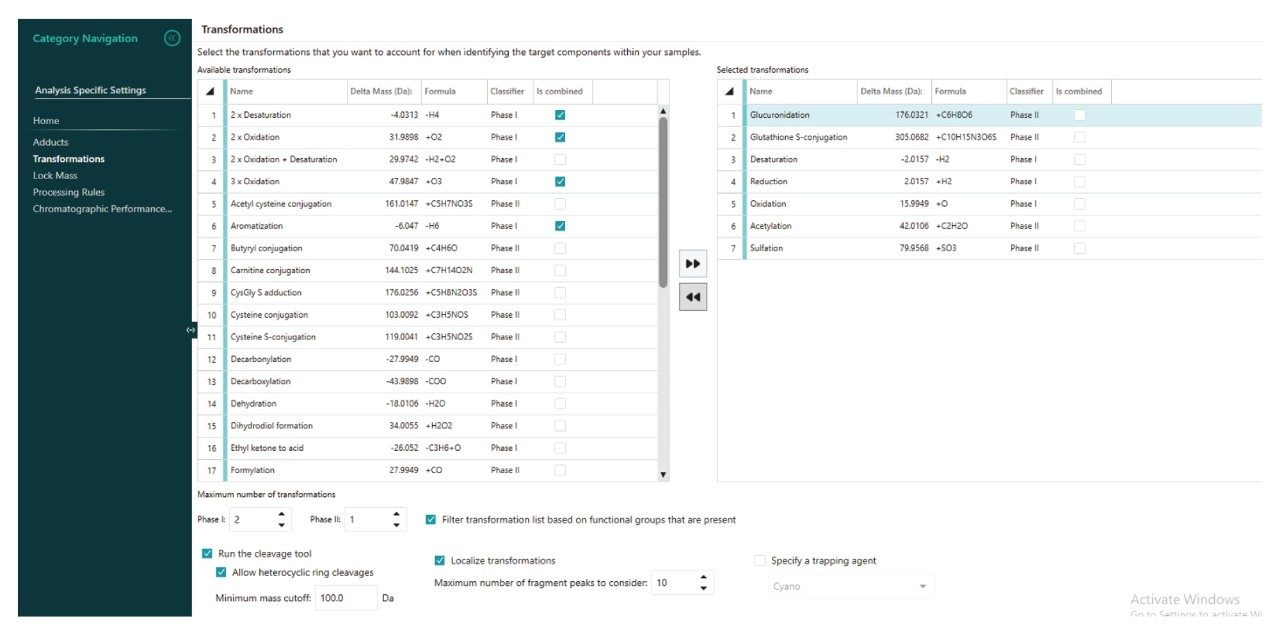
As no previous information was available on the in vitro or in vivo metabolism of PROTACs–3–gefitinib, the HRMS data was examined for the presence of drug-related features using a combination of parent compound structure and mass fragmentation information, and common metabolic biotransformation reactions, e.g., oxidation, dehydration, deamination and glucuronidation. The waters_connect for Metabolite Identification workflow allowed for the selection of target metabolites which can be further functionalized via the ‘Generate Transformations’ checkbox. Once the appropriate target list was created in Figure 6, the LC-HRMS raw data was processed to detect and identify drug-related analytes.
Analysis of the UPLC-HRMS data showed the presence of 9 potential drug-related metabolites eluting between 1.2 and 3.5 min, Figure 3, with precursor ion mass accuracies of 3 ppm or better. The data were reviewed and filtered to ensure that:
- Any component could be rationalized on the basis of a combination of plausible biotransformations
- The component had at least one product ion in common with MP compound
- The feature was not present in the control (vehicle) samples
- The retention time of the component was between 1.0 and 8 min (to eliminate false positives in the solvent front and organic wash)
- Potential PROTACs metabolites showed a consistent trend in peak response following dosing
- The mass error for the metabolite determined experimentally was within 3.0 ppm, or better, of the theoretical value
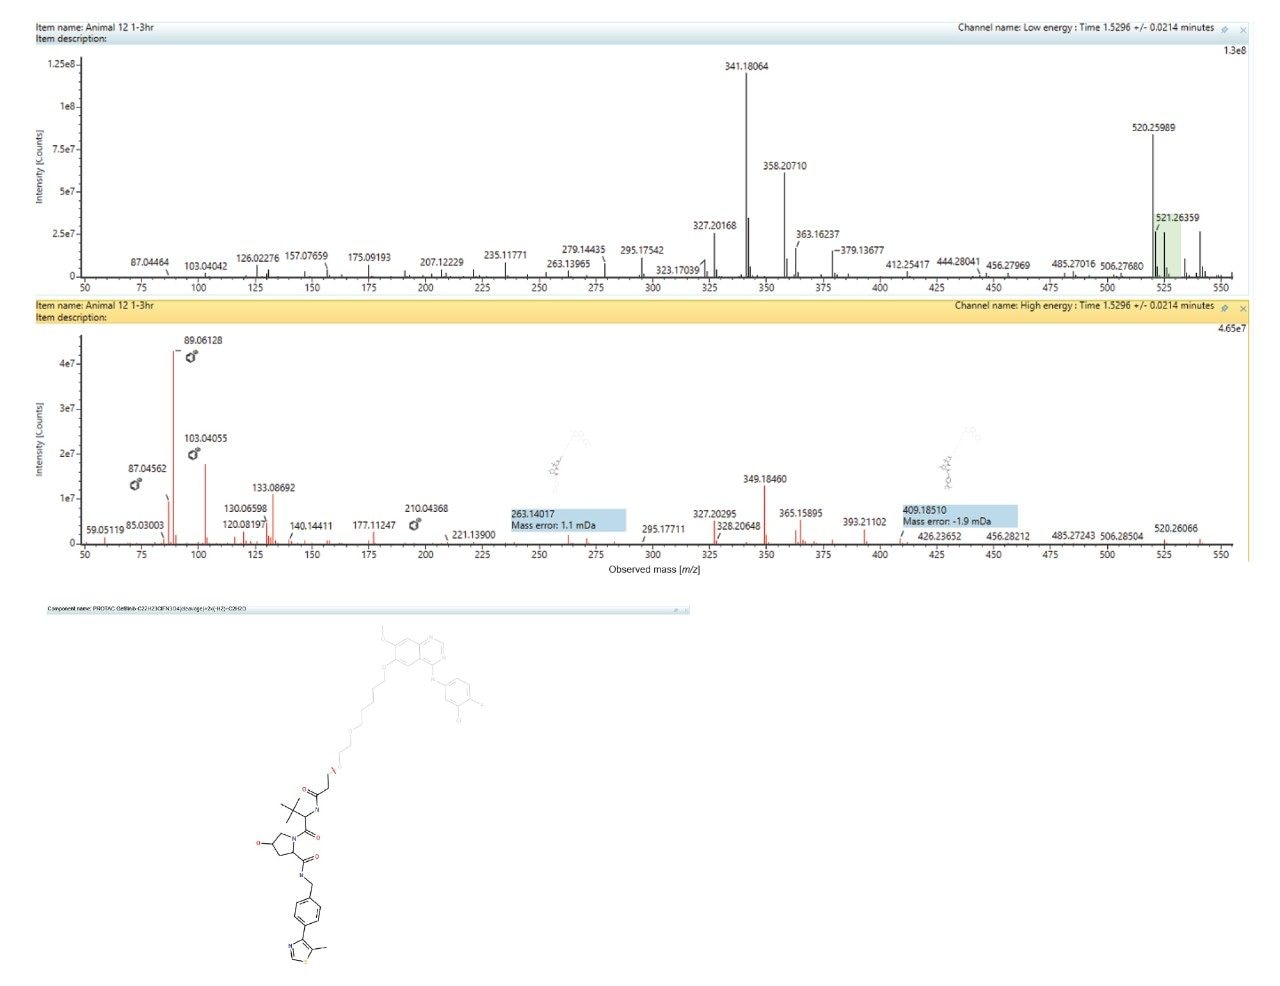
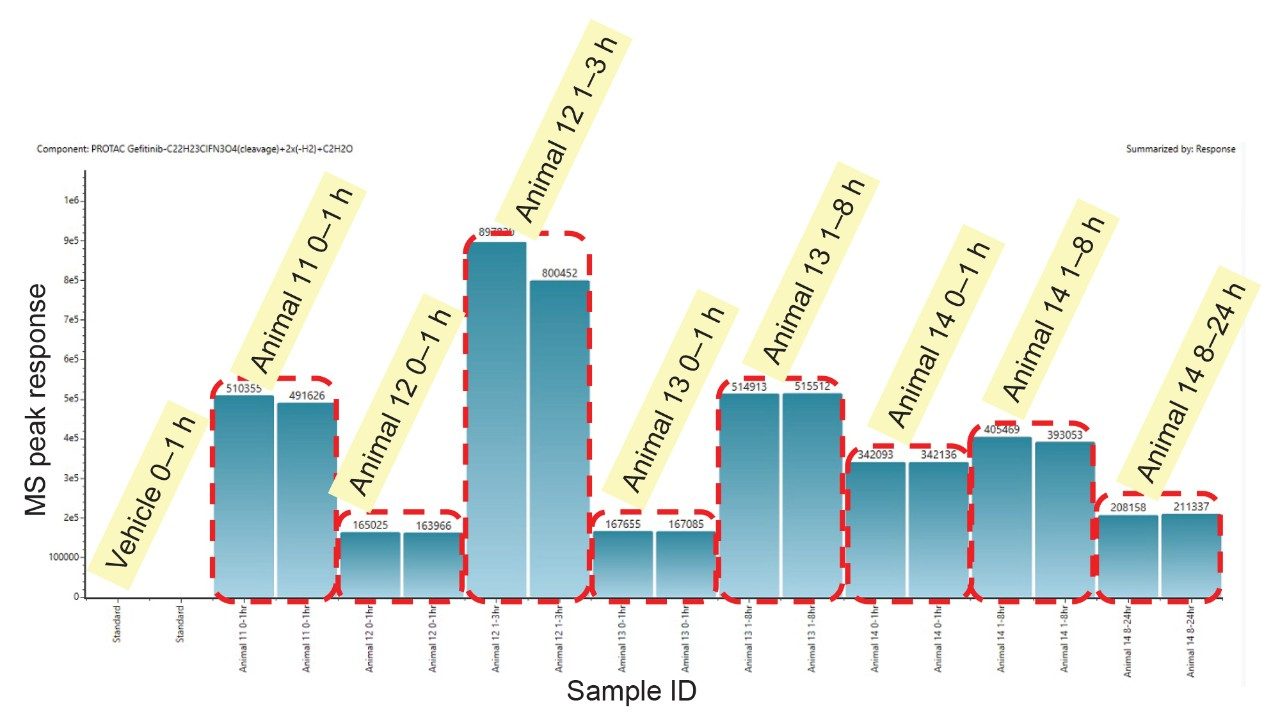
An example of the waters_connect for Metabolite Identification data browser is shown below in Figure 7. The MS1 and MS2 spectra obtained from the analysis of metabolite M6 eluting with a retention time of tR = 1.53 min is shown below in Figure 8. The MS1 spectrum gave rise to a base peak of m/z = 525.2165 [C27H32N4O5S]+, giving a mass error of 2.0ppm while the MS2 spectrum showed diagnostic fragment ions of m/z = 409.1851, 263.1402, 103.0406, 89.0613, and 87.0456. This metabolite was rationalized as the VHL ligase and linker from PROTACs–3–gefitinib following cleavage of C22H23ClFN3O4 2x (-H2) reduction and addition of C2H2O. Analysis of the urine samples showed that this M6 metabolite was not present in the standard or vehicle samples.
Reviewing the change in metabolite concentration with time is a critical aspect of confirming that any identified feature is drug related. Any drug metabolite should show a consistent trend in response following dosing, between replicate analysis, sampling occasions, and different animals/subjects. The waters_connect for Metabolite Identification workflow facilitates the facile review of metabolites response data between samples, time points, and replicate analysis. Analysis of the UHPLC-HRMS data showed that the response of M6 metabolite steadily increased following dosing, reaching a maximum peak urine concentration at the 3–8 h time point before reducing over the remaining 16 h, though still detectable in the 24 h samples (Figure 9). The data was shown to be consistent between replicate analysis and between animals.
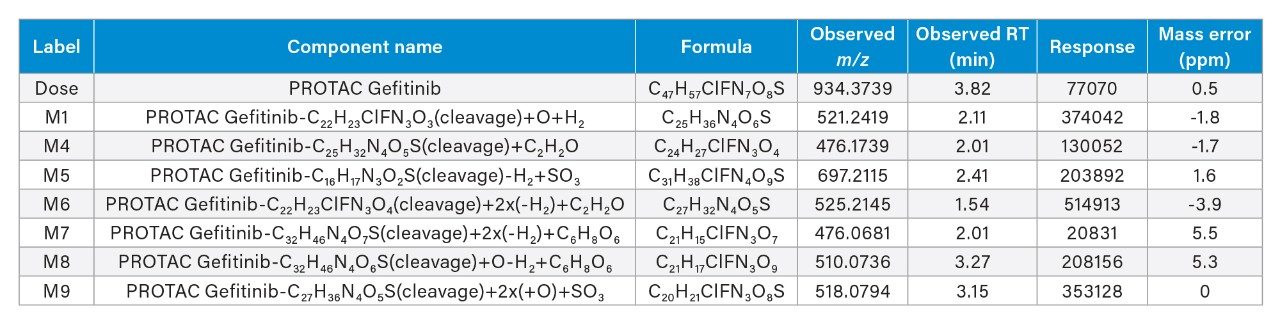
A similar process was used to evaluate the other potential drug metabolites. A total of 9 potential metabolites were identified, with the major metabolites indicating that PROTACs–3–gefitinib was metabolized via amide hydrolysis, dealkylation of the linker chain, oxygenation of both the therapeutic binding moiety (TBM), and the E3 ligase binding moiety (EBM) followed by sulphate and glucuronide conjugation (Table 1).
Conclusion
The in vivo metabolism of the proteolysis targeting chimera tyrosine kinase inhibitor PROTACs–3–gefitinib was determined in plasma and urine following subcutaneous administration at 10 mg/kg to the rat. A total of 9 drug related metabolites were detected with the major routes of metabolism involved cleavage of the aliphatic linker via N-deamination and ester hydrolysis to yield the VHL-ligase complex and gefitinib-like moiety ligase complex followed by conjugation via sulfation or glucuronidation.
The analysis was performed using a chromatography system coupled to a Xevo G3 QTof Mass Spectrometer. The drug metabolites were separated using a rapid reversed-phase gradient UPLC methodology with positive ion mode electrospray ionization (ESI) operated in data independent acquisition (DIA) mode. The acquisition rates of the Xevo G3 QTof allowed for >20 data points to be collected in both the low and high collision energy channels across a 5 sec chromatographic peak facilitating excellent peak definition and ion statistics, yielding better than 3 ppm mass accuracy. Data analysis and metabolite identification were performed using the waters_connect for Metabolite Identification workflow . The data were interrogated and filtered using chemically intelligent filtering allowing for the detection of drug-related fragment ions, localization of the site of metabolism, and identification of putative metabolites. The ability to visualize the relative abundance of metabolites across the study time course allowed for the further filtering of the data and added confidence in validity of the results.
References
- Békés M, Langley DR, Crews CM. PROTAC targeted protein degraders: the past is prologue. Nat Rev Drug Discov. 2022;21(3):181–200. doi: 10.1038/s41573-021-00371-6.
- Murray KJ, Villalta PW, Griffin TJ, Balbo S. Discovery of Modified Metabolites, Secondary Metabolites, and Xenobiotics by Structure-Oriented LC-MS/MS. Chem Res Toxicol. 2023 20;36(11):1666–1682. doi: 10.1021/acs.chemrestox.3c00209.
- Wen B, Zhu M. Applications of mass spectrometry in drug metabolism: 50 years of progress. Drug Metab Rev. 2015;47(1):71–87. doi: 10.3109/03602532.2014.1001029.
- Molloy BJ, King A, Gethings LA, Plumb RS, Mortishire-Smith RJ, Wilson ID. Investigation of the pharmacokinetics and metabolic fate of Fasiglifam (TAK-875) in male and female rats following oral and intravenous administration. Xenobiotica. 2023;53(2):93–105. doi: 10.1080/00498254.2023.2179952.
- Goracci L, Desantis J, Valeri A, Castellani B, Eleuteri M, Cruciani G. Understanding the Metabolism of Proteolysis Targeting Chimeras (PROTACs): The Next Step toward Pharmaceutical Applications. J Med Chem. 2020 Oct 22;63(20):11615–11638. doi: 10.1021/acs.jmedchem.0c00793.
- McKillop D., Hutchison M., Partridge E.A., Bushby N., Cooper C.M.F., Clarkson-Jones J.A., Herron W., Swaisland H.C. Metabolic disposition of gefitinib, an epidermal growth factor receptor tyrosine kinase inhibitor, in rat, dog and man. Xenobiotica. 2004;34:917–934. doi: 10.1080/00498250400009171.
- Molloy B.J., King A., Mullin L., Gethings L.A., Riley R., Plumb R., Wilson I.D. Rapid determination of the pharmacokinetics and metabolic fate of gefitinib in the mouse using a combination of UPLC/MS/MS, UPLC/QToF/MS, and ion mobility (IM)-enabled UPLC/QToF/MS. Xenobiotica. 2021;51:434–446. doi: 10.1080/00498254.2020.1859643.
720008808, May 2025