Multi-Residue Analysis of Pharmaceuticals, Personal Care Products (PPCPs) and Pesticides in Water by Direct Injection Using LC-MS/MS
Hannah Willmer, Stuart Adams, Douglas Stevens, Peter Hancock, Janitha De-Alwis, Claudia Rathmann
Waters Corporation, United States
Published on June 13, 2025
Abstract
In this application note, we investigate a list of over 190 pharmaceuticals, and personal care products (PPCPs) and pesticides (including their degradation products) in both drinking and surface water using a direct aqueous injection, multi-residue LC-MS/MS technique. This method addresses the continuously evolving European Union (EU) Water Framework and Drinking Water Directives and Watch Lists, which aim to establish regulatory standards and enhance the data used for identifying and monitoring an expanding list of substances of concern.
A method performance study was conducted using the ACQUITY™ Premier System paired with the Xevo™ TQ Absolute Tandem Quadrupole Mass Spectrometer and electrospray ionization (ESI) on three typical water matrices: tap water, surface water, and bottled mineral water. The performance of all analytes was evaluated at three spike levels (10, 25, and 125 ng/L), with six replicates for each level. For the most complex matrix, river water, the average method performance for trueness was 92%, with values ranging from 57% to 131% across all spike levels. The average trueness RSD was 5%, with 99% of all sample types and fortification levels showing an RSD below 20%.
Benefits
- Sensitivity of Xevo TQ Absolute allows for the trace level detection of PPCPs and pesticides in drinking and surface waters without the need for lengthy clean-up or concentration steps
- The direct injection approach increases productivity and provides faster turn-around time for reporting of results while being well aligned with green analytical chemistry principles
- More than 150 analytes reach limits of quantification of 10 ng/L, making this method suitable for screening for multi-class analytes in water matrices
Introduction
In recent years, there has been increasing concern about the presence of pesticides, pharmaceuticals and personal care products (PPCPs) in water bodies throughout the world.1 The effect of these emerging contaminants on human health and their potential impact on the environment is not yet fully understood.
The updated Drinking Water Directive entered into force in January 2021 and is the EU's main law for drinking water. The Directive applies to all water, either in its original state or after treatment, intended for drinking, cooking, food preparation or other domestic purposes, regardless of its origin and whether it is supplied from a distribution network, supplied from a tanker or put into bottles or containers.2 It further protects human health thanks to updated water quality standards, in accordance with World Health Organisation (WHO) recommendations, addressing emerging pollutants, such as endocrine disruptors, and promoting a preventive, risk-based approach to reduce pollution at its source.
Water bodies such as rivers, lakes and groundwaters have their status defined in the EU Water Framework Directive.3 An amendment to Directive 2013/39/EU sets environmental quality standards for hazardous substances that require monitoring in these waters. A Commission Implementing Decision4 document, 2022/1307, includes Watch List analytes with Maximum Acceptable Method Detection Limits for compounds of concern across multiple chemical classes.
Numerous studies have demonstrated that PPCPs are present at parts-per-trillion (PPT) levels in rivers and streams highlighting the need for methods that are able to detect compounds at these trace levels.5-10 In addition to the low-level detection of these compounds, a major analytical challenge lies in the wide chemical diversity of chemicals of concern. Furthermore, to establish a more complete understanding of water pollution it is necessary to monitor a wide variety of types of water.
This application note demonstrates the direct injection, separation and detection of PPCPs and pesticides including acidic, basic, and neutral compounds from multiple regulated analyte lists in a variety of water types.
Experimental
Sample Description
Water samples were collected from sources of known soft and hard water areas and from surface water locations in the UK. Mineral water was purchased from a UK retail outlet and stored in its original container. All samples were stored in refrigerated conditions.
Prior to analysis, acetic acid was added to the samples to a final concentration of 0.01%. The samples were then aliquoted into glass autosampler vials and sealed with preslit PTFE/silicon septa caps (p/n: 186005666CV) for direct injection by UPLC-MS/MS.
Method Condition
Matrix-matched calibration standards were prepared in bottled mineral water at nine concentrations: 5, 10, 20, 50, 75, 100, 200, 500, and 1000 ng/L and used across all assessments. Spiked samples were prepared in all three matrices with 6 replicates at each level fortified with all compounds at 10, 25 and 125 ng/L. These levels were chosen based on the typical contaminant levels expected in the samples. Internal standards were not included in this method.
Quantification of spiked samples was by matrix bracketed calibration. Bottled mineral water was used to create matrix-matched calibration standards throughout as it contained the fewest incurred contaminant levels compared to other matrices screened. Optimum dwell time for target compounds were determined by the auto dwell function.
LC Conditions
|
LC system: |
ACQUITY Premier FTN |
|
Vials: |
TruView pH control LCMS certified clear glass 12 x 32 mm screw neck vial, with cap and preslit PTFE/silicone septum (p/n: 186005666CV) |
|
Column: |
ACQUITY™ Premier HSS T3 Column 1.8 µm, 2.1 x 100 mm (p/n: 186009468) |
|
Column temperature.: |
45 ºC |
|
Sample temperature.: |
10 ºC |
|
Injection volume: |
20 µL |
|
Flow rate: |
0.500 mL/min |
|
Mobile phase A: |
0.01% acetic acid in water |
|
Mobile phase B: |
0.01% acetic acid in 50:50 v/v methanol:acetonitrile |
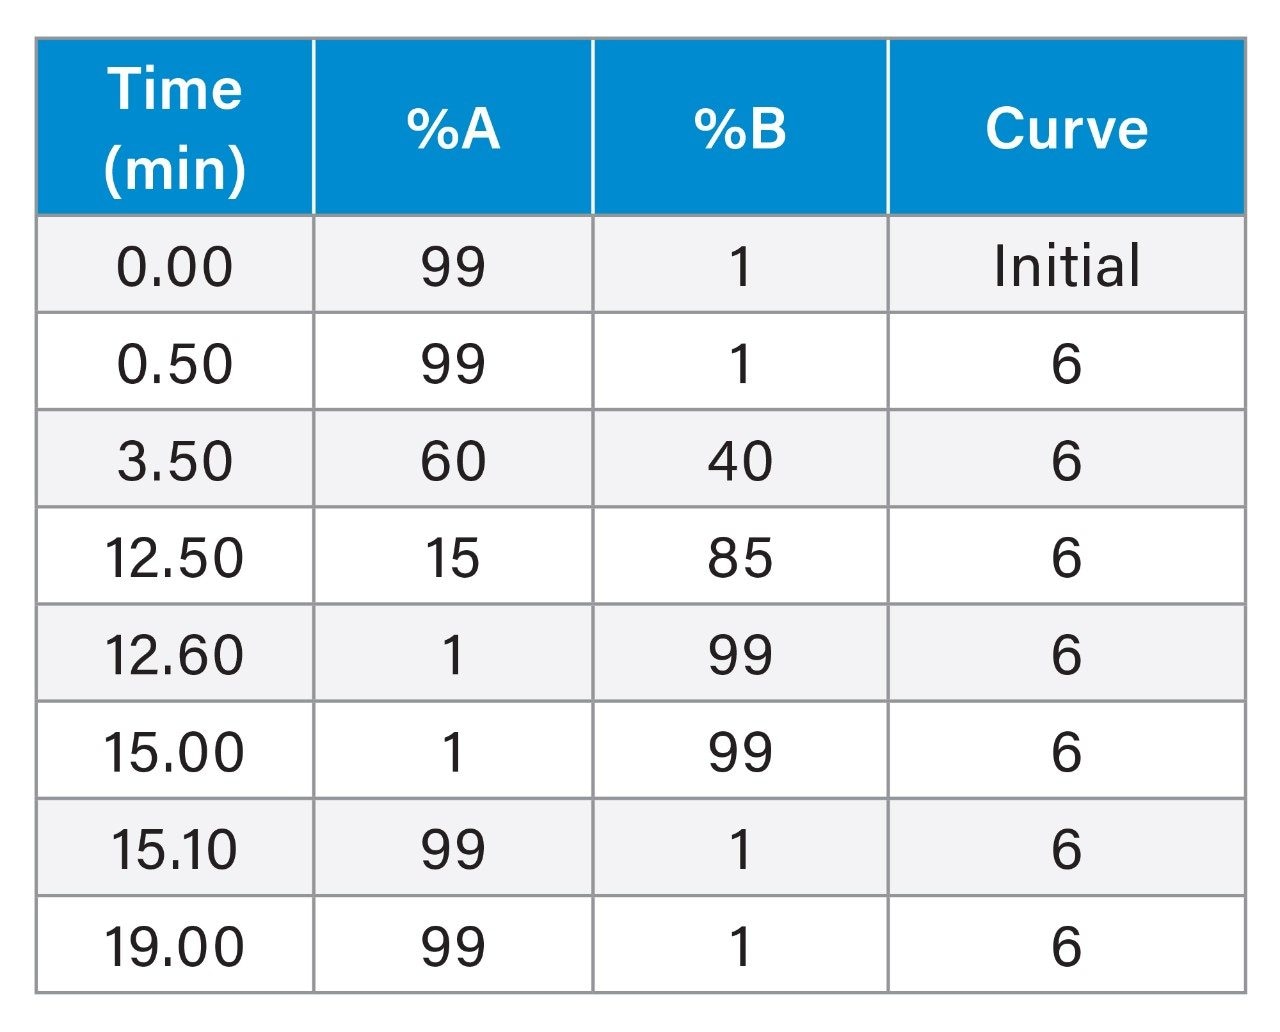
Gradient Table
MS Conditions
|
MS system: |
Xevo TQ Absolute |
|
Ionization mode: |
ESI+ and ESI- |
|
Capillary voltage: |
Positive ion +0.5 kV, negative ion -0.5 kV |
|
Desolvation temperature: |
550 ºC |
|
Source temperature: |
140 ºC |
|
Desolvation gas flow: |
1000 L/hr |
|
Cone gas flow: |
150 L/hr |
|
MRM method: |
See Appendix |
Data Management
|
Software: |
waters_connect™ for Quantitation Software |
Results and Discussion
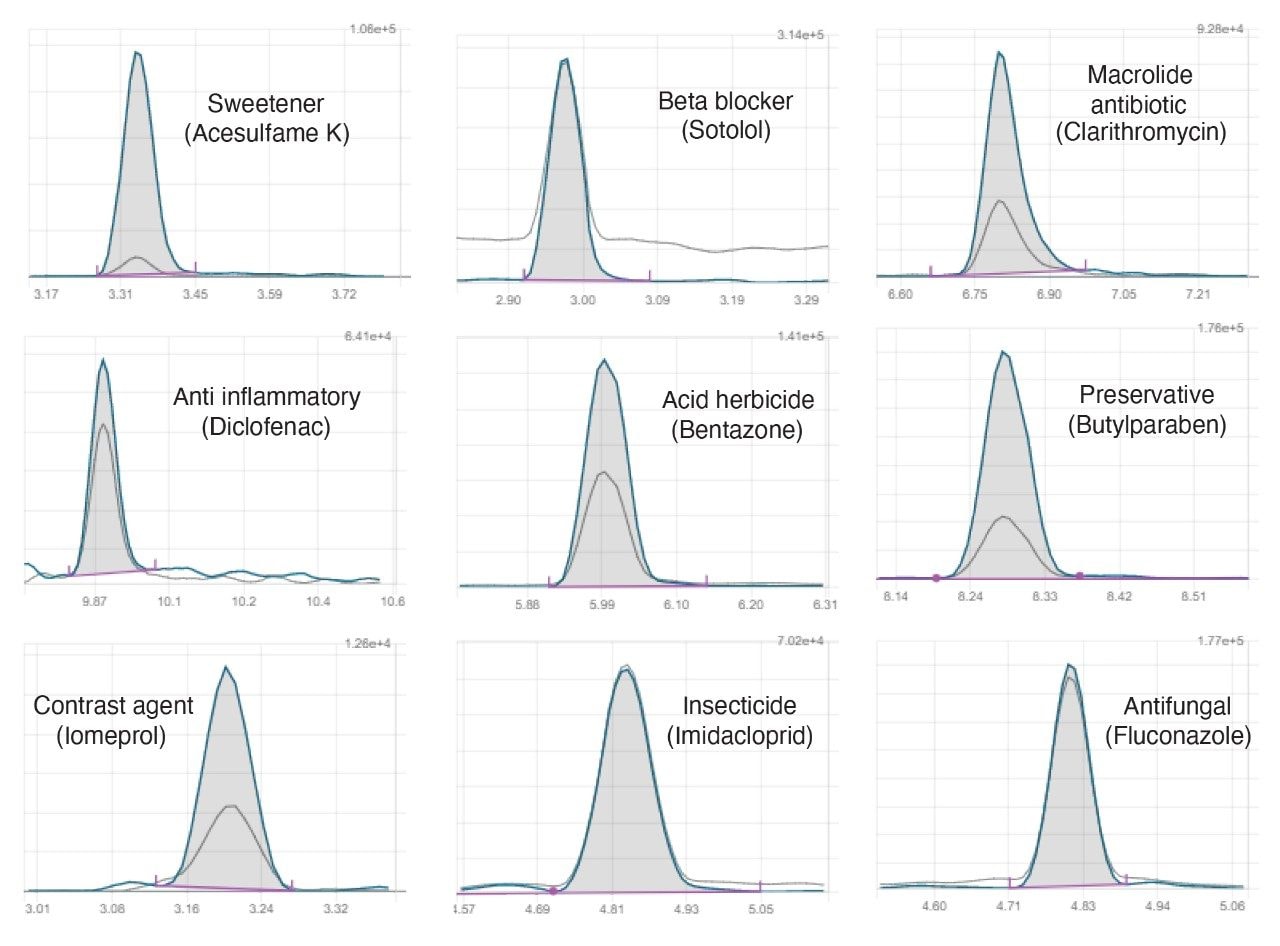
Despite the chemical diversity of the compounds analyzed, the method demonstrated retention complying with the requirements in the ISO 21253–2:2019 standard for water quality as applied to multi-compound class methods11, exhibiting Gaussian chromatographic peak shapes and good retention time stability throughout the study, independent of water type, as demonstrated in Figure 1. Fast polarity switching maximized compound coverage and the speed of switching ensured that good peak definition was obtained with sufficient data points across peaks in both positive and negative mode.
Effect of sample composition on peak shape and sensitivity
To ensure optimal conditions for a diverse range of compounds with varying physiochemical properties, it is necessary to assess multiple parameters. During the study, the addition of various organic diluents to the aqueous sample was evaluated. It was observed that certain compounds, such as macrolide antibiotics, benefited from higher levels of organic content. However, it was found that a 100% aqueous composition was optimal for many compounds and proved to be the most practical choice, minimizing contamination risk and enhancing the method's efficiency. Furthermore, a small amount of acetic acid, similar to the content in the mobile phase, was added to each sample. This acidification improved the peak shape of certain compounds, such as Amoxicillin and Asulam. However, it was found to suppress the signal of some compounds, such as Aldicarb. Optimization of these types of method conditions must be evaluated on a case-by-case basis taking into consideration the specific analyte list required for monitoring.
To improve the peak shape of the early eluting compounds, a 50 µL extension loop assembly (p/n: 430002012) was installed between the injector valve and the analytical column. This provides extra system volume for thorough mixing of the sample aliquot in the mobile phase prior to loading onto the column.
Method Performance Study Results
Using matrix-matched calibration standards in bottled mineral water, 98% of 194 compounds could be described using a linear regression model with 1/X weighting, with residuals within ±20%. Either 1/X2 weighting or a second-order regression was used for the remaining analytes.
Most compounds (97%) displayed a coefficient of determination (R2) value greater than 0.99 (>88% of compounds met criteria above 0.995). Example calibration curves and residuals across several compound classes are shown in Figure 2.
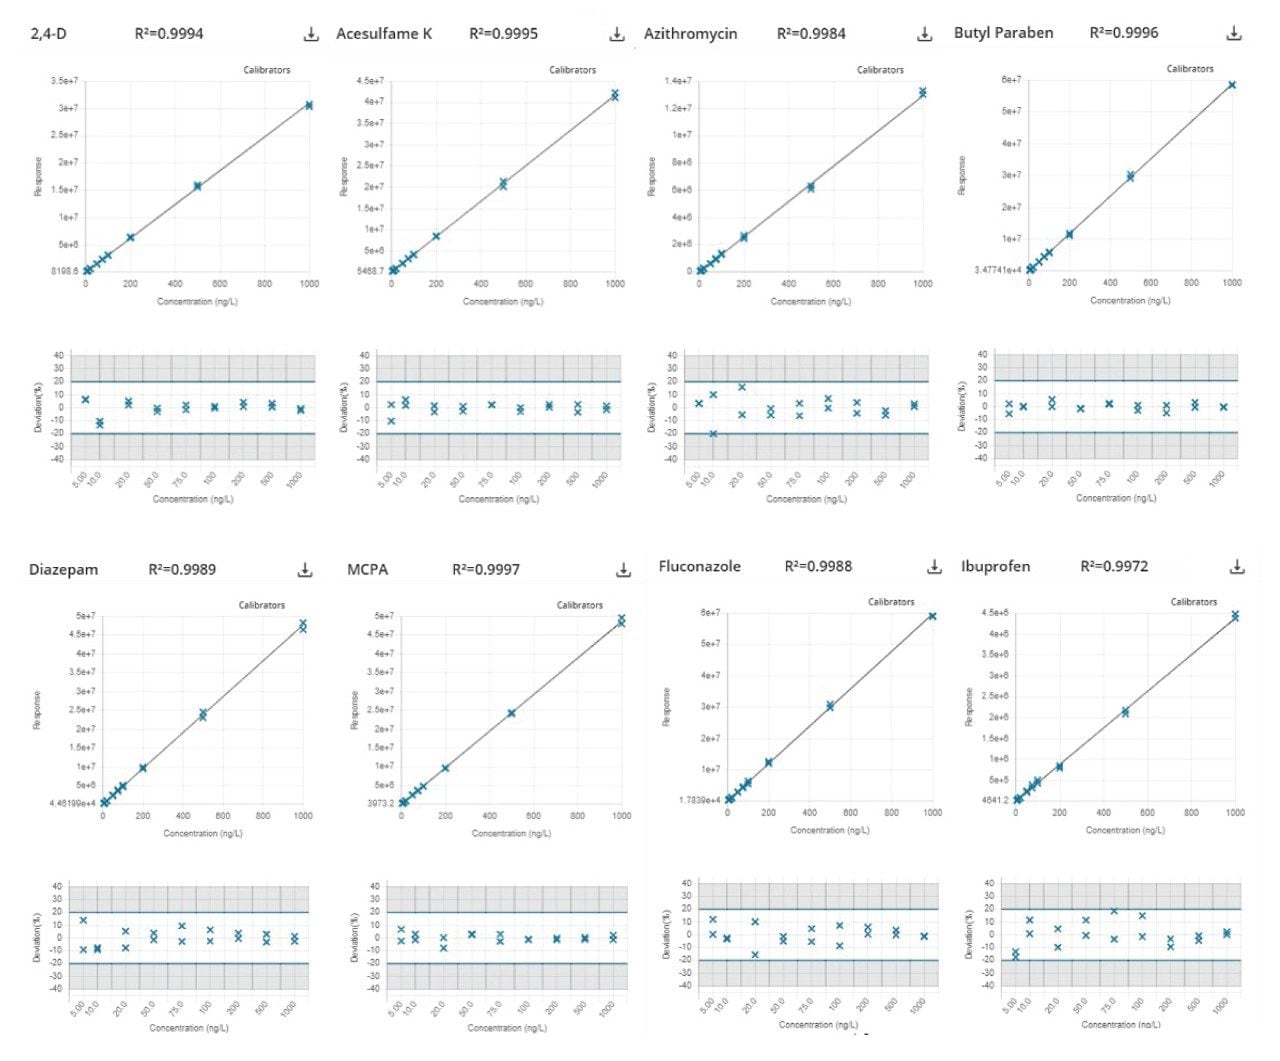
It was suspected that contributing factors to the compounds that fell below this coefficient of determination were solubility and stability. Daily preparation of standards was found to reduce these effects. Minimal matrix effects and losses throughout the run were observed, however, the use of internal standards would improve accuracy and account for these types of losses.
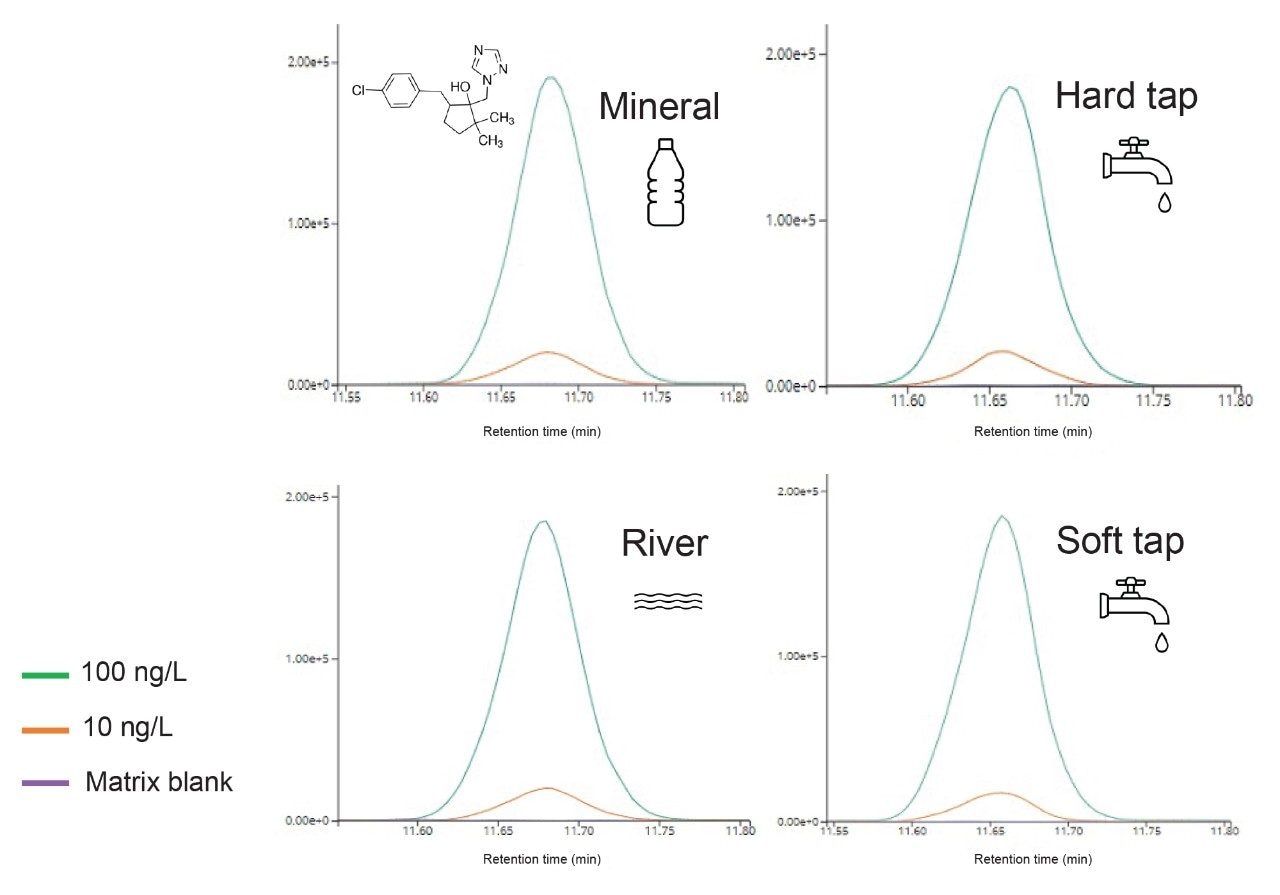
Figure 3 shows an example of Metconazole in different matrix samples. Peak shape and retention times were consistent while showing very little matrix effects.
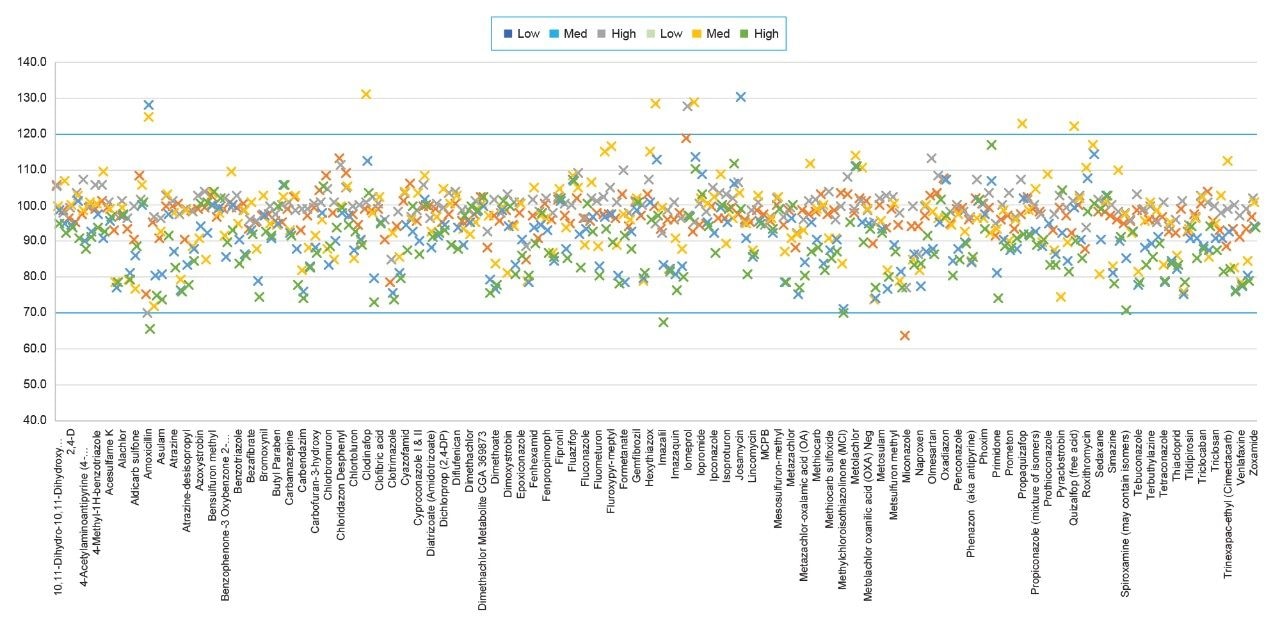
The method's performance was evaluated across three validation batches, covering typical water types - soft and hard drinking water, and surface water. Each of the batches contained six spiked samples at three levels - 10, 25, and 125 ng/L. Among independent compounds and levels, 97% of spiked samples fell within the acceptable tolerance range of 70% to 120% (ISO 21253–2:2019). The data from the most complex matrix tested, surface water at three spike levels, is displayed in Figure 4.
Trueness of the method was assessed from the recovery samples. For bottled and tap water matrices 154 analytes achieved acceptable recoveries while for surface water 74 analytes succeeded. The percentage RSD values for the recovery data in surface water batch referenced above are summarized by error bars in Figure 4.
Retention time for all analytes across the 3 method validation batches was stable, regardless of water type, with no significant change to peak shape (overall retention time within 3.2% RSD).
Conclusion
The updated EU Drinking Water and Water Framework Directives provide the regulatory framework for effective monitoring and management of water quality and include provisions for emerging contaminants. Ensuring compliance with these regulations and comprehensive coverage for an ever increasing analyte lists requires versatile, robust analytical methods and high performance LC/MS/MS systems. The direct-injection method investigated in this work is effective at detection of a wide range of PPCPs and pesticides at trace levels suitable for monitoring multiple water types for the presence of compound classes known or suspected to pose risks to human and environmental health. It further provides more rapid turn around time and greener operation than methods that rely upon high volumes of solvent and extensive sample preparation. Method performance was assessed using criteria described in ISO 21253–2:2019. The calibration characteristics, linearity, and residuals were excellent over the concentration range studied. Accuracy and precision were evaluated at three matrix QC levels with six replicate spikes and found to provide excellent performance for 154 analytes in tap and bottled water and 74 analytes in surface water matrix.
References
- “Contaminants of Emerging Concern including Pharmaceuticals and Personal Care Products” EPA.gov Last modified January 13, 2025. https://www.epa.gov/wqc/contaminants-emerging-concern-including-pharmaceuticals-and-personal-care-products
- “Directive (EU) 2020/2184 of the European Parliament and of the Council of 16 December 2020 on the quality of water intended for human consumption”. European-union.europa.eu. December 16 2020 https://eur-lex.europa.eu/eli/dir/2020/2184/oj
- “Directive 2000/60/EC of the European Parliament and of the Council of 23 October 2000 establishing a framework for Community action in the field of water policy”. European-union.europa.eu. Date of last review September 9 2021 https://eur-lex.europa.eu/eli/dir/2000/60/oj
- “Commission Implementing Decision (EU) 2022/1307 of 22 July 2022 establishing a watch list of substances for Union-wide monitoring in the field of water policy pursuant to Directive 2008/105/EC of the European Parliament and of the Council”. European-union.europa.eu. Date of adoption July 22 2022. https://eur-lex.europa.eu/eli/dec_impl/2022/1307
- Batt, Angela L., Mitch S. Kostich, and James M. Lazorchak. "Analysis of ecologically relevant pharmaceuticals in wastewater and surface water using selective solid-phase extraction and UPLC− MS/MS." Analytical Chemistry 80, no. 13 (2008): 5021–5030.
- Vanderford, Brett J., and Shane A. Snyder. "Analysis of pharmaceuticals in water by isotope dilution liquid chromatography/tandem mass spectrometry." Environmental science & technology 40, no. 23 (2006): 7312–7320.
- Reverté, Sandra, Francesc Borrull, Eva Pocurull, and Rosa Maria Marcé. "Determination of antibiotic compounds in water by solid-phase extraction–high-performance liquid chromatography–(electrospray) mass spectrometry." Journal of Chromatography A 1010, no. 2 (2003): 225–232.
- Cahill, Jeffery D., Edward T. Furlong, Mark R. Burkhardt, Dana Kolpin, and Larry G. Anderson. "Determination of pharmaceutical compounds in surface-and ground-water samples by solid-phase extraction and high-performance liquid chromatography–electrospray ionization mass spectrometry." Journal of Chromatography A 1041, no. 1–2 (2004): 171–180.
- Baker, David R., and Barbara Kasprzyk-Hordern. "Multi-residue analysis of drugs of abuse in wastewater and surface water by solid-phase extraction and liquid chromatography–positive electrospray ionisation tandem mass spectrometry." Journal of Chromatography a 1218, no. 12 (2011): 1620–1631.
- Shao, Bing, Dong Chen, Jing Zhang, Yongning Wu, and Chengjun Sun. "Determination of 76 pharmaceutical drugs by liquid chromatography–tandem mass spectrometry in slaughterhouse wastewater." Journal of Chromatography A 1216, no. 47 (2009): 8312–8318.
- “ISO 21253–2:2019 Water quality — Multi-compound class methods Part 2: Criteria for the quantitative determination of organic substances using a multi-compound class analytical method”. Iso.org. Accessed January 15 2025. https://www.iso.org/standard/70255.html
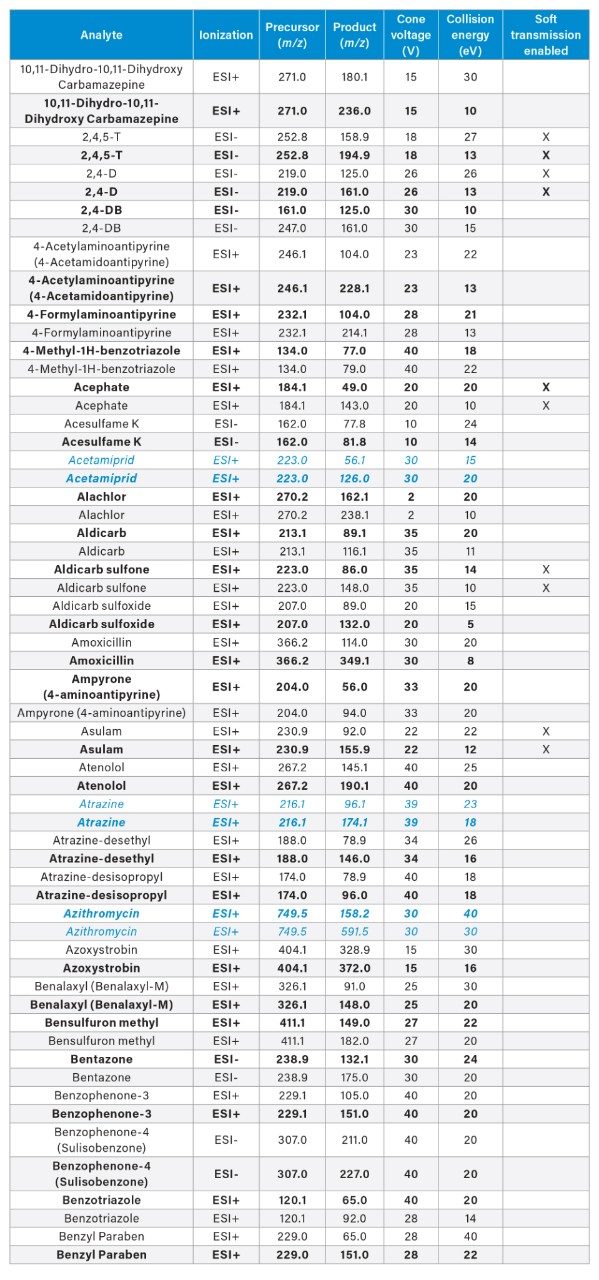
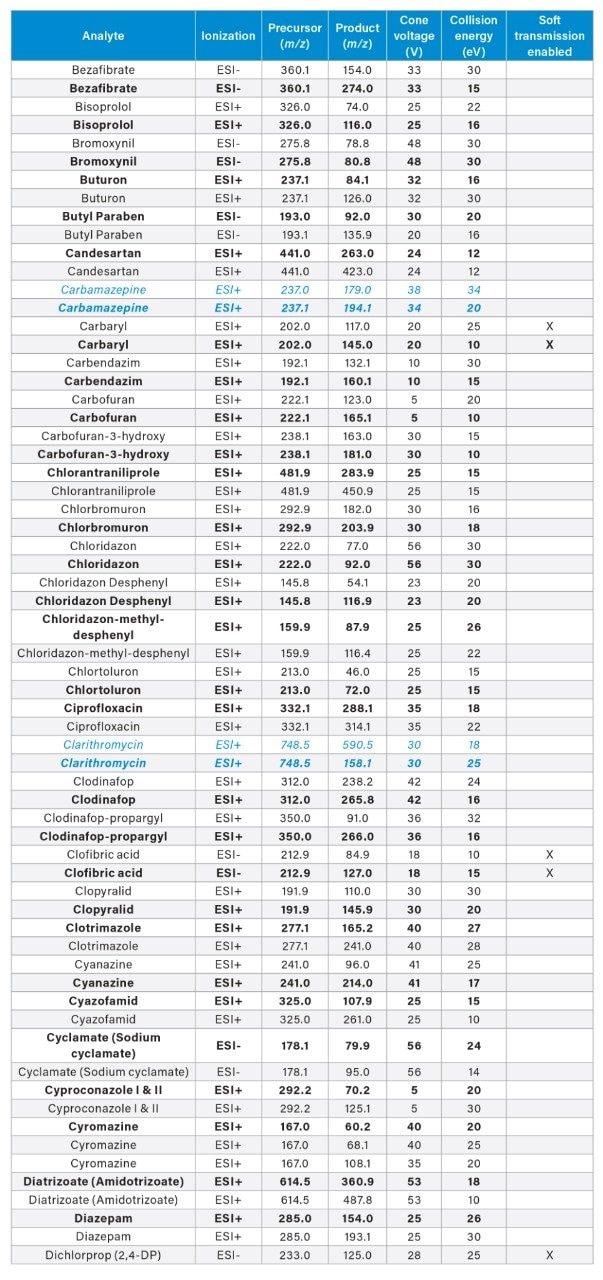
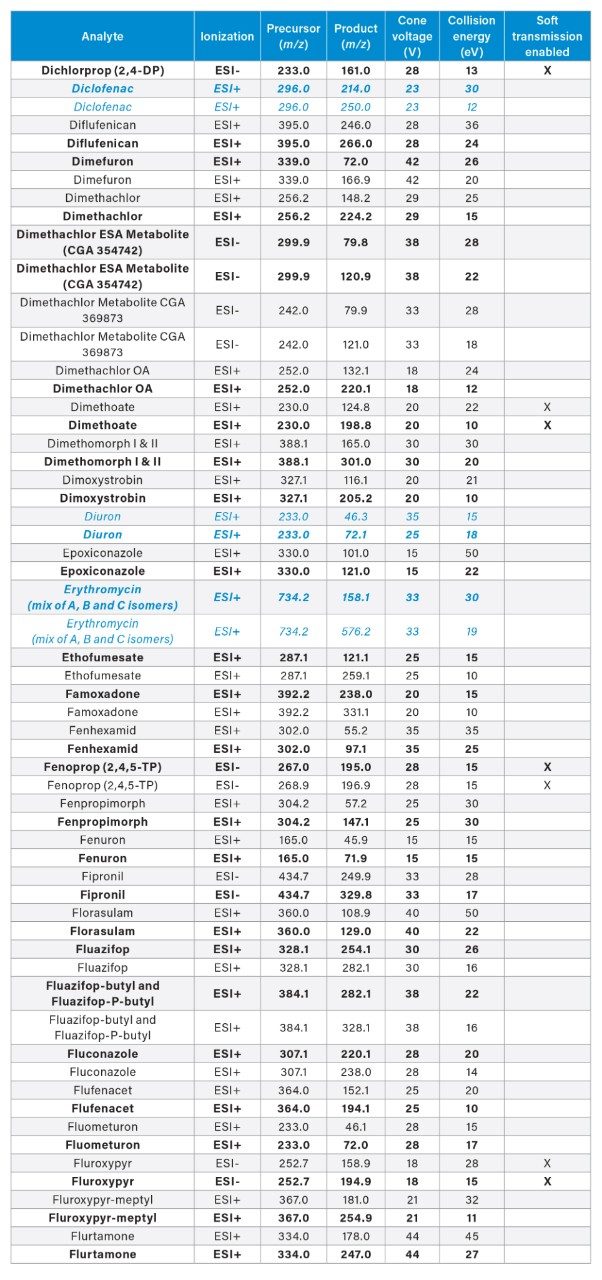
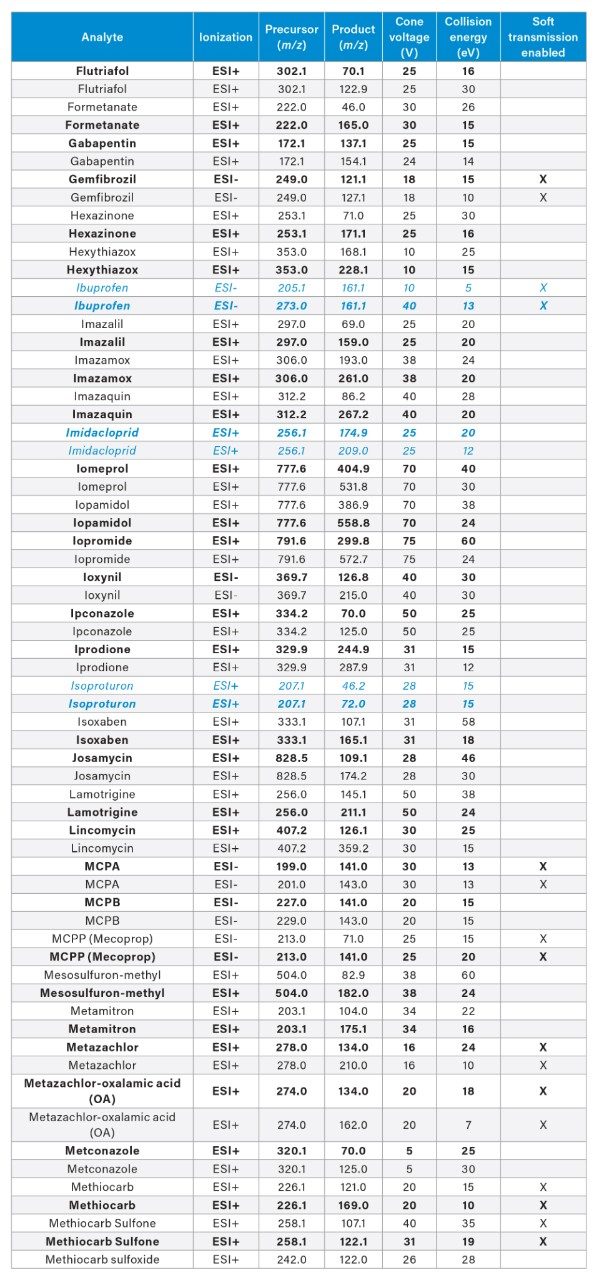
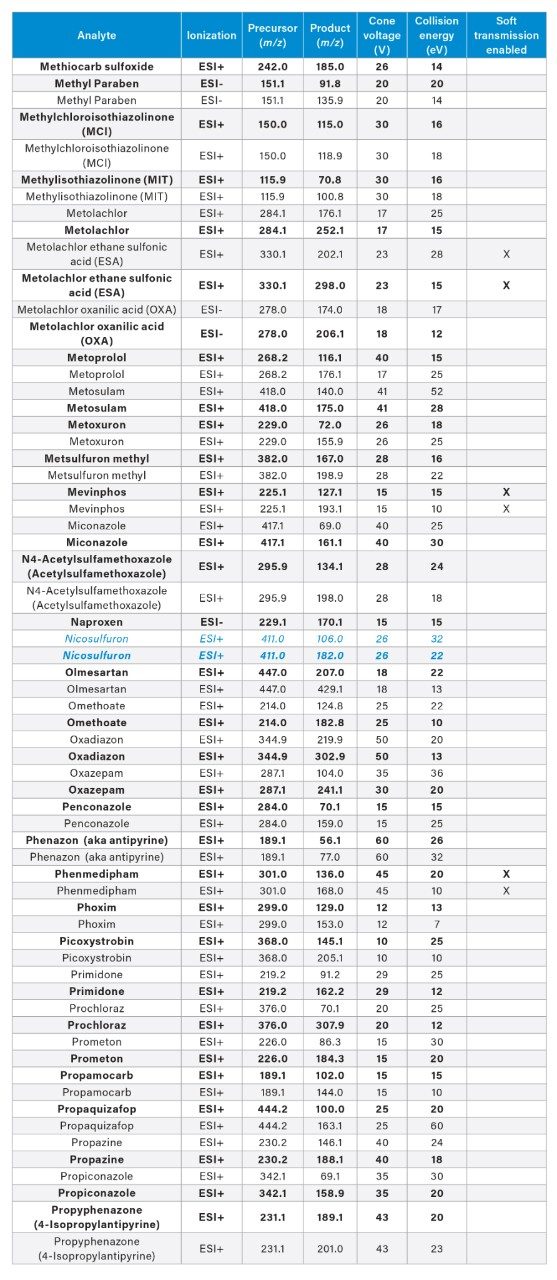
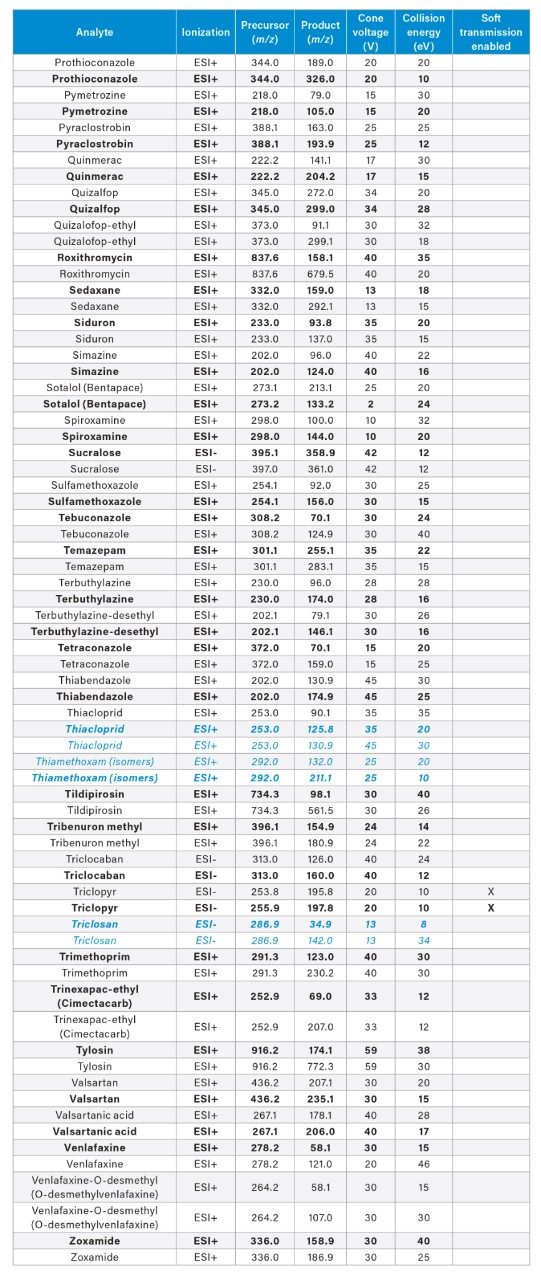
APPENDIX
MRM transitions for the analytes included in this app note. Optimum dwell time for target compounds was set automatically using the auto-dwell function so values may vary depending on acquisition windows. Quantitative transitions are in bold font. Analytes in blue italics are included in the EU WFD Annexes of October 26, 2022 (Document 52022PC0540).
Featured Products
720008819, May 2025