Kinetic Efficiency and Fractionation Range of GTxResolve™ Premier SEC 1000 Å 3 µm Columns
Abstract
This study explored the kinetic efficiency and fractionation range of GTxResolve Premier SEC 1000 Å 3 µm columns. These columns are advanced separation tools designed for the analysis of cell and gene therapy drug substances and products. DNA and RNA ladders are used herein for a set of fundamental comparison studies. Leveraging smaller, 3 µm ultra-wide pore (1000 Å) packing materials, these columns offer significant separation improvements over a conventional 5 µm columns. Benefits from the new column technology can be applied in one of two ways, that is to achieve either a faster, higher throughput run while maintaining equivalent efficiency or to gain a 30 to 40% increase in resolution. These advances in size exclusion chromatography are well timed as there is an increasing need for SEC analysis of new modalities, especially for the aggregate and integrity analysis of mRNA and other nucleic acid-based therapeutics.
Benefits
- Faster and higher throughput analyses compared to conventional 5 µm columns
- More reliable analysis of high molecular weight species (HMWS) due to reduced secondary (non-specific) electrostatic interactions
- When fixing analysis time or operating pressure, the new GTxResolve Premier SEC 1000 Å 3 µm Column systematically outperforms a conventional 5 µm column
Introduction
Size exclusion chromatography (SEC) is a historical method for size variant characterization of biopharmaceuticals that is becoming increasingly important for analysis of new modality drugs. Quantitation of high molecular weight species is one of the critical quality attributes for many of emerging gene therapeutics, including nucleic acids.1 One of the proposed purity requirements for mRNA vaccines is the measurement of aggregates by SEC, and it is expected that this chromatography will play a key role in quality assessment of other classes of RNA and DNA based therapeutics.2
Depending on the application, the payload genetic material can be diverse in size (from 100 nucleotides CRISPR guide RNA to 4700 bp DNA viral vector genome). More commonly used nucleic acids are between 500 and 5000 nucleotides in length. For example, the 4500 nt long COVID-19 mRNA for use as a vaccine are about 25 nm (hydrodynamic radius).3 The SEC separation of such a species requires use of columns with an appropriately large pore size. However, selection of appropriate SEC columns usually has to be determined experimentally, due to ambiguous correlation of length with hydrodynamic radius in solution and the differences between column manufacturers on reporting of the nominal pore size of SEC columns. It has been established that, columns typically used for the analysis of biopharmaceuticals, with 125 and 250 Å pore diameter packing materials, might only be suitable for oligonucleotides 30 to 150 residues in length.4 A recent study comparing columns with different pore sizes suggested that a 1000 Å packing material might provide optimal separations for non-replicating RNA of these sizes.5
Wide-pore columns (>500 Å, sometimes referred to as ultra-wide pore) are normally available only with large particles (≥5 µm), which limits the throughput of an analysis and necessitates the use of longer column formats to achieve a desired resolution. This, in turn, increases the amount of sample required for an analysis, which is often a limiting factor for the routine analysis for these novel therapeutics, most especially new personalized mRNA cancer vaccines.6
On the other hand, the polyanionic nature of the nucleic acids, means that they are susceptible to adsorptive secondary interactions, which need to be limited for a successful SEC analysis. This requires the use of low adsorption column hardware in addition to an inert packing material chemistry to achieve the best results and most accurate sizing measurements.
To address these issues, we have explored the use of smaller - 3 µm - PEO bonded particles of average 1000 Å pore size that were packed into low adsorption MaxPeak™ HPS Premier Hardware and tested with large nucleic acid ladder samples. In this Application Note, we describe the fractionation range of the new GTxResolve Premier SEC 1000 Å 3 µm columns and their use for nucleic acid separation. Moreover, we explore the kinetic efficiency of this column and compare it to a conventional 5 µm column with a similar pore size. Calibration curves, plate numbers, separation impedance, and kinetic performance limits were systematically compared and found to be superior with the new particle and related column technology.
Experimental
Sample and Mobile Phase Preparation
An aliquot of dsDNA 50 to 1350 Ladder (Waters p/n: 186010778) was reconstituted in 1000 µL of nuclease free water to concentration of 0.1 mg/mL, 100 bp dsDNA Ladder (New England Biolabs, N3231S), Low Range ssRNA Ladder (New England Biolabs, N0364S), and ssRNA Ladder (New England Biolabs, N0362S) were diluted ten times with nuclease free water and transferred to a vial and directly injected into the SEC column.
Note: Caution should be taken if injecting highly aggregated samples. It is recommended to centrifuge down particulates and/or syringe filter such samples before injection onto an SEC column.
LC Conditions
|
LC system: |
ACQUITY™ H-Class Plus Bio System with Binary Solvent Management (BSM) |
|
Detection: |
ACQUITY UPLC™ TUV Detector with 5 mm titanium flow cell, 260 nm and 230 nm; (2 points/s) |
|
Vials: |
QuanRecovery™ with MaxPeak HPS 12 x 32 mm Screw Neck Vial, 300 µL, 100/pk, (p/n: 186009186) |
|
Column: |
Analytical: GTxResolve Premier SEC 1000 Å 3 µm Column, 150 x 4.6 mm (p/n: 186010735) |
|
Column temperature: |
25 °C |
|
Sample temperature: |
6 °C |
|
Injection volume: |
1.0–5.0 µL (scaled to flow rate) |
|
Flow rate: |
0.05, 0.1, 0.175, 0.25, 0.40, 0.50, and 0.60 mL/min |
|
Mobile phase: |
2xPBS buffer, 0.2 µm sterile filtered (Mobile phase used for only two days or otherwise made with azide to impede bacterial growth). |
Results and Discussion
A common strategy to improve the kinetic performance (speed and efficiency) of liquid chromatography separations is to use columns packed with increasingly smaller particles. Reverse phase (RP) columns packed with sub-2 µm porous particles were commercially introduced in 2004, while sub-2 µm SEC columns were introduced in 2011. This column led to the introduction of a new term, namely “ultra-high-performance SEC” (UHP-SEC). The idea behind the use of very fine particles is to improve separation efficiency by reducing both the eddy dispersion in packed columns (A term in the common plate height equation) and the resistance to mass transfer as the solutes partition between the stagnant liquid phase in the pores of a SEC column and the moving mobile phase in the interstitial column volume (C term). Today, various 150-300 Å SEC columns are commercially available in sub-2 and sub-3 µm formats.7 However, small particles generate high pressure. Pressure is generated along a column in proportion to the reciprocal of the square of the particle diameter. It is known that SEC columns with very large pore diameters (ultra-wide pores) are mechanically less stable than columns with smaller pores. It is therefore challenging to produce ultra-wide pore particles with higher pressure capabilities. Thus, commercially available ultra-wide pore SEC columns (i.e. 500 or 1000 Å) are mostly made of 5 µm particles, which results in compromised kinetic performance. The GTxResolve Premier SEC Column is the first 3 µm, 1000 Å column to combine higher pressure capability with superior kinetic performance. With its balanced particle size and pore size, this column gives a range of viable operating conditions for varying types of samples.
Calibration curves and fractionation range
The sizing range of the new GTxResolve Premier SEC 1000 Å, 3 µm Column was compared with a commercially available 5 µm silica 1000 Å particle column. Calibration curves were measured by injecting both 50 bp and 100 bp DNA ladders as well as ssRNA and low range ssRNA ladders. The results were plotted as the number of base pairs (on a logarithmic scale) versus the normalized elution volume (Ve,n) of the species. In turn, the SEC calibration curve essentially illustrates the pore size distribution (PSD) and average pore size of the accessible pores of the column.8 It is therefore an appropriate way to compare the pore structure (morphology) of different SEC columns.
When the calibration curves obtained with the two columns were compared, they showed a high degree of similarity for both DNA and ssRNA homologues. Figure 1. shows the calibration curves obtained for the DNA ladders.
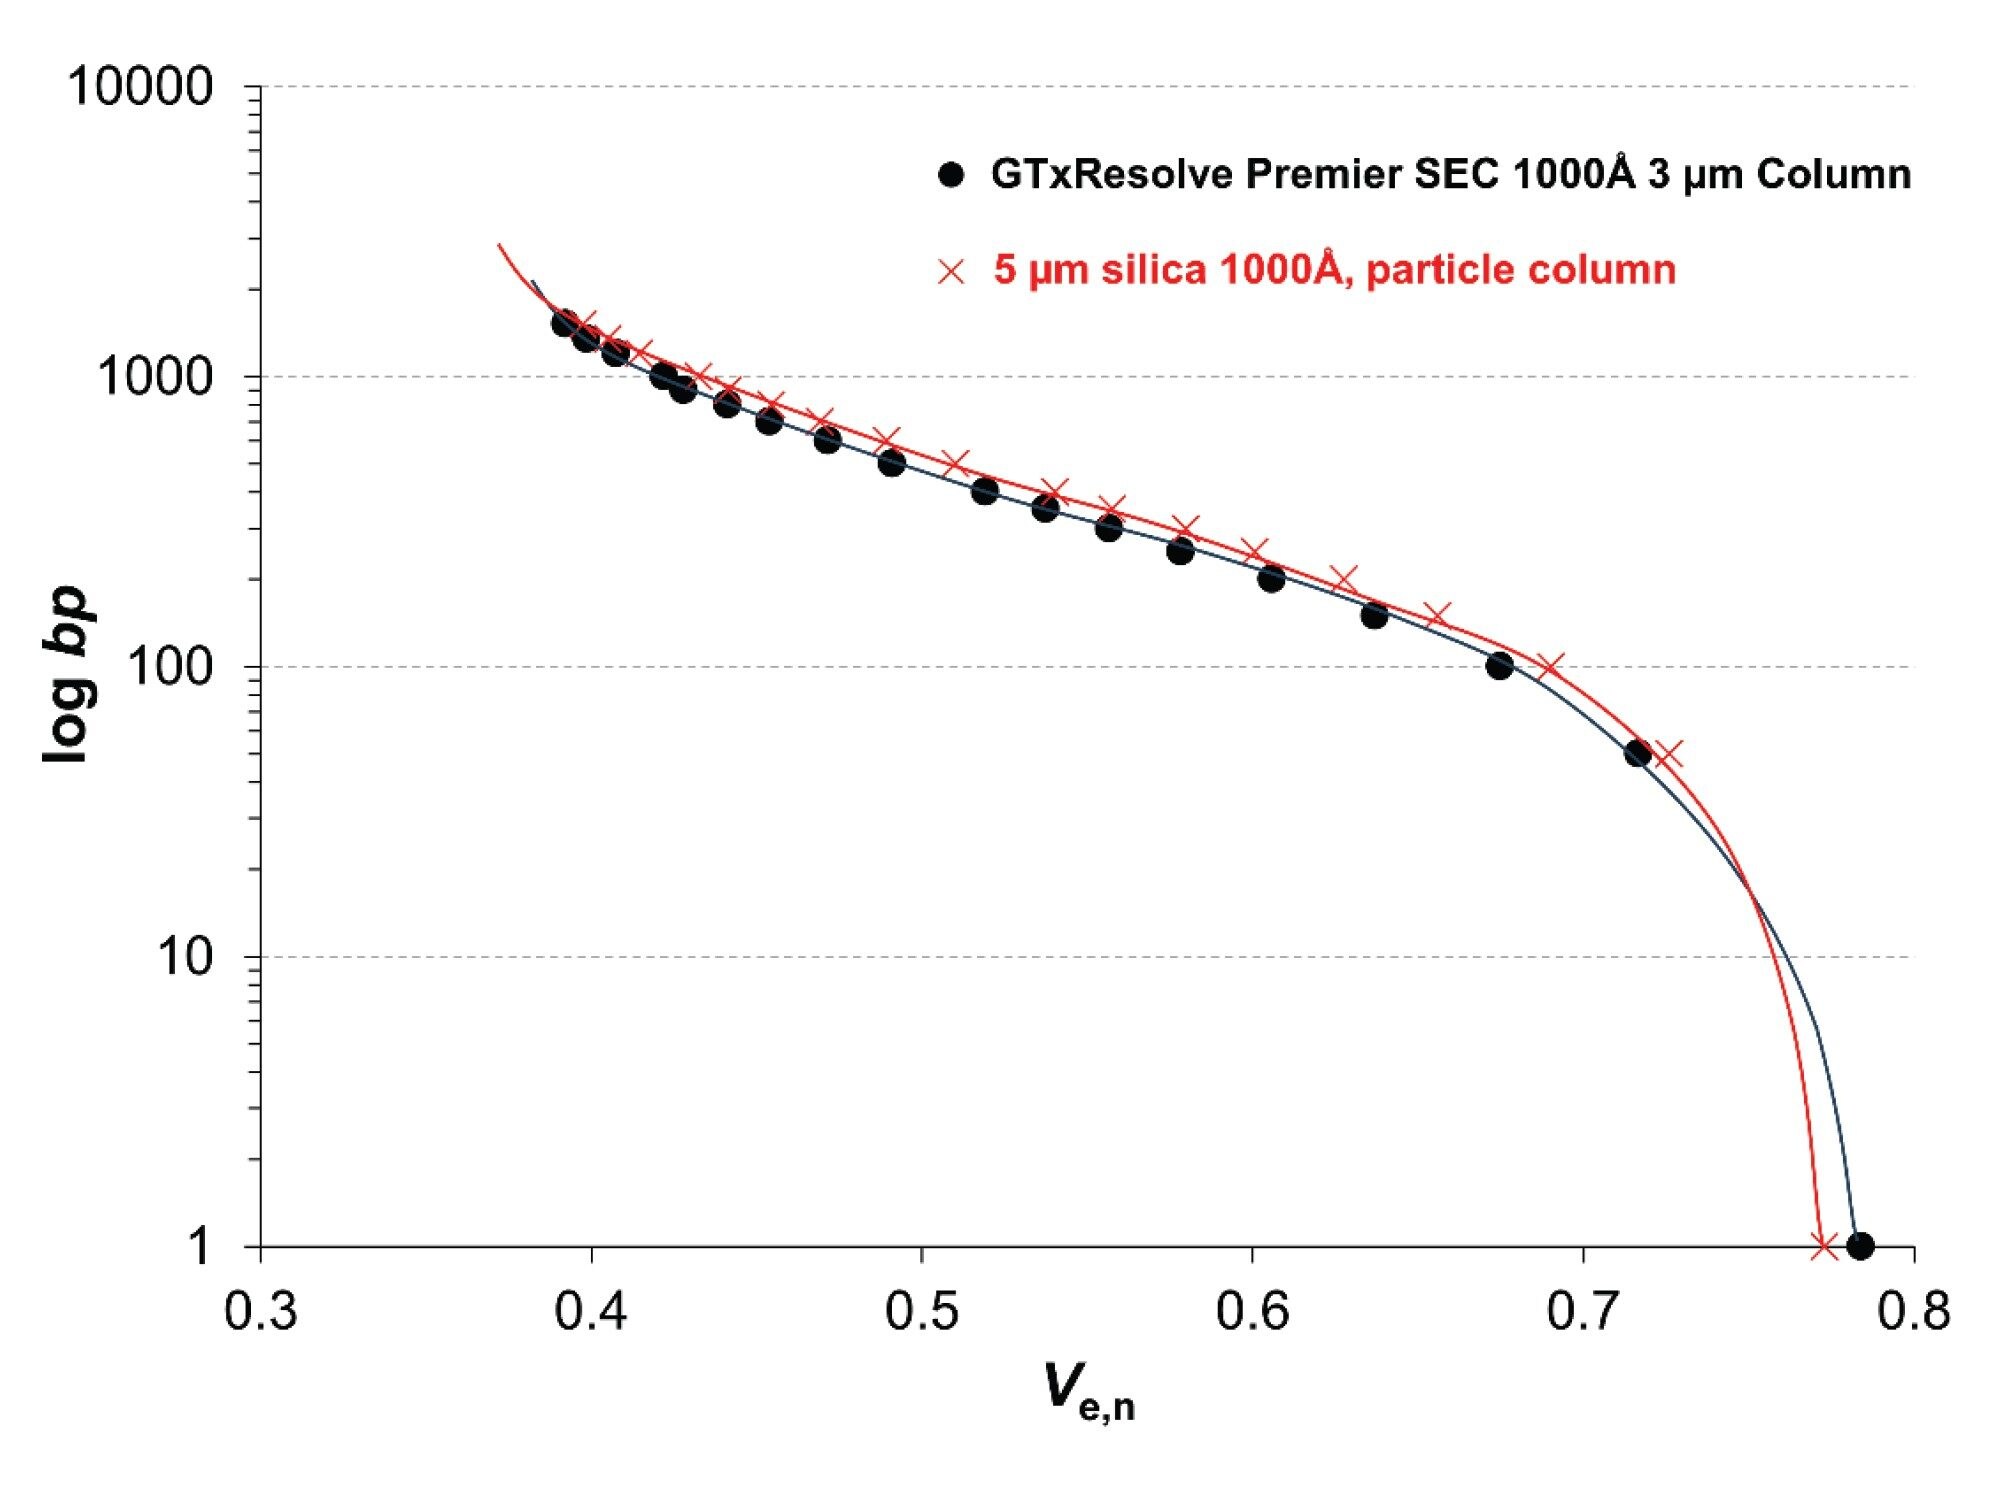
The right end of the calibration curve is determined by the total porosity (or total permeation) of the packing material. A slightly higher porosity was observed for the GTxResolve Premier SEC Column (Ve,n = 0.784 versus 0.773).
The elution window between the exclusion limit (left end of the calibration curve) and the permeation limit is often referred to as the "fractionation range" or "sizing range" of the column. This comparison suggests that the fractionation range of the two columns is almost identical. The slope of the calibration curve is a consequence of the PSD. Since the slopes are very similar, the PSD of the two materials should also be similar. The vertical position of the curve is determined by the mean pore diameter. Again, as its position is very similar, the mean pore diameter of the two packing materials is very comparable.
In conclusion, a comparison of the calibration curves suggests that the sizing range, mean accessible pore diameter and expected selectivity of the two columns are very similar. The inflection point occurs at ~ 350–400 bp DNA size and ~ 3 kb ssRNA size. These sizes correspond to the middle of the elution window (where the distribution coefficient is KSEC ~ 0.5).
Achievable plate heights and plate numbers
The kinetic efficiency of the columns was first evaluated using plate height curves. A range of flow rates was set (between 0.05 and 0.60 mL/min) and the plate height (H) values obtained were plotted as a function of the linear velocity of the mobile phase (u). To cover a wide range of solute sizes, H - u curves were plotted for 100, 300, 500, and 1350 bp DNA. On average, the GTxResolve Premier SEC 1000 Å, 3 µm Column produced 1.5 to 2 times lower H values than the 5 µm silica 1000 Å column at a given flow rate. This means that when comparing columns of the same length, the 3 µm column results in 1.5–2 times higher plate number values (N) and therefore ~ 1.2 to 1.4 times higher resolution, given that Rs is proportional to √N. This also means that the same efficiency and resolution can be maintained on a 1.5–2 times shorter 3 µm column as on a 5 µm column. Analysis time can therefore be reduced by a factor of 1.5–2.
Column permeability and separation impedance
When comparing column performance, it is important to consider not only plate numbers, but also the pressure (Δp) required to achieve a given plate number (N). This is especially true for SEC, where low-pressure conditions are preferred to avoid any pressure and friction-related artefacts. Common plate height curves lack permeability considerations therefore other performance characteristics are worth studying too.
During the flow study, column pressures were recorded and corrected for system pressure. Then column permeability was calculated. We obtained K = 1.22 x 10⁻¹⁰ cm2 for the GTxResolve Premier SEC 1000 Å, 3 µm Column and K = 3.72 x 10⁻¹⁰ cm2 for the 5 µm silica column.
The overall column performance depends on achievable plate heights, column permeability and the analysis time, the latter being related to column dead time (t0). Therefore, H–u curves alone do not provide information about the achievable separation time, but only about the reachable peak widths. The separation impedance (E, introduced by Knox, sometimes called effective column resistance) is a combined measure to consider peak width, analysis time and column permeability at the same time.9 The following formula is often used:
E = (t0∙∆p)/(N2∙η) = H2/K
(Eq.1)
Where η is the viscosity of the mobile phase. Note that E is dimensionless and the lower its value the more favorable the separation. Figure 2. shows the obtained separation impedance plots for a small (100 bp) and a large (1350 bp) DNA as a function of linear velocity.
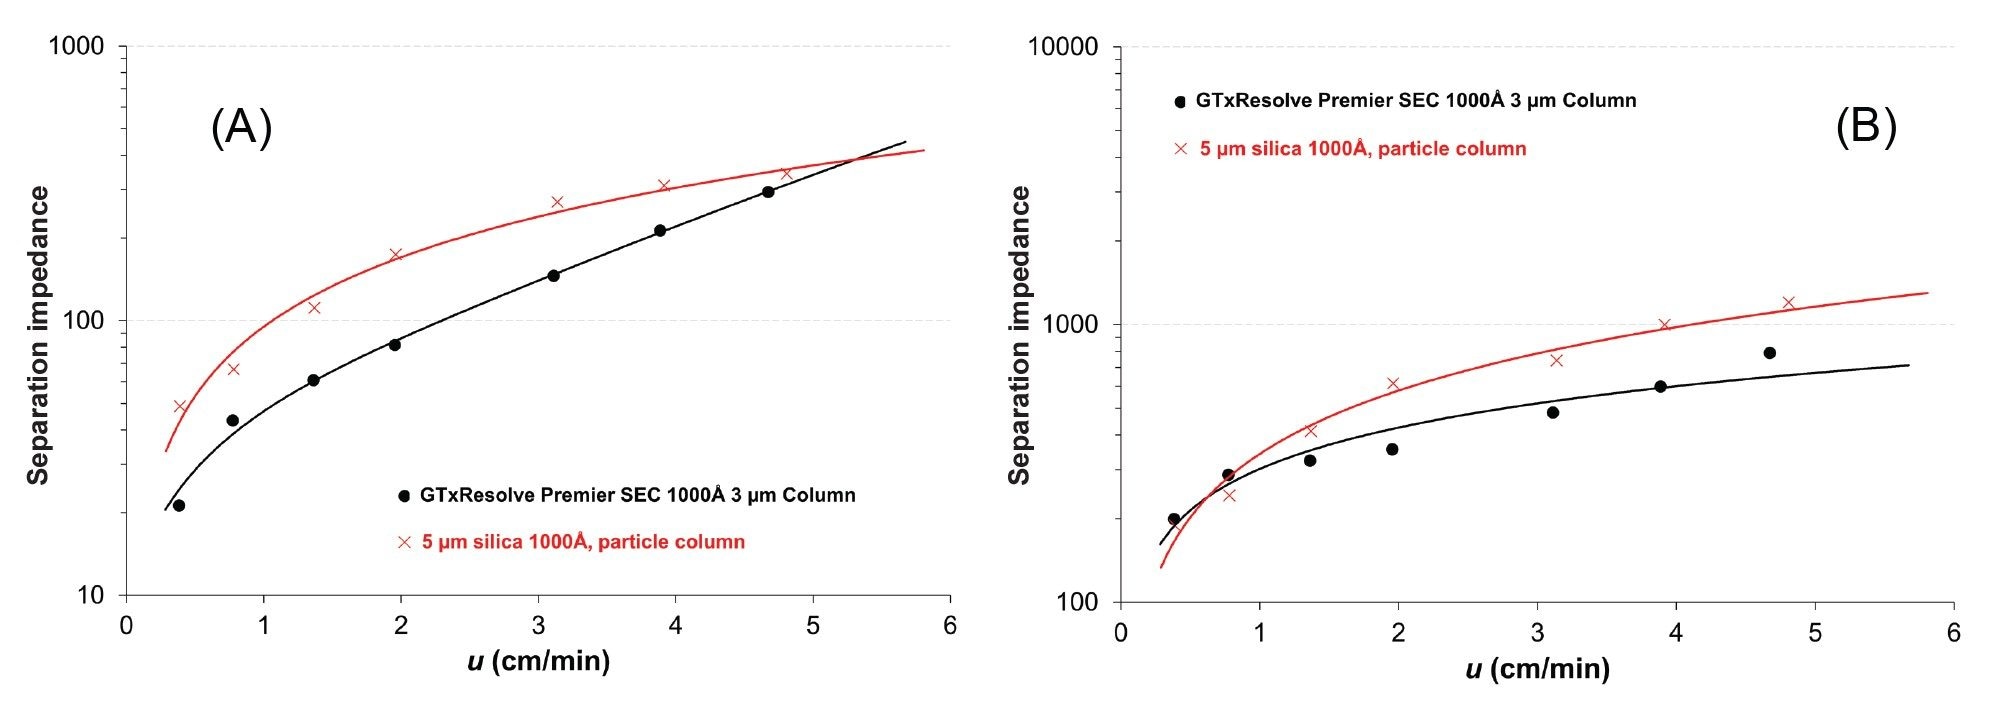
For the 100 bp DNA, the 3 µm column resulted in E = 20–300, while the 5 µm column provided E = 50–350. The 3 µm column showed the largest benefit especially in the lower flow rate regime.
For the large DNA, the 3 µm and 5 µm columns gave impedance values of E = 200–800 and E = 200–1200 respectively. For this large DNA, the 3 µm column appears to be particularly advantageous at higher flow rates. The same trend was observed for all analytes (across the entire fractionation range).
Kinetic plot comparison
Finally, it is also worth considering what to expect at a fixed column pressure. This sort of analysis can give ideas about what column type to use to achieve a certain desired result within a particular run time.
Poppe proposed the “Poppe plot” in which the plate time (t0/N) is plotted against the plate number (N).10 This is a neat tool for visualizing the compromise between separation speed and efficiency. Later Desmet introduced the “kinetic plot” theory, as a general tool to map the kinetic performance of various packing materials at a fixed column pressure (Δpfixed).11 The following equations are proposed to estimate the achievable plate number and corresponding analysis time (t0):
N = (∆pfixed)/η (K/(u∙H))
(Eq.2)
t0 = (∆pfixed)/η (K/u2)
(Eq.3)
Representative examples are shown in Figure 3. Kinetic performance limit plots are provided for the 100 and the 1350 bp DNA species when operating the columns at Δp = 100 bar.
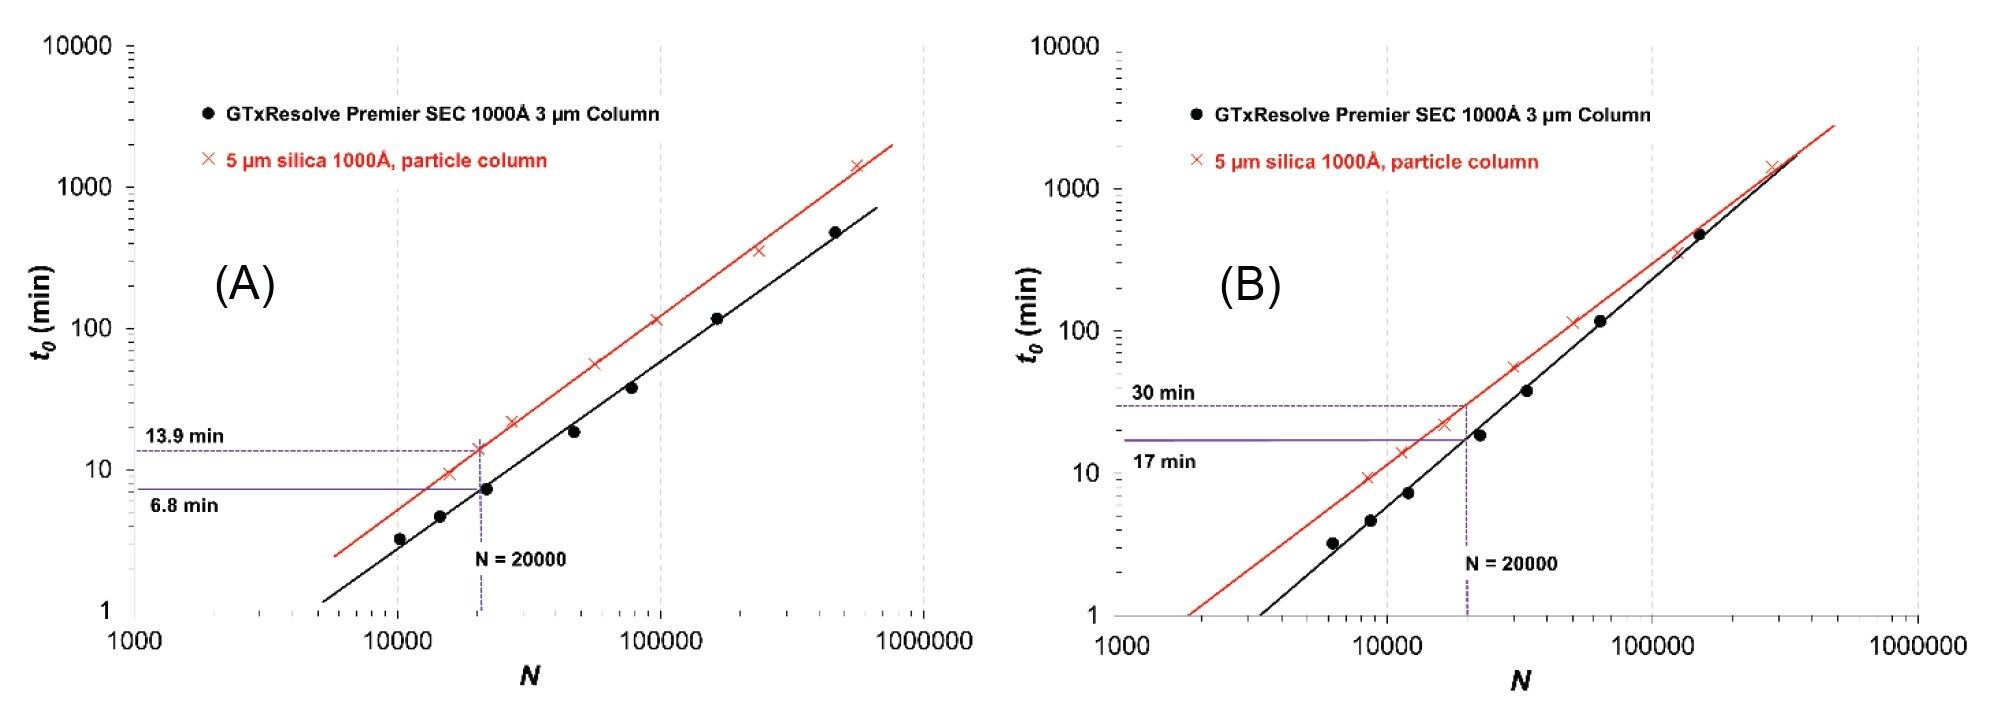
As can be seen, the 3 µm column always outperforms the 5 µm silica 1000 Å particle column in terms of analysis time. This can be most clearly seen with how the black curve runs below the red curve.
For the small DNA (100 bp), N = 20000 can be achieved within 6.8 min analysis time using the 3 µm column, while the same efficiency can be obtained in 13.9 min with the 5 µm column.
As for the large DNA (1350 bp), 20000 plates can be obtained in 17 and 30 min with the 3 and 5 µm columns, respectively.
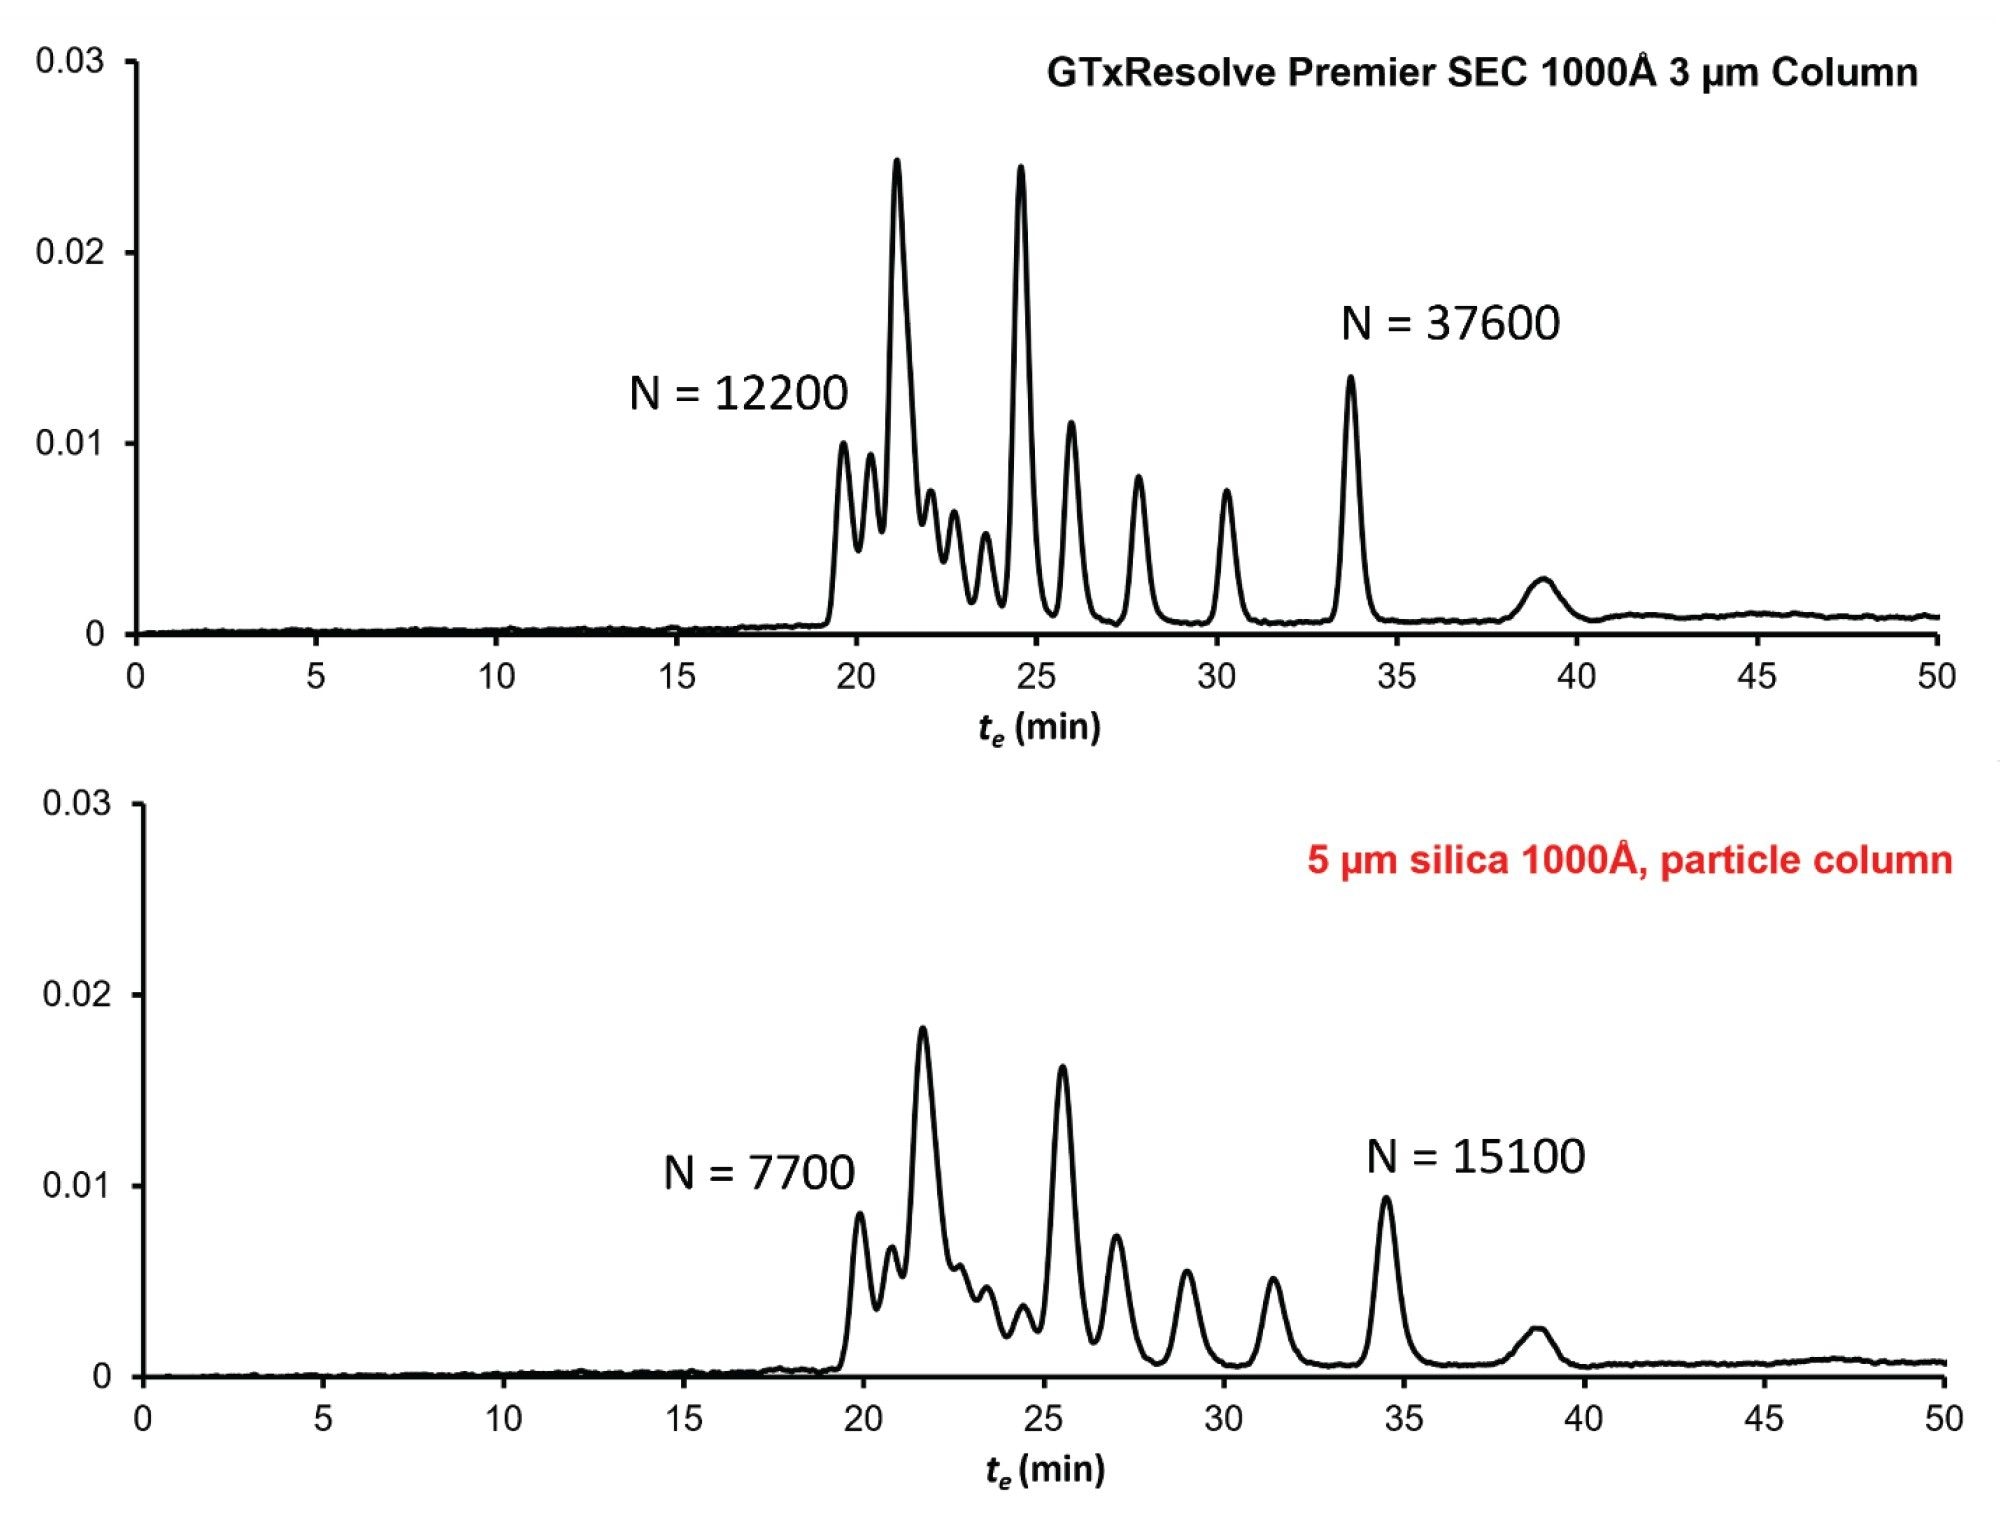
Example: separation of a DNA ladder
Figure 4. shows example chromatograms obtained with the DNA ladder when the columns were run at F = 0.05 mL/min. The plate numbers are given for the first eluted peak (1500 bp DNA) and the last eluted peak (100 bp DNA). The GTxResolve Premier SEC 1000 Å, 3 µm Column gave approximately two times higher plate numbers compared to the 5 µm silica 1000 Å particle column. Improvements in resolution between all peak pairs is clear with the application of the 3 µm particle column.
Conclusion
A new ultra-wide pore 1000 Å, 3 µm Column has been introduced and is designed for the fast and efficient separation of cell and gene therapy drug products and drug substances, such as intact mRNAs, LNP aggregates, plasmid DNA topological forms, and others. The unique small particle size and high mechanical stability of the GTxResolve Premier SEC 1000 Å 3 µm Column provides a new level of separation efficiency. Plate height, separation impedance, and kinetic plot analysis demonstrated the superior overall efficiency of the new column compared to other conventional 5 µm material.
References
- Fekete S., Doneanu C., Addepalli B., Gaye M., Nguyen J., Alden B., Birdsall R., Han D., Isaac G., Lauber M., Challenges and Emerging Trends in Liquid Chromatography-Based Analyses of mRNA Pharmaceuticals, J. Pharm. Biomed. Anal. 224 (2023) 115174, https://doi.org/10.1016/j.jpba.2022.115174.
- Analytical Procedures for mRNA Vaccine Quality (Draft Guidelines) - 2nd Edition, Posting Date: 28-Apr-2023, Access Date: 28-Feb-2024. https://www.uspnf.com/notices/analytical-procedures-mrna-vaccines-20230428.
- Tan Y.Z., Qiao L.Z., Wang S.S., Zhang J., Qian J., Zhu M., Yao S.J., Lin D.Q., Enhanced Adsorption Performance of Varying-Length mRNA on Oligo dT Affinity Resins Through Optimal Pore Size and Grafting, Biochem. Eng. J. 203 (2024) 109213, https://doi.org/10.1016/j.bej.2023.109213.
- Gilar M., Doneanu C., Gaye M.M., Liquid Chromatography Methods for Analysis of mRNA Poly(A) Tail Length and Heterogeneity, Anal. Chem. 95 (2023) 14308–14316. https://doi.org/10.1021/acs.analchem.3c02552.
- De Vos J., Morreel K., Alvarez P., Vanluchene H., Vankeirsbilck R., Sandra P., Sandra K., Evaluation of Size-Exclusion Chromatography, Multi-Angle Light Scattering Detection and Mass Photometry for the Characterization of mRNA, J. Chromatogr. A 1719 (2024) 464756. https://doi.org/10.1016/j.chroma.2024.464756.
- Weber J. S., Carlino M.S., Khattak A., Meniawy T., Ansstas G., Taylor M.H., (...) & Zaks T., Individualised Neoantigen Therapy Mrna-4157 (V940) Plus Pembrolizumab Versus Pembrolizumab Monotherapy in Resected Melanoma (Keynote-942): A Randomised, Phase 2B Study. The Lancet, 403 (2024) 632–644. https://doi.org/10.1016/S0140-6736(23)02268-7.
- Goyon A., Beck A., Colas O., Sandra K., Guillarme D., Fekete S., Evaluation of Size Exclusion Chromatography Columns Packed With Sub-3 μm Particles for the Analysis of Biopharmaceutical Proteins, J. Chromatogr. A 1498 (2017) 80–89. https://doi.org/10.1016/j.chroma.2016.11.056.
- Harlan J.E., Picot D., Loll P.J., Garavito R.M., Calibration of Size-Exclusion Chromatography: Use of a Double Gaussian Distribution Function to Describe Pore Sizes, Anal. Biochem. 224 (1995) 557-563. https://doi.org/10.1006/abio.1995.1087.
- Bristow P.A., Knox J.H., Standardization of Test Conditions for High Performance Liquid Chromatography Columns, Chromatographia 10 (1977) 279–289. https://doi.org/10.1007/BF02263001.
- Poppe H., Some Reflections on Speed and Efficiency of Modern Chromatographic Methods, J. Chromatogr. A 778 (1997) 3–21. https://doi.org/10.1016/S0021-9673(97)00376-2.
- Desmet G., Clicq D., Gzil P., Geometry-Independent Plate Height Representation Methods for the Direct Comparison of the Kinetic Performance of LC Supports With a Different Size or Morphology, Anal. Chem. 77 (2005) 4058–4070. https://doi.org/10.1021/ac050160z.
720008284, March 2024