Utilizing the New Xevo™ TQ Absolute IVD for the UPLC-MS/MS Analysis of Serum Estrogens for Clinical Research
Este es un resumen de la aplicación y no contiene una sección experimental detallada.
Solo para fines de investigación. No se debe utilizar para procedimientos de diagnóstico.
Abstract
This application brief demonstrates the high analytical sensitivity and quantitative performance of the Xevo TQ Absolute IVD Mass Spectrometer for the analysis of serum estrogens for clinical research.
Benefits
- Utilizing the Xevo TQ Absolute IVD for low level quantification of 17β-estradiol and estrone
- Simple liquid/liquid sample preparation method
- UPLC separation of 17β-estradiol and estrone for selective detection
Introduction
The two major biologically active estrogens in non-pregnant humans are 17β-estradiol (E2) and estrone (E1). E2 is produced primarily in the ovaries and testes by the aromatization of testosterone, whereas most of E1 is derived from androstenedione. E2 can be metabolized to E1 and conversion of E1 to E2 is also possible, making the measurement of both compounds desirable.
The greatest challenge when analyzing E2 and E1 is the requirement to measure down to low concentration levels for certain clinical research applications. Currently, some immunoassay techniques lack analytical sensitivity and more commonly selectivity, while published LC-MS/MS methods use large sample volumes with complex sample extraction, often including derivatization.
Enhanced analytical sensitivity, robustness, and reliability over six orders of linear dynamic range is achieved using the Xevo TQ Absolute IVD Mass Spectrometer, featuring StepWave™ XS ion transfer optics and an Xtended Dynamic Range (XDR). Coupling this with a simple sample preparation method and UPLC™ separation of the estrogens allows for a highly selective and analytical sensitivity method to analyze E2 and E1 for clinical research.
Experimental
Sample Preparation and UPLC-MS/MS Analysis
E2 & E1 certified reference solutions and their stable labeled internal standards (13C3) were purchased from Merck (Gillingham, UK). Calibrators were prepared in a surrogate matrix of MSG4000 stripped serum purchased from Golden West Biologicals (Temecula, CA). The calibration range for E2 was 2–1000 pg/mL and 1–1000 pg/mL for E1. The QC samples were prepared in a surrogate matrix of MSG4000 stripped human serum purchased from Golden West Biologicals (Temecula, CA) at 3.2 pg/mL, 10.5 pg/mL, and 700 pg/mL. Water, methanol, and ethyl acetate were purchased from Fisher Scientific (Loughborough, UK). Ammonium fluoride and hexane were purchased from Merck (Gillingham, UK).
To convert conventional mass units (pg/mL) to SI units (pmol/L), multiply by 3.671 for E2 & 3.699 for E1.
To 250 μL of sample, 20 μL of internal standard was added and mixed. Liquid/liquid extraction was performed by adding 1 mL of 85:15 (v:v) hexane:ethyl acetate, mixing thoroughly for 10 minutes. Samples were centrifuged at 4000 g for 5 minutes prior to 700 μL of the top organic layer being transferred into a 96-well plate containing 1 mL glass inserts (Waters p/n: 186000855). Samples were evaporated to dryness and reconstituted in 20 μL of methanol followed by 30 μL of distilled water.
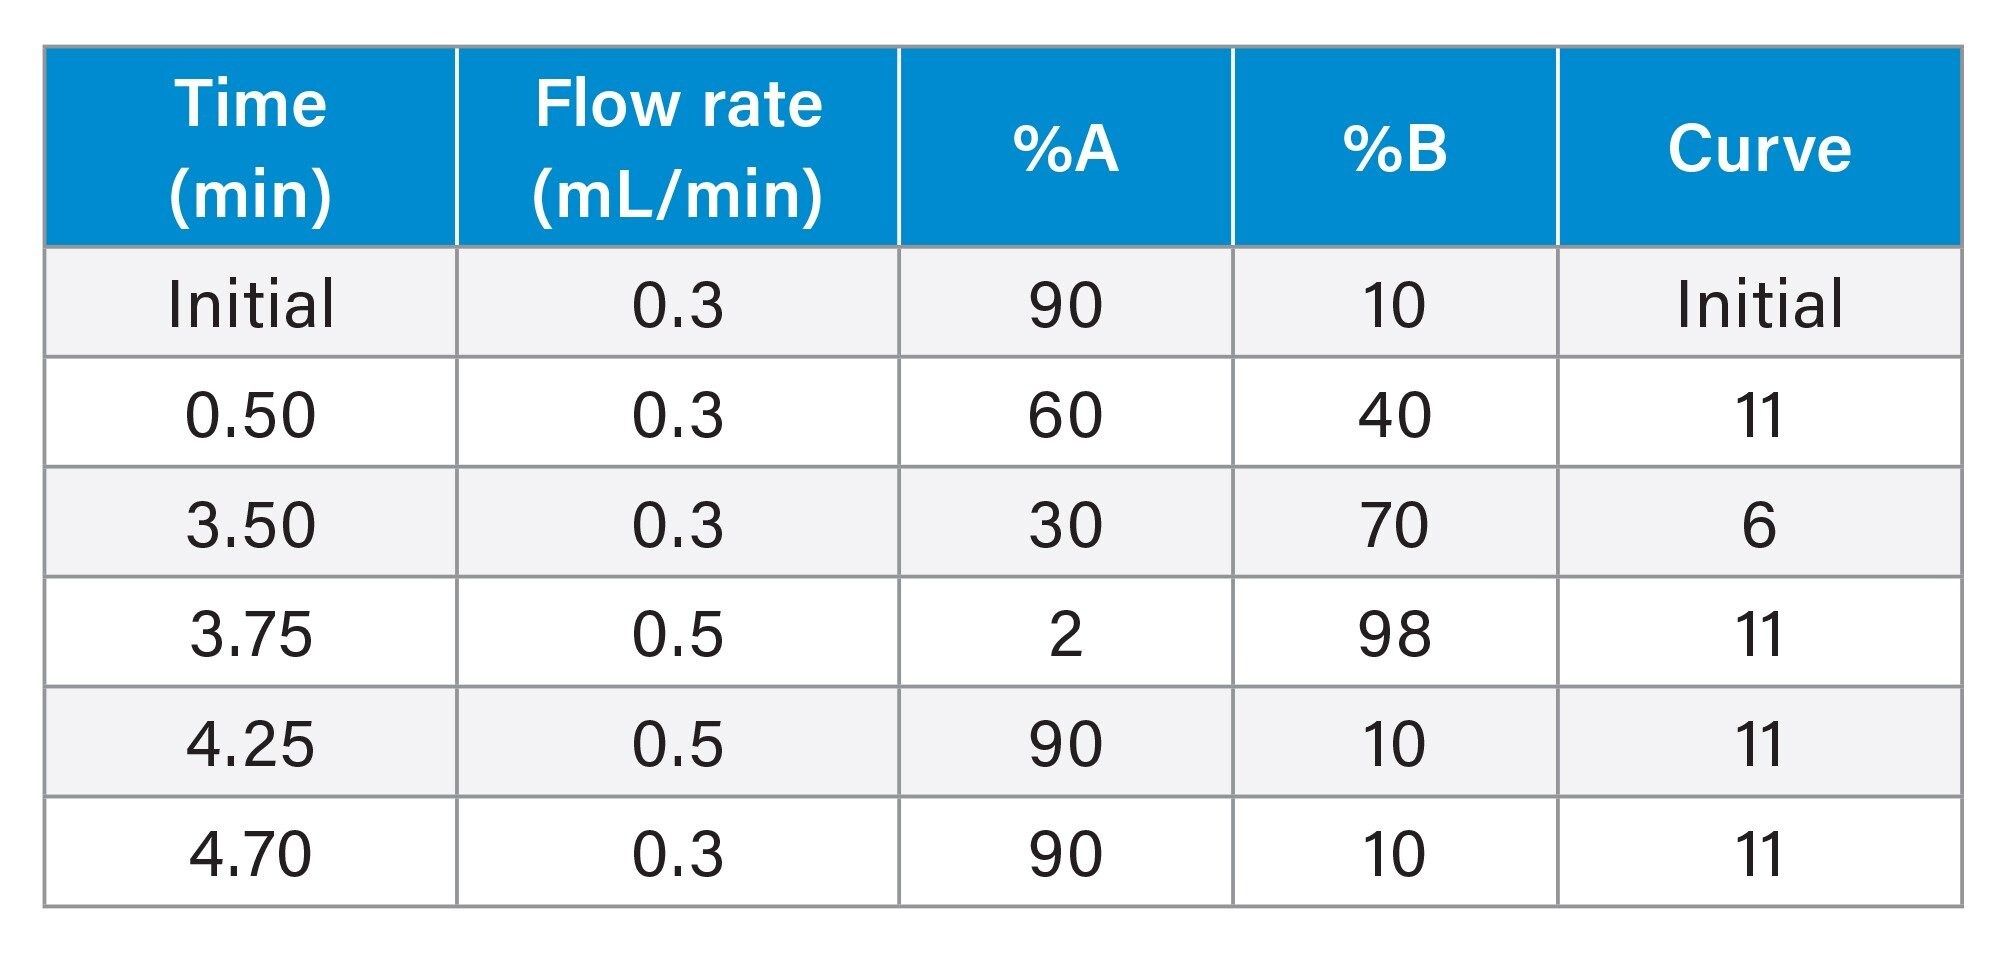
Samples were subsequently injected onto an ACQUITY UPLC I-Class FL System and Xevo TQ Absolute IVD Mass Spectrometer, utilizing a water/methanol/ammonium fluoride gradient and a Waters™ CORTECS™ Phenyl Column (Waters p/n: 186008319) as shown in Table 1.
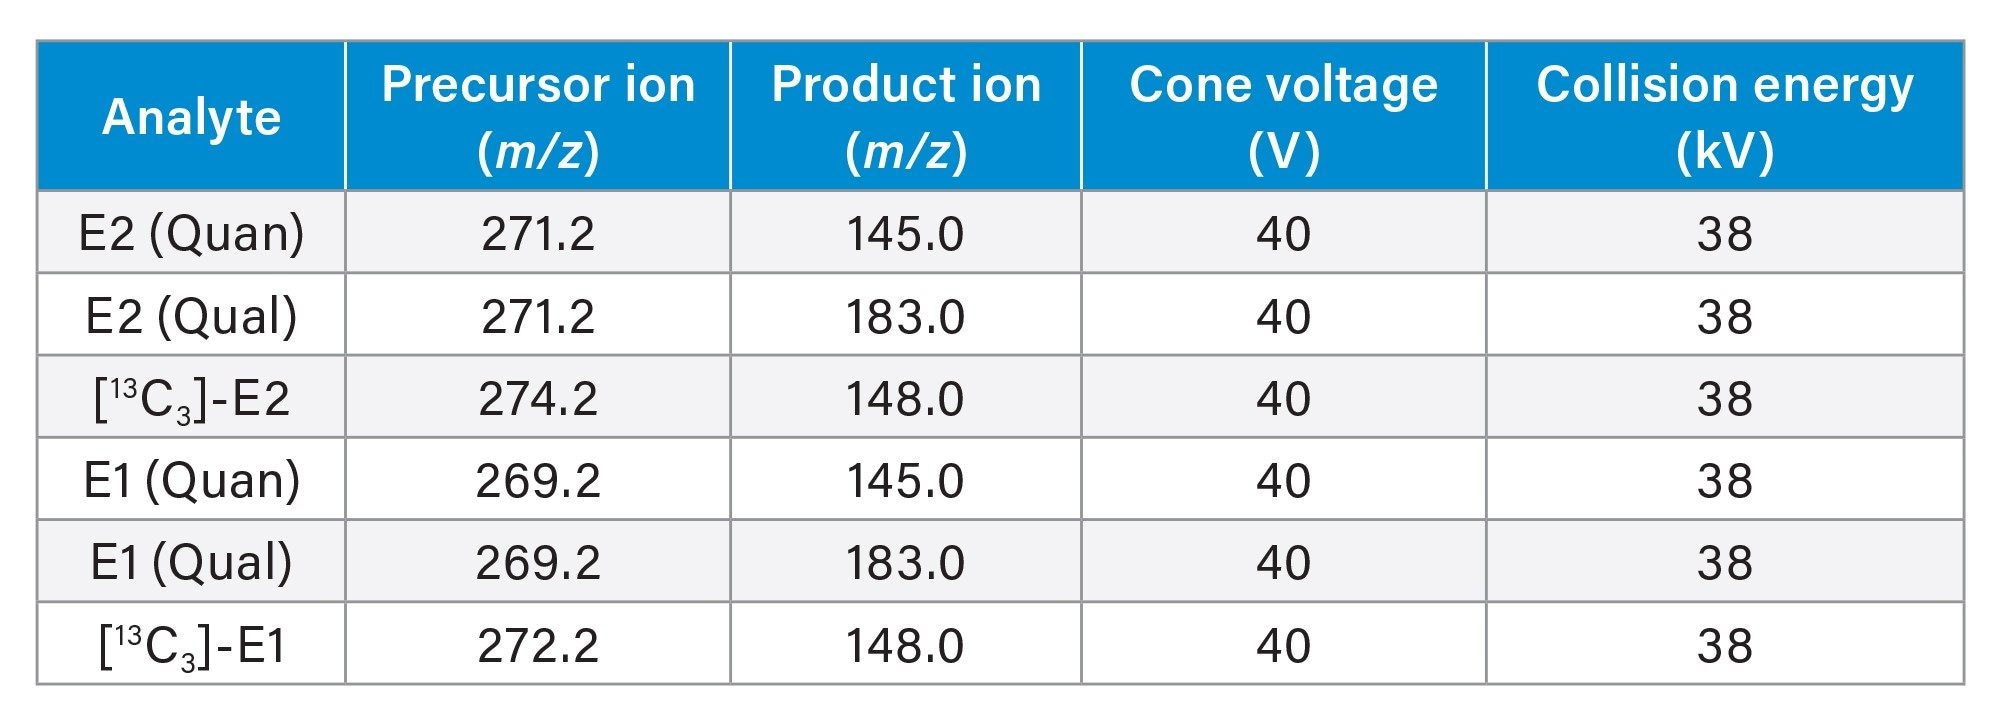
Multiple Reaction Monitoring (MRM) transitions, quantifier (quan) and qualifier (qual), for the detection of all analytes are shown in Table 2, having a capillary voltage of 2.2 kV in electrospray negative ionization mode, with resolution settings at 0.7 FWHM for MS1 and MS2.
Results and Discussion
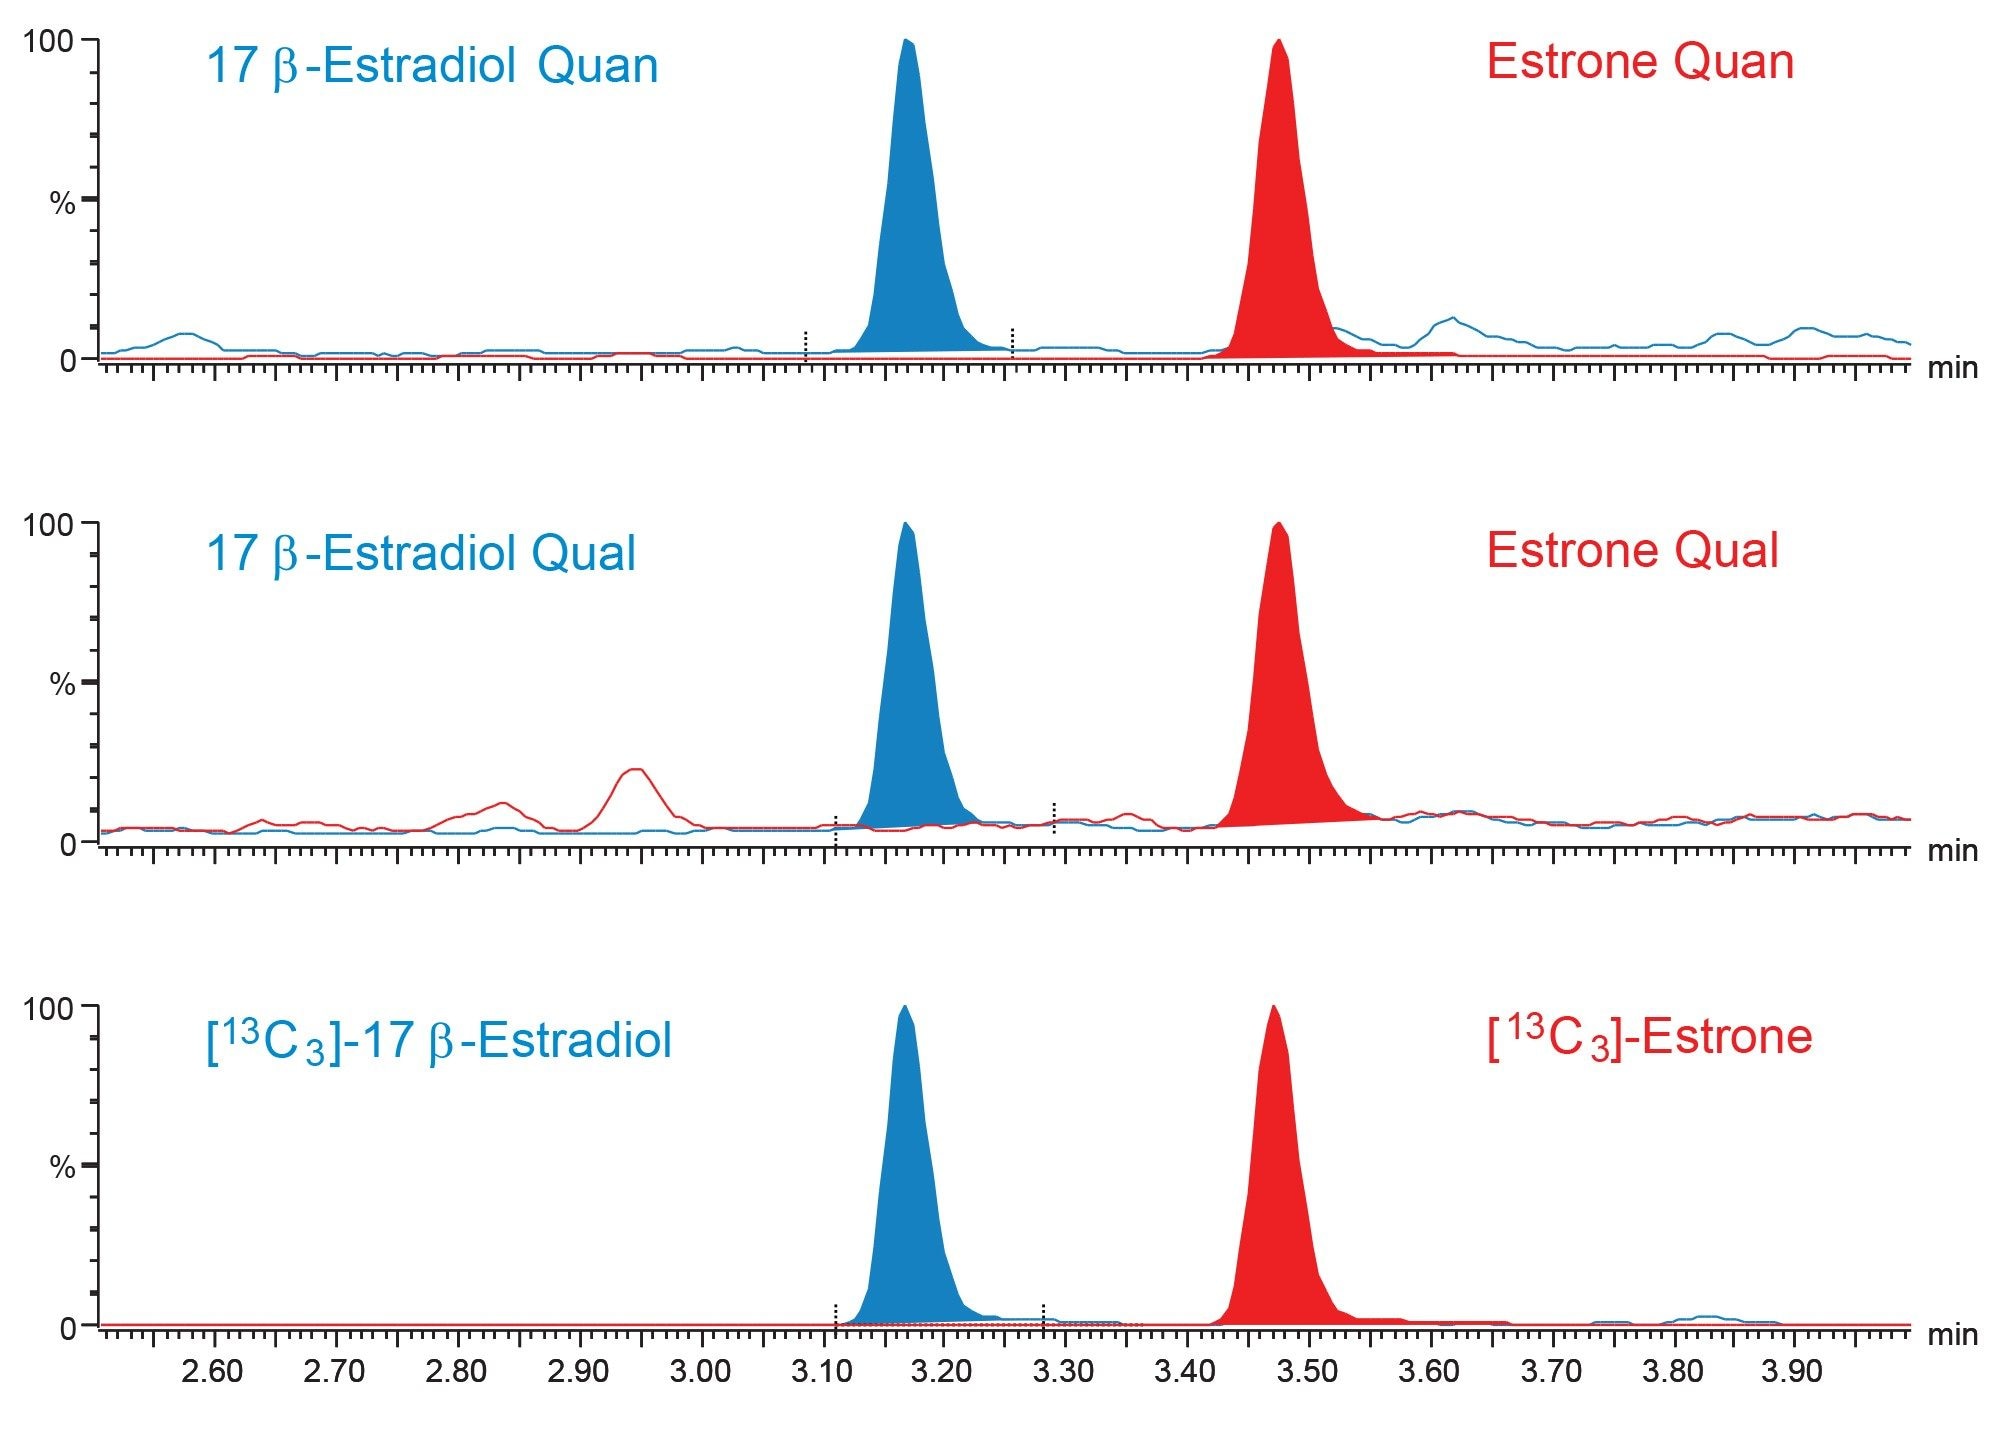
Chromatographic separation was achieved for E2 and E1, having an injection-to-injection time of approximately 5.5 minutes. A typical chromatogram is shown in Figure 2.
Calibration curves were shown to be linear over the calibration ranges described, having correlation coefficients of >0.99 and %bias of within ±15% (±20% for Calibrator 1) for E2 and E1 across 8 occasions.
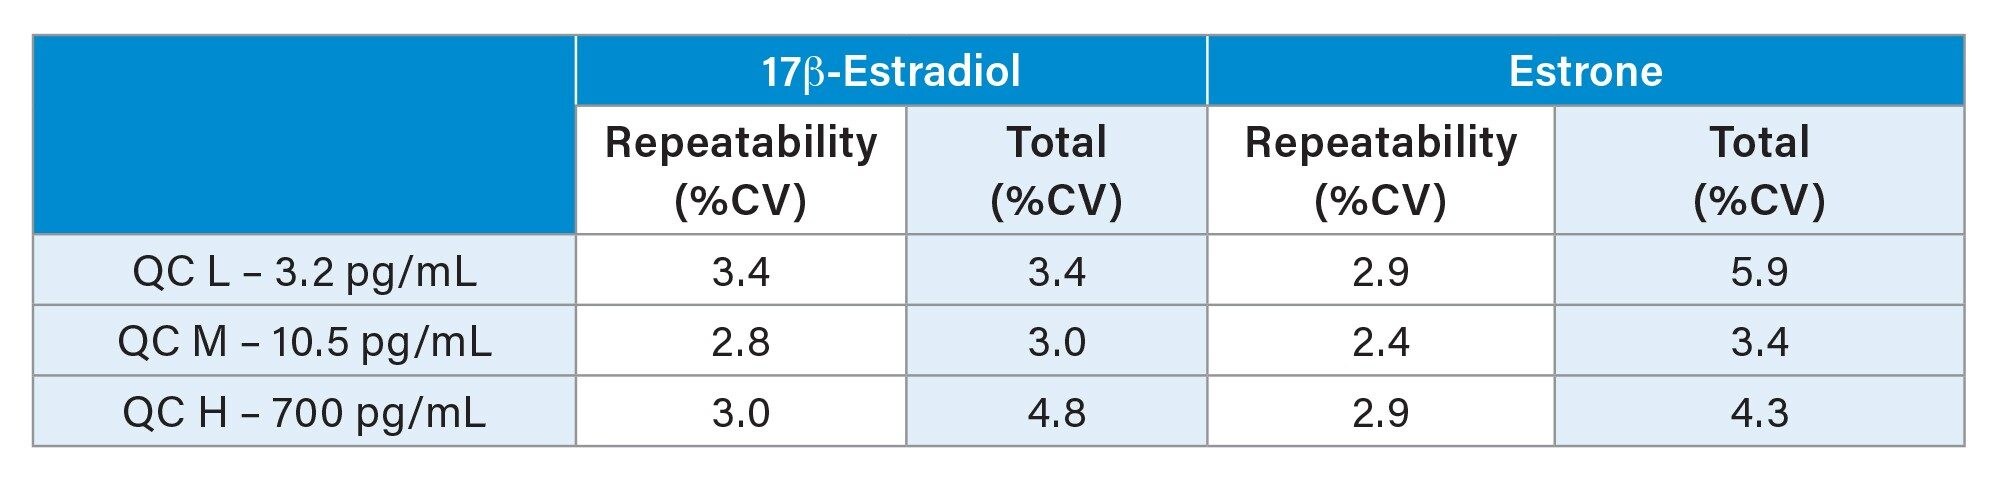
Precision performance was assessed by extracting and analyzing five replicates of the low, mid, and high QC samples on each of five occasions. Within-run and total precision were ≤5.9% CV for all steroid hormones for all concentration levels and is summarized in Table 3.
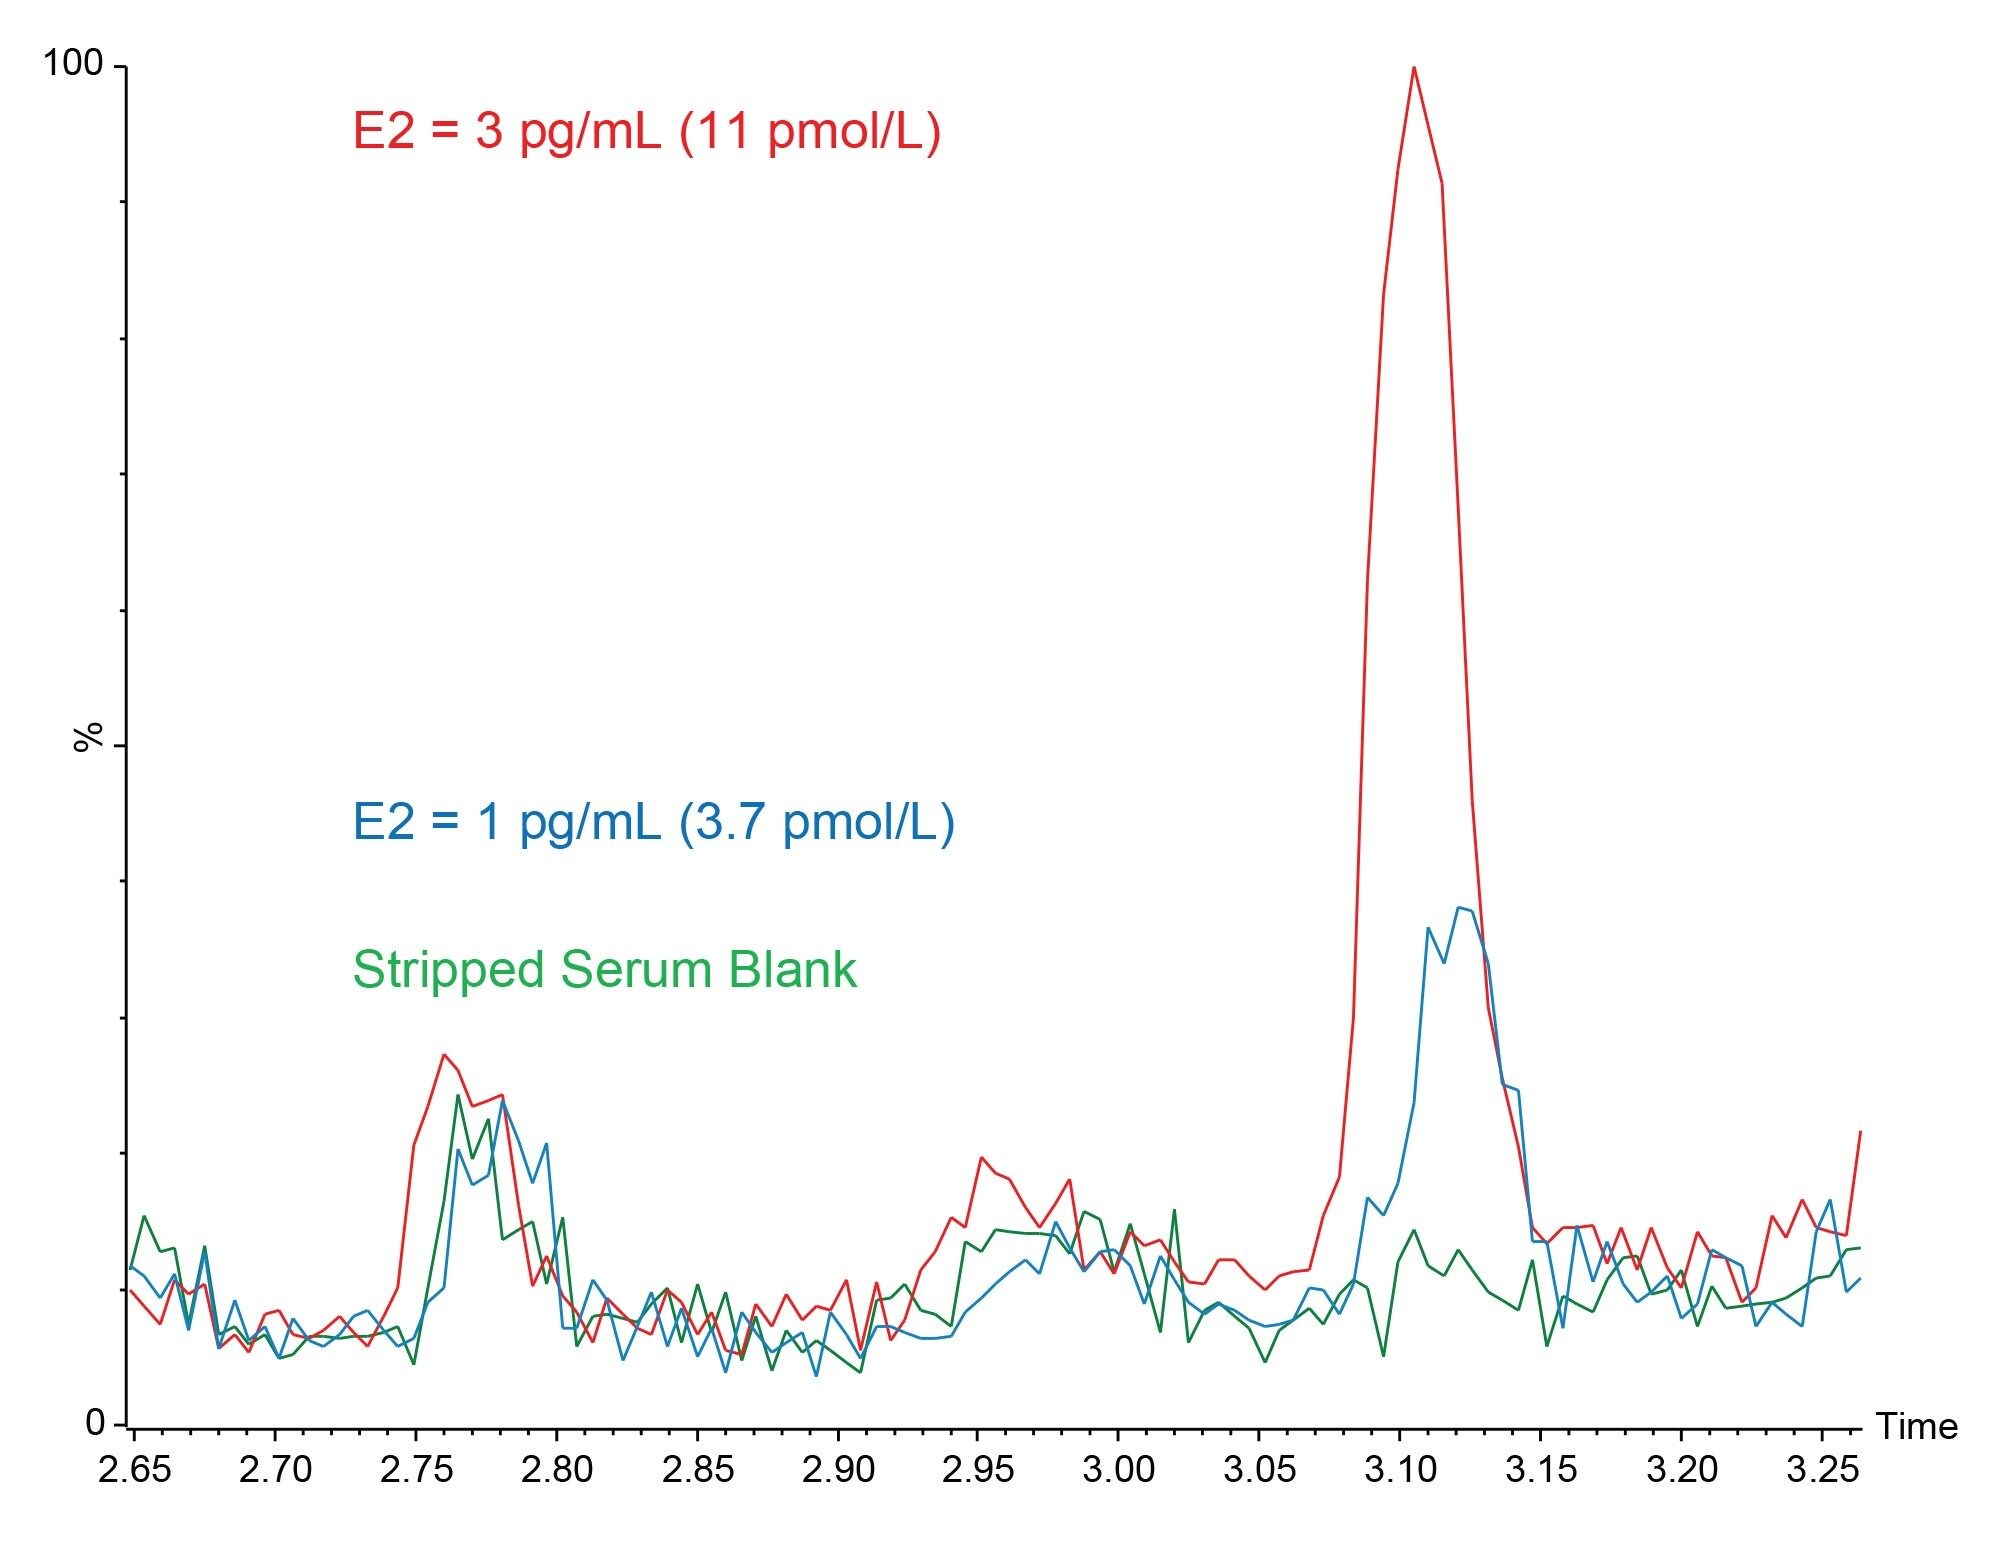
Analytical Sensitivity was assessed by spiking Golden West Biologicals MSG4000 stripped serum at low concentration levels. Ten replicates of each sample were then extracted and analyzed on each of four occasions. %CVs of ≤20% and biases of ≤15% were obtained at 1.0 pg/mL for E2 and E1, however, a signal to noise ratio (peak to peak) of ≥10:1 was not achieved at this level for E2, therefore an LLoQ of 3 pg/mL was selected for this analyte. Figure 3 shows typical chromatograms of E2 and E1 at these concentrations. While an LLoQ of 1 pg/mL was not achieved, a blank stripped serum sample can be differentiated from the same serum spiked at 1 pg/mL of E2.
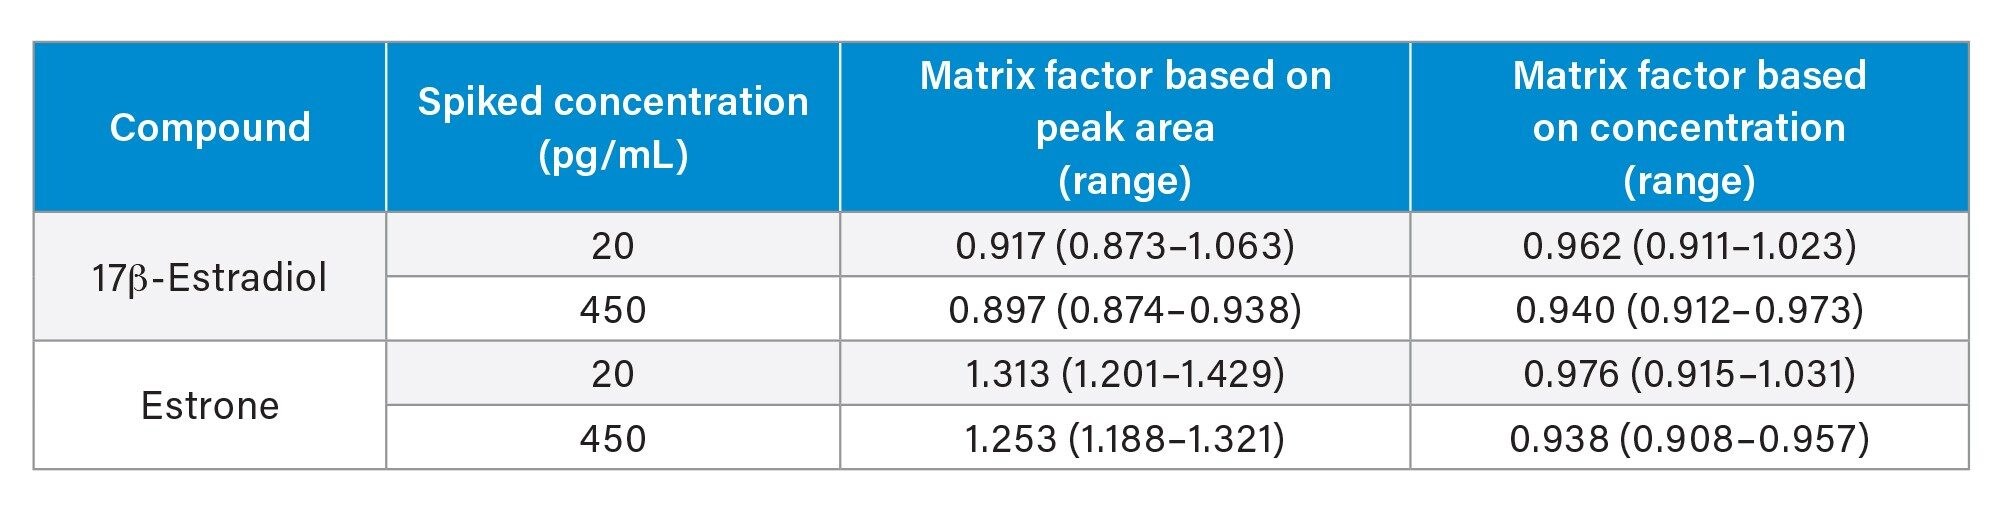
Matrix effect investigations were performed using serum from six individuals. The endogenous peak areas were separately quantified and post-spiked samples at low and high concentration levels were adjusted using the mean peak areas to enable comparison to solvent spiked samples. While some suppression and enhancement in the matrix factor results was observed when looking at the peak areas, these were compensated for by the internal standard (Table 4).
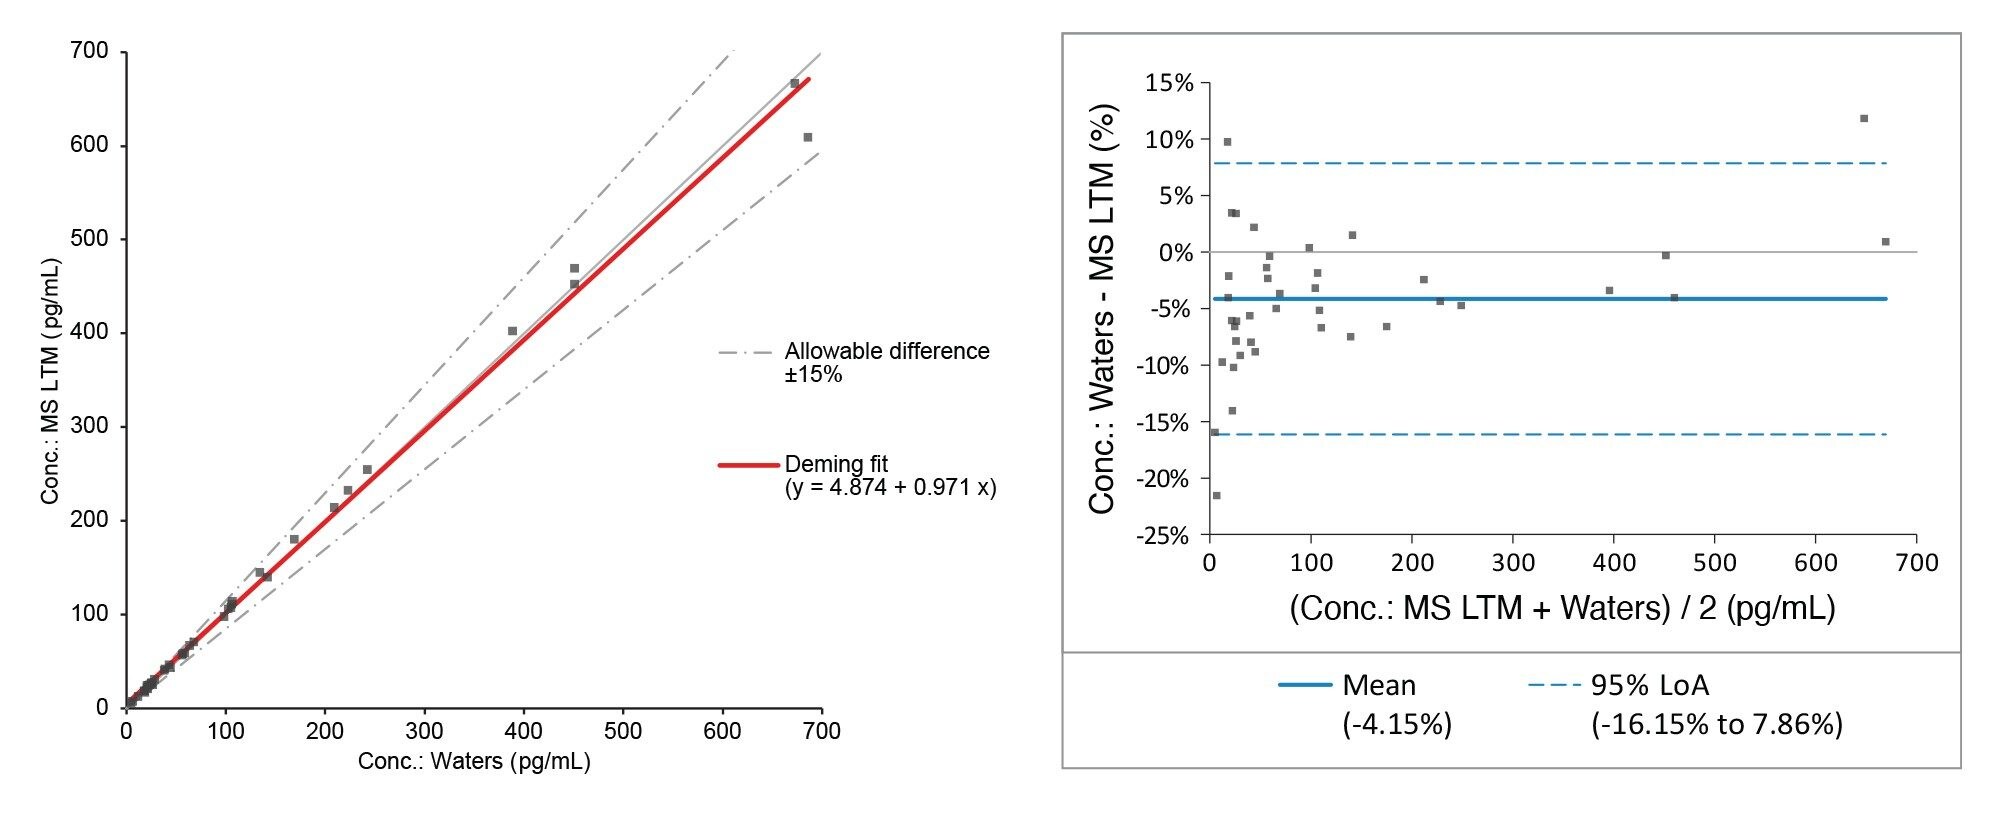
Accuracy was assessed by analyzing 40 UK NEQAS E2 samples with calculated concentrations compared to the mass spectrometry laboratory trimmed means. The correlation for E2 can be seen in Table 5 and Figure 4, showing excellent agreement with the EQA scheme.

Conclusion
The Xevo TQ Absolute IVD has demonstrated excellent analytical sensitivity and quantitative performance for the analysis of 17 β-estradiol and estrone for clinical research, having the following method performance characteristics:
- Calibration curves had correlation coefficients (r2) of >0.99 for E2 and E1 for all runs
- Within-run and total precision results of ≤5.9% CV
- Analytical sensitivity concentrations of 3.0 pg/mL (11.1 pmol/L) for E2 and 1.0 pg/mL (3.7 pmol/L) for E1 were achieved, having a %CV of ≤20%, bias of ≤15% and S:N (ptp) of >10:1. Furthermore, a blank stripped serum sample was able to be distinguished from the same matrix sample spiked with 1 pg/mL of E2 from only 250 µL of sample, without the need for derivatization
- Little to no ion suppression was observed from six individuals when comparing calculated concentrations to control samples
- The method was shown to be accurate when compared to the UK NEQAS E2 scheme, having a Deming Fit of y = 0.971x + 4.874 and a Bland Alman Mean Bias of -4.15%
References
720007940, July 2023