• Nota de aplicación

Using UPLC-MS/MS for Workplace Drug Testing

Using UPLC-MS/MS for Workplace Drug Testing

  • Robert Lee
  • Simone Donzelli
  • Giulia Riccardino
  • Luca Salvaderi
  • Michela De Francheschi
  • Michelle Wood
  • Waters Corporation
  • CEDAM Italia and Bianalisi Analisi Mediche

For forensic toxicology use only.

This is an Application Brief and does not contain a detailed Experimental section.

Abstract

The aim of this application brief is to develop a UPLC-MS/MS method for the analysis of 21 substances, commonly measured in workplace drug testing (WPDT) schemes, using a simple dilution of the urine prior to analysis.

Benefits

A simple sensitive UPLC-MS/MS method for substances commonly measured in workplace drug testing schemes.

Introduction

In recent years WPDT laws have been implemented in certain geographies for workers employed in specific industry sectors, particularly those in safety-critical job roles such as transportation (pilots, train/ bus drivers), nuclear–safety employees and construction. Random drug testing in the workplace is aimed, not only at reducing costs in terms of lost productivity and absenteeism, but also at ensuring safety for the individual and the wider community1.

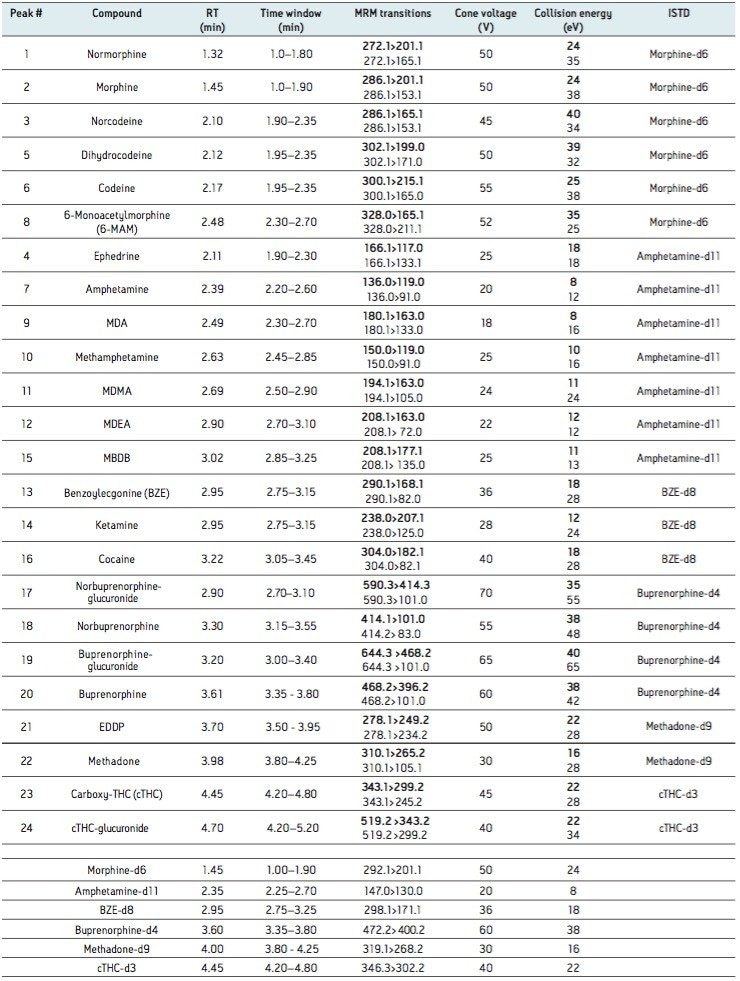
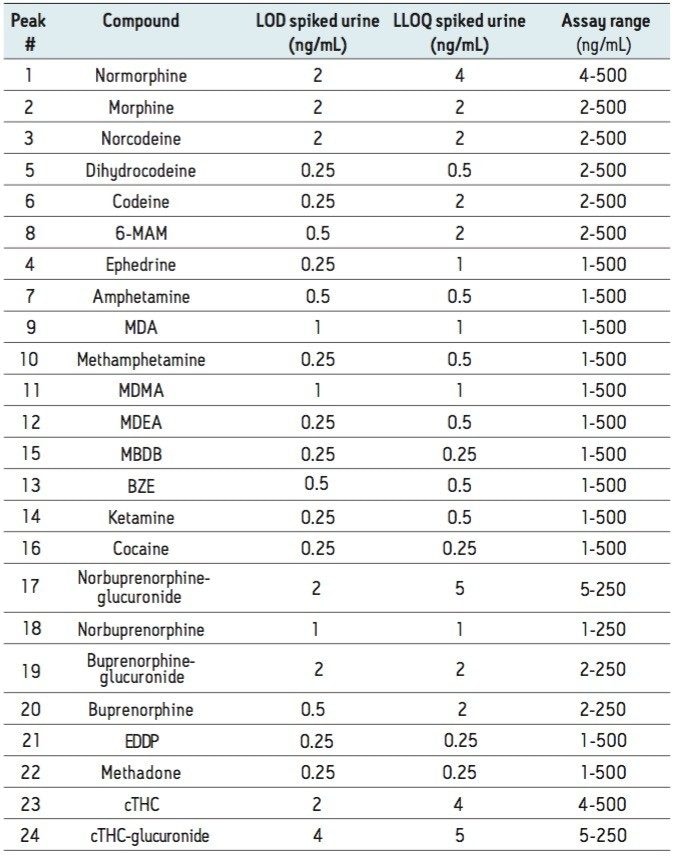
After prior notification workers provide a urine sample which is commonly screened for a variety of drugs including; opiates, methadone, buprenorphine, cocaine, amphetamines, and cannabinoids by a technique such as immunoassay. Any samples containing analytes above a pre-defined cut-off level (putative positives) are then confirmed by a different technique, often GC-MS or LC-MS/MS.

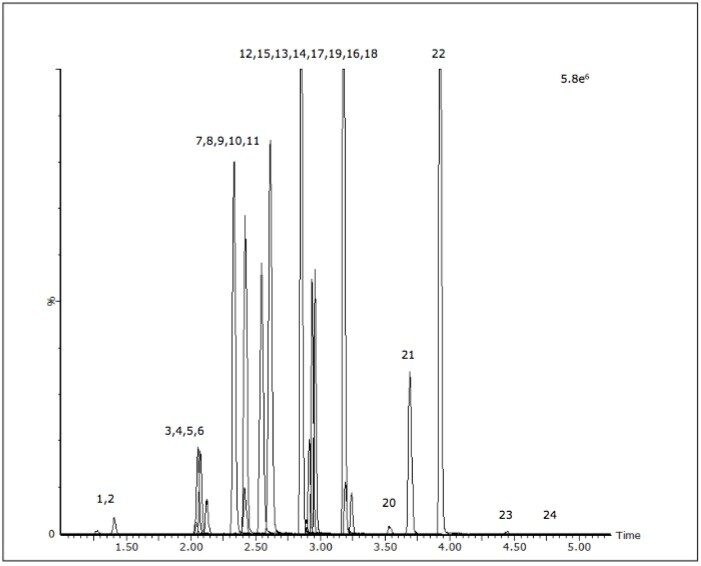
For some analytes immunoassay is not sufficiently specific and can only indicate the presence of a certain class of compounds rather than pinpoint the actual compound present. In contrast, the use of UPLC-MS/MS for screening can provide a specific, semi-quantitative tool for determining the samples that are positive and improves overall efficiency of the testing process by reducing the number of false positives sent for confirmation.

Experimental

Sample preparation

Internal standard (ISTD) mixture (0.05 mL) was added to 0.2 mL urine (either sample or calibrator), which was then vortex-mixed for 5 min at 1200 rpm then centrifuged at 8000 g for 10 min. Supernatant (0.125 mL) was added to 0.375 mL deionized water in a Waters Maximum Recovery Vial. Assay concentration of ISTDs was 25 ng/mL.

Chromatography conditions

Column:

ACQUITY UPLC BEH C18, 1.7 μm, 2.1 x 100 mm with BEH C18 1.7 μm VanGuard

Column temp.:

40 °C

Sample temp.:

10 °C

Injection volume:

8 μL

Wash solvent:

95% acetonitrile/5% water

Purge solvent:

0.1% formic acid

Flow rate:

400 μL/min

Mobile phase A:

0.1% formic acid

Mobile phase B:

acetonitrile

Gradient

Mass Spectrometry conditions

MS system:

Xevo TQD

Ionization mode:

ESI with polarity switching

Capillary voltage:

1.0 kV positive,

2.95 kV negative

Source temp.:

150°C

Desolvation temp.:

500°C

Desolvation gas:

800 L/Hr

Cone gas:

20 L/Hr

Multiple reaction monitoring conditions

The quantifier transitions are in bold-type.

Results and Discussion

Combining the ACQUITY UPLC I-Class System with the Xevo TQD allows these compounds to be detected at levels lower than the currently applied cut-offs and permits a compound specific semi-quantitative determination of the relevant analytes.

The acceptance criteria for a positive identification of analytes were the retention time to be within 0.1 min of predicted and the quantifier/qualifier ion ratio to be within 20% of the predicted ratio, which was based on the average of the ratios across the entire calibrator range. Figure 1 shows a chromatogram of a urine calibrator spiked at 25 ng/mL.

Figure 1. Chromatogram of a urine calibrator spiked at 25 ng/mL. Peak assignments are listed in Table 1.

To investigate linearity for all analytes, spiked urine calibrators were prepared from 1 ng/mL to 500 ng/mL, except for norbuprenorphine, buprenorphine, their respective glucuronides and cTHC-glucuronide which were from 1 to 250 ng/mL; calibrators were prepared and analysed over five consecutive days.

Peak areas for each MRM trace were generated using the TargetLynx Application Manager and referenced to the appropriate ISTD peak area. Semi quantitative calibration curves were plotted using a 1/x weighting. A quadratic fit was applied to all analytes except the following where a linear fit was applied; normorphine, morphine, norcodeine, cocaine, buprenorphine, EDDP, and methadone. Interday correlation coefficient or coefficient of determination (assessed over five days) was >0.995 for each analyte.

The limit of detection (LOD) was defined as the lowest concentration which gave a signal-to-noise ratio >10:1 (for both transitions) in spiked urine. The lower limit of quantitation (LLOQ) was defined as the lowest concentration which gave a signal to noise ratio >10:1 (for both transitions) and ion ratios within 20% of expected and a %RSD <20% in spiked urine. The LOD and LLOQ for each analyte are summarized in Table 1 along with the assay calibration range.

Table 1. Calibration range, LODs, and LLOQs (ng/mL) based on the urine dilution protocol.

Matrix effects were investigated at the following concentrations: 10 ng/mL (low), 50 ng/mL (medium) and 250 ng/mL (high), except for norbuprenorphine, buprenorphine, their respective glucuronides and cTHC-glucuronide which were determined at 5 ng/mL (low), 25 ng/mL (medium) and 125 ng/mL (high). The results showed the matrix effect to be less than 20% for the majority of analytes.

Interday accuracy and precision were assessed by analysing three quality control (QC) concentrations (15, 150 and 300 ng/mL, except for norbuprenorphine, buprenorphine, their respective  glucuronides and cTHC-glucuronide which were determined at 7.5, 75, and 150 ng/mL) over five different days. The mean achieved values for the quality control replicates over the five day period at the three concentration levels were within 15% of target and the % RSD was <15%. 

Analysis of authentic urine samples

Two commercial quality control reference urines and 114 authentic urine samples were analyzed using the described UPLC-MS/MS method.

The method detected and correctly assigned the analytes in both commercial reference urines. The semiquantitative results obtained using this UPLC-MS/MS method for the analysis of the Bio-Rad Liquichek level C2 reference urine were in accordance with the manufactured stated reference values (Figures 2 and 3).

Figure 2. Chromatogram of Bio-Rad Liquichek level C2 reference urine (peaks are scaled to maximum response). Peak assignments are listed in Table 1.
Figure 3. Comparison between the semi quantitative UPLC-MS/MS analysis of Bio-Rad Liquichek level C2 reference urine and GC analysis.

The authentic samples comprised anonymised samples that had previously been screened using either the Beckman Olympus AU400 or the Abbott Architect 4000 immunoassay system. Any sample that had screened positive by either immunoassay technique had been sent for subsequent confirmation by GC-MS. Eleven of these samples gave putative positives for buprenorphine, methadone, amphetamines and cTHC, but were not confirmed by the subsequent GC-MS assays; all of these samples were negative by the UPLC-MS/MS based screen. Sixty samples were shown to contain at least one and, in some instances, multiple analytes; this was in agreement with the GC-MS confirmation data. Some additional analytes were found that had not been confirmed by the various GC-MS assays as their concentration was below the applied immunoassay cut-offs (opiates 300 ng/mL, amphetamines 500 ng/mL, BZE 300 ng/mL, methadone 500 ng/mL, buprenorphine 5 ng/mL and cannabinoids 50 ng/mL). Figure 4 shows the chromatogram of a sample that screened positive for cTHC yet negative for BZE. In this sample set BZE was the most commonly detected analyte by this UPLC-MS/MS method and was detected in 25 of the 114 samples.

Figure 4. Chromatogram of a sample that screened positive for cTHC yet negative for BZE by immunoassay but by UPLC-MS/MS was shown to contain BZE at 50 ng/mL (lower than the 300 ng/mL cut-off). A negative sample is shown for comparison (upper traces). The traces show the quantifier ions for  both analytes only (ISTDs not shown).

Conclusion

The rise of workplace drug testing has highlighted the need for a quick, accurate, reliable and robust method to initially screen the large number of samples. The developed approach meets these requirements and demonstrates excellent correlation with GC-MS methods.

The use of the ACQUITY UPLC I-Class system allows for a quick and robust analytical method that can detect all the analytes in a single run, with an injection to injection time of 7 min combined with the simple sample dilution used allows for high sample throughput. Furthermore the superior sensitivity of the Xevo TQD permits detection of the analytes from a simple dilution of the sample at levels lower than the currently applied cut-offs and minimizes false positives.

References

  1. Kazanga I et al. Prevalence of drug abuse among workers: Strengths and pitfalls of the recent Italian workplace Drug Testing (WPDT) legislation. Forensic Science International. 2012; 215 (1-3): 46–50.

Acknowledgements

CEDAM Italia, Bresso, Italy and Bianalisi Analisi Mediche, Carate Brianza, Italy for supplying the anonymised authentic urine samples.

720005032, June 2014

Volver arriba Volver arriba