• Nota de aplicación

Xevo G2 QTof: The Flexibility to Treat Large Peptides Like Normal Peptides within an LC-MS Peptide Mapping Experiment

Xevo G2 QTof: The Flexibility to Treat Large Peptides Like Normal Peptides within an LC-MS Peptide Mapping Experiment

  • Scott J. Berger
  • Asish B. Chakraborty
  • StJohn Skilton
  • Hilary J. Major
  • Weibin Chen
  • Waters Corporation

This is an Application Brief and does not contain a detailed Experimental section.

Abstract

If larger peptides can be processed algorithmically like smaller peptides, common data treatment can be applied across peptide mapping data sets, and generate results with uniform standards of component identification and quantification. This uniformity of data processing also facilitates automation of LC-MS data analysis in MassLynx Application Managers such as BiopharmaLynx, which searches peptide mapping data using monoisotopic mass information, and requires at least partial resolution of a peptide’s isotopic structure for proper component detection.

Benefits

The second-generation Xevo G2 QTof is fundamentally designed to extend routine analysis to peptide maps containing peptides of a large mass range.

Introduction

The question of when a large peptide is large enough to be considered a small protein is not just philosophical when such peptides are encountered within an LC-MS peptide map. The utility of identifying typical protein digest components by the mass of their 12C (or monoisotopic peak) decreases as the peptide gets larger. At some point, either instrument or physical limitations are encountered, and it becomes more practical to use average peptide mass as an identifier for that peptide. This can complicate data analysis for peptide maps containing digests with wide variations in peptide mass.

If larger peptides can be processed algorithmically like smaller peptides, common data treatment can be applied across peptide mapping data sets, and generate results with uniform standards of component identification and quantification. This uniformity of data processing also facilitates automation of LC-MS data analysis in MassLynx Application Managers such as BiopharmaLynx, which searches peptide mapping data using monoisotopic mass information, and requires at least partial resolution of a peptide’s isotopic structure for proper component detection.

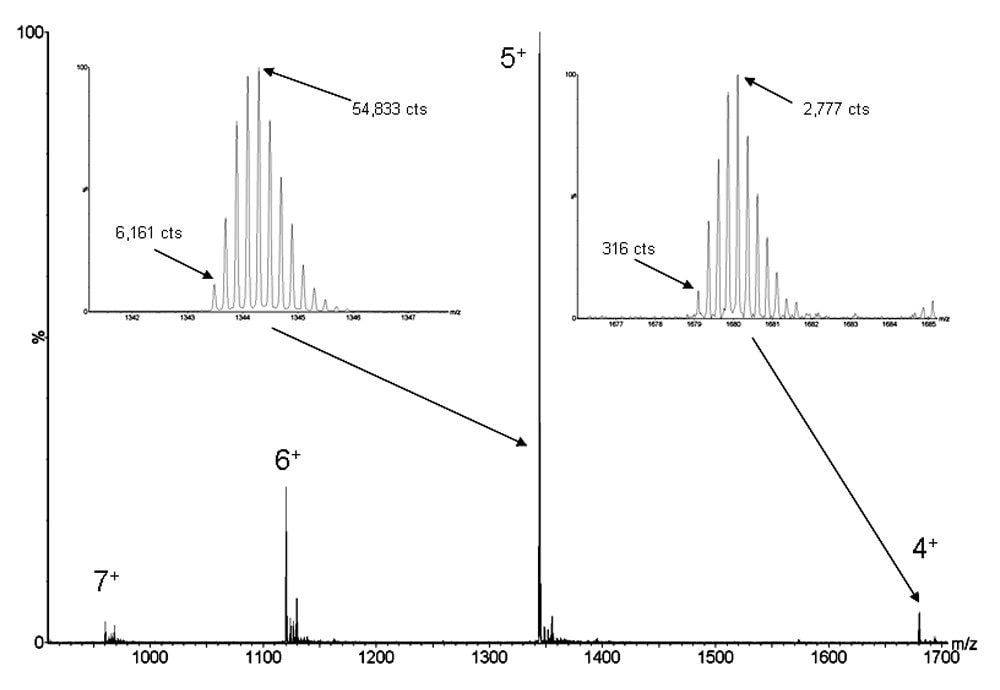
It is a fundamental misconception that mass resolution is the only limiting factor for directly obtaining monoisotopic peptide mass results. While sufficient MS resolution is required to detect isotopic features, this capability concurrently requires sufficient dynamic range to detect the monoisotopic peak for the most intense and least intense charge states of that large peptide. This combined resolution and dynamic range challenge grows more acute as peptide size is increased. In particular, three effects dominate:

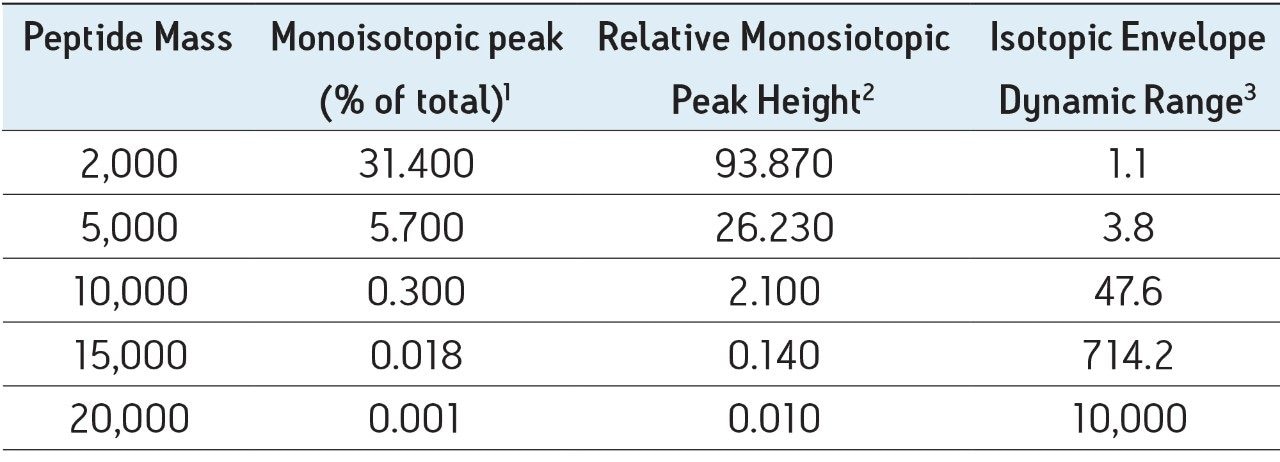
  • The relative abundance of the monoisotopic peak rapidly decreases with increasing peptide mass (see Table 1) 
  • The dominant charge state(s) (and required MS resolution to detect isotopicfeatures) increases with increasing peptide mass
  • The number of charge states (and dynamic range needed to detect them) increases with increasing peptide mass

The second-generation Xevo G2 QTof is fundamentally designed to address both aspects of the large peptide detection challenge. Instrument resolution, now routinely greater than 20,000, can clearly resolve isotopic structure for peptides below 10,000 MW, and permits automated processing of higher intensity data for peptides approaching 15,000 MW. In this secondary mass range, the challenge of dynamic range becomes limiting as the monoisotopic peak decreases from ~1/50th to ~1/700th the relative height of the most abundant isotope in the isotopic envelope for each detected charge state. The QuanTof  hybrid ADC technology (enabling greater than 10,000 spectral dynamic range) introduced with the Xevo G2 QTof facilitates superior detection, mass accuracy, and quantitation for lesser abundance charge states than was possible using previous conventional ADC or TDC mass detection technologies.

Results and Discussion

It is the combination of increased MS resolution coupled with the novel hybrid ADC mass detection technology that enables routine LC-MS peptide mapping analysis of digests containing higher MW peptides. This capability enables biotherapeutic characterization studies using enzymes with more limited digest specificities than trypsin (e.g., ArgC, AspN, LysC), intentional under-digestion of proteins (more missed cleavages ~ better coverage of smaller or poorly ionizing digested peptides), and analysis of non-reduced peptide maps (for purposes of disulfide mapping). The extensive bioinformatics capabilities of BiopharmaLynx for automating processing and reporting of such data sets further increases the efficiency and uniformity for processing these more exotic peptide mapping workflows.

The largest peptide encountered in most antibody tryptic peptide maps is the T15 peptide that is derived from the constant region of the antibody heavy chain (DYFPEPVTVSWNSGALTSGVHTFPAVLQSSGLYSLSSVVTVPSSSLG TQTYICNVNHKPSNTK). In most peptide maps, it is detected in a modified form (containing achemically alkylated cysteine), as one of the later eluting peaks, and a resulting monoisotpic mass of 6712.3071 Da. Figure 1 shows the summed spectrum for the HC T15 peptide from the LC-MS peptide map of a commercialized biotherapeutic monoclonal antibody. These data were acquired on a Xevo G2 QTof operating in positive electrospray ionization mode with resolution mode detection settings.

Figure 1. Ratio of monoisotopic to most abundant isotopic peak is ~ 1:9 for both charge states.

In the positive electrospray ionization mode, the peptide is detected in multiple charge states (4+ to 7+). The isotopic distributions for the most intense 5+ charge state and a minor 4+ charge state are depicted in an expanded form (Figure 1, left and right inset spectra, respectively). Although the dominant charge state is ~20-fold more intense than the minor charge state (relative peak heights), consistent isotopic resolution and isotopic envelope character are maintained when comparing the two spectra. The quantitative consistency within each isotopic distribution can be simply demonstrated using the ratio of most intense isoptopic peak to monoisotopic peak height. These consistent values, 8.9 (5+) and 8.8 (4+), are expected for beam instruments such as a QTof, but are not seen with ion trap based instruments, where large peptide ion populations are biased by the Automatic Gain Control (or AGC) functionality used to control space charge effects. This quantitative isotopic fidelity across dynamic range permits the quality of an isotopic distribution to be used in addition to the raw accurate mass information during processing of peptide mapping data.

The larger issues of dynamic range can be explored by first noting that the peak height for the 4+ monoisopic peak is ~175-fold less intense than the most abundant isotope of the 5+ peak. Furthermore, the baseline noise level in the 4+ spectrum indirectly demonstrates that the peptide itself does not ionize particularly well compared to others in the map. In fact, the best ionizing peptide in the map had an instrument response ~8-fold higher than this T15 peptide. So even in this relatively simple case of a 6700 MW peptide that ionizes reasonably well, detection of isotopic features over a dynamic range greater than 1400 was required for effective identification and quantitation of the unmodified HC T15 peptide.

Table 1. The relative abundance of the monoisotopic peak rapidly decreases with increasing peptide mass.

1 Percentage of peak area for the monoisotopic peak relative to the entire isotopic envelope of a given charge state.

2 Relative peak height of monoisotopic peak to most abundant isotopic peak in the isotopic envelope for a given charge state.

3 Ratio of peak heights for monoisotopic peak to most abundant isotopic peak in the isotopic envelope for a given charge state.

Conclusion

The detection of poorer ionizing peptides, and lower level modified variants of the T15 peptide demonstrate the true dynamic range challenges encountered during routine LC-MS analysis of digests containing larger peptides. While this typical antibody peptide mapping example is shown to be well within the capabilities of the Xevo G2 QTof, the data contained within Table 1 clearly show the utility and necessity of this latest generation Xevo instrument for extending routine analysis to peptide maps containing peptides of even greater mass range.

Featured Products

720003531, May 2010

Volver arriba Volver arriba