• Application Note

Determination of Lasalocid and Tylosin at Therapeutically Relevant Levels in Animal Feed Using the ACQUITY UPLC H-Class System and ACQUITY QDa Mass Detector

Determination of Lasalocid and Tylosin at Therapeutically Relevant Levels in Animal Feed Using the ACQUITY UPLC H-Class System and ACQUITY QDa Mass Detector

  • Mohammed S. Ahmed
  • Jeff Bieszki
  • Jason S. Kong
  • Waters Corporation
  • Ohio Department of Agriculture

Abstract

U.S. feed regulatory laboratories are tasked with protecting against consumer fraud by ensuring “Truth in Labeling.” These laboratories utilize analytical methods distributed by AOAC INTERNATIONAL (Official Methods of Analysis) and other publications to perform analytical testing, especially in regards to permitted veterinary drugs supplemented into animal feed.

Traditional methods are challenged by newer feed formulations that may result in more complex matrices, which can lead to chromatographic peaks that cannot be easily integrated or separated from interfering matrices. However, typical feed testing does not necessarily require the level of sensitivity available with high-end MS systems.

In this collaborative application note with the Ohio Department of Agriculture, we demonstrate as a proof-of-concept a comparison of two veterinary drugs, lasalocid and tylosin, analyzed through a traditional HPLC-PDA and UPLC-MS (mass detection).

Benefits

  • Superb detection selectivity as compared to UV/Vis and fluorescence detection.
  • Allows simpler sample preparation protocols for complex matrices.
  • Reduced interference and noise from matrices for unambiguous identification and accurate quantification.
  • Easy to use, fit-for-purpose LC-MS system for feed testing laboratories.

Introduction

Feed regulatory laboratories are tasked with protecting against consumer fraud by ensuring “truth in labeling.” These laboratories utilize analytical methods distributed by AOAC INTERNATIONAL (Official Methods of Analysis)1 and other publications to perform analytical testing, especially in regards to permitted veterinary drugs supplemented into animal feed. Current official HPLC methods use different types of detectors or attachments such as PDA, FLD, RI, or post-column derivitization for testing individual types of compounds. There is no unified multi-analyte approach for the determination of veterinary drugs. Traditional methods are also challenged by newer feed formulations which may result in more complex matrices and leads to chromatographic peaks that cannot be easily integrated or separated from interfering matrices.

While mass spectrometry (MS) has been adopted in a variety of regulatory work to solve the above problems, the cost of a high-end complete MS system can be prohibitive to be widely equipped in many feed regulatory laboratories. Typical feed testing does not necessarily require the level of sensitivity that is offered by high-end MS systems, especially for label claim verification of levels required for a therapeutic effect. Furthermore, the difficulty of training employees simply makes the transition to MS detection an all-around challenge.

The ACQUITY QDa is a high quality mass detector that has been specifically designed for integration with a liquid chromatography (LC) system. The ACQUITY QDa has been built on familiar LC detector design principles: it fits neatly into an existing LC stack; it is pre-optimized with zero adjustments required and no special expertise is required to tune or operate. It automatically performs mass calibration verification and advanced health check monitoring at power up. ACQUITY QDa Detector is ready to operate around seven minutes after pressing the power button. It uses a pre-aligned electrospray source and has a mass range of 30 to 1250 m/z producing both Single Ion Recording (SIR) and full scan data at 10,000 AMU/sec. It is controlled by either MassLynx or Empower software. These design features have facilitated the adoption of MS detection in laboratories without the requirement of extensive training of employees.

The ACQUITY QDa Detector makes implementation of mass detection possible for any LC laboratory. The selectivity of mass detection allows for the unambiguous quantification of feed supplements at low levels, enabling simpler sample prep protocols from complex matrices.

In this application note, we demonstrate as a proof-of-concept a comparison of two veterinary drugs, lasalocid and tylosin, analyzed through a traditional HPLC-PDA and HPLC-FLD with Waters ACQUITY UPLC System and the ACQUITY QDa Mass Detector. Figure 1 shows the molecular structures of lasalocid and tylosin.

Figure 1. Molecular structures of (a) lasalocid (MW: 590.8 Dalton) and (b) tylosin (MW: 916.1 Dalton).

Experimental

Sample description

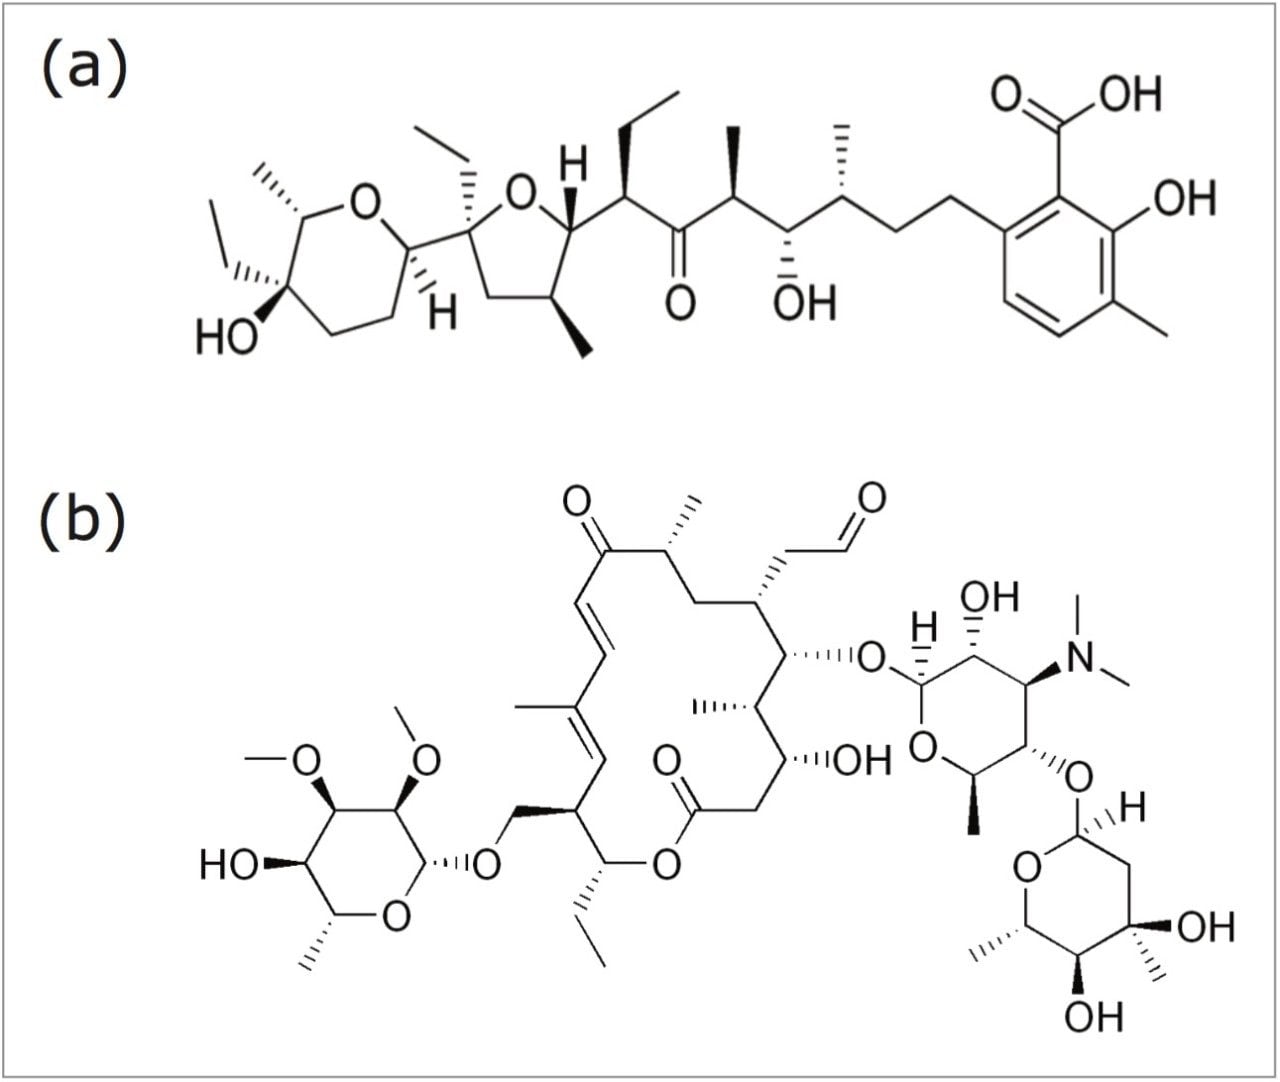
Lasalocid sodium was obtained from Alpharma Animal Health (Willow Island, WV). Tylosin standard was obtained from USP (Rockville, MD). The samples were from a variety of different feed base types (e.g. soy, corn, and non-grain based) and delivery forms (e.g. pellets, meal). Since there is no certified reference material available for these compounds in feed matrices, a sample that had previously tested within many different batches was used as a QC sample.

Preparation of standard solution

Stock solutions (600 μg/mL) of the individual antibiotics were prepared by measuring 30 mg of each analyte in 50-mL volumetric flasks and diluting to volume with the specified extraction solution (acidified methanol for lasalocid or phosphate buffer and methanol for tylosin. Intermediate standard solutions (60 μg/mL) were prepared by a ten-fold dilution of the stock solutions with the extraction solution. Working standard solutions were then prepared for each analyte by serial dilution. Lasalocid’s curve was prepared from 1.5 to 7.6 μg/mL. Tylosin’s curve was prepared from 3.1 to 30.7 μg/mL.

Lasalocid extraction

Extraction was adapted from AOAC OMA 2008.01.2 10 g of homogenized animal feed was combined with 100 mL acidified methanol (0.005% formic acid) in a 250-mL Erlenmeyer flask. The flask was sonicated for five minutes and shaken for 30 minutes in an orbital shaker. The solution was filtered through a 25-mm syringe filter discs with 0.45-μm nylon membrane filter and vialed for analysis.

Tylosin extraction

10 g of homogenized animal feed was combined with 100 mL of a 1:1 ratio of phosphate buffer (16.7 g K2HPO4, 0.5 g KH2PO4 diluted to 1 L with water), and methanol. Extraction procedure followed as above.

HPLC-FLD/PDA conditions

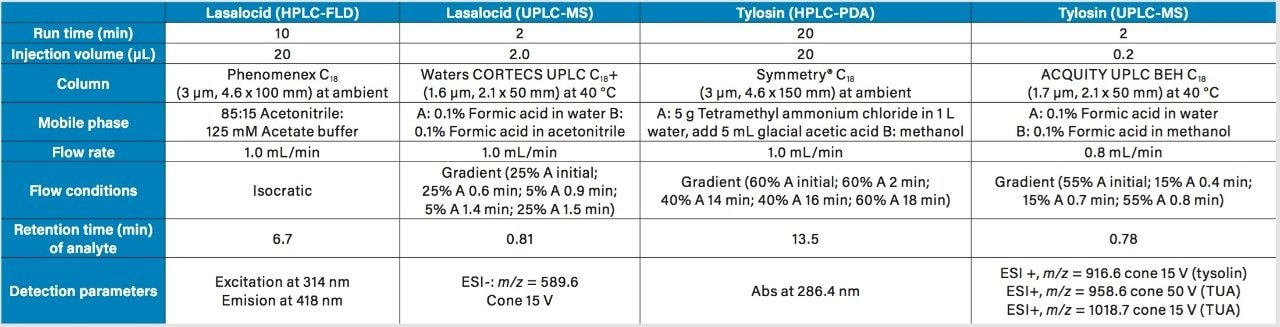
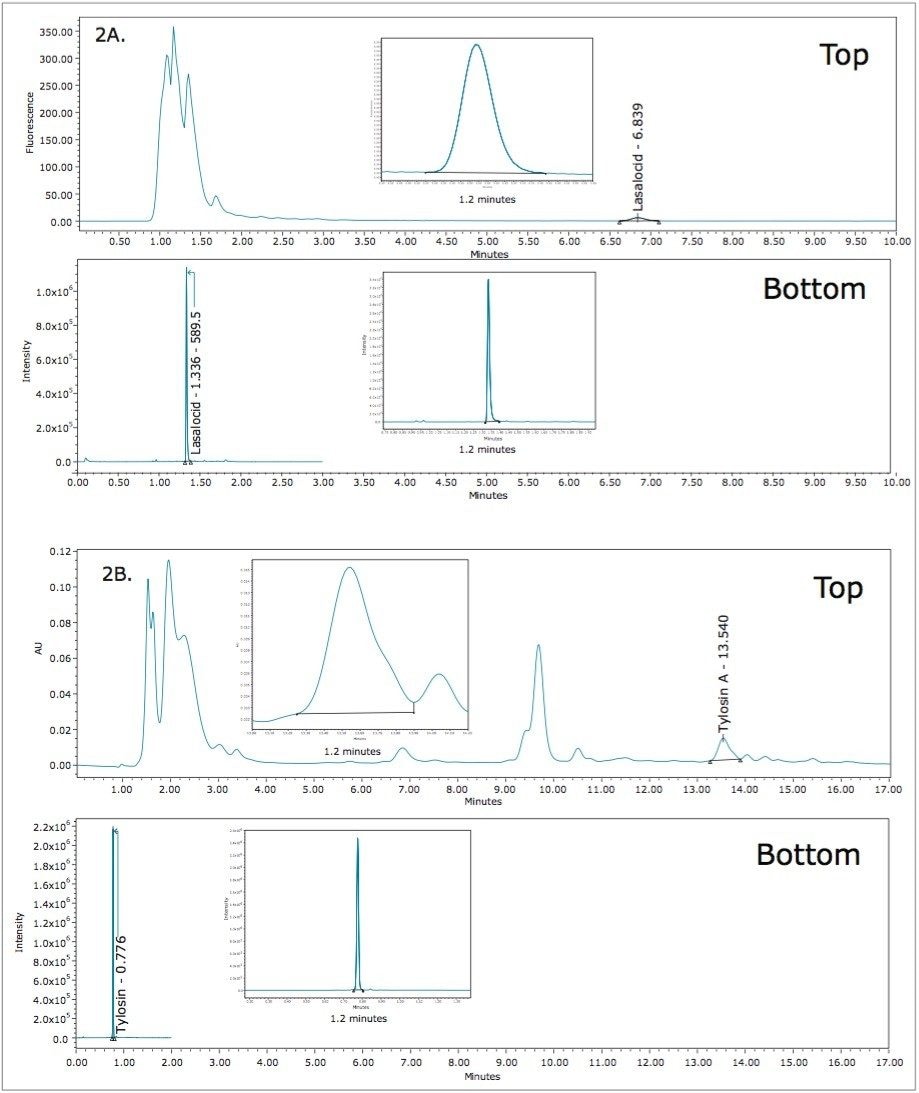
Sample vials were analyzed after extraction at the Consumer Protection Laboratory in Reynoldsburg, OH. Lasalocid and tylosin were analyzed using the Waters Alliance 2695 Separations Module, equipped with a Waters 474 Scanning Fluoresence (FLR) detector, and a Waters 996 Photodiode Array (PDA) Detector, as described in Table 1.

UPLC-MS conditions

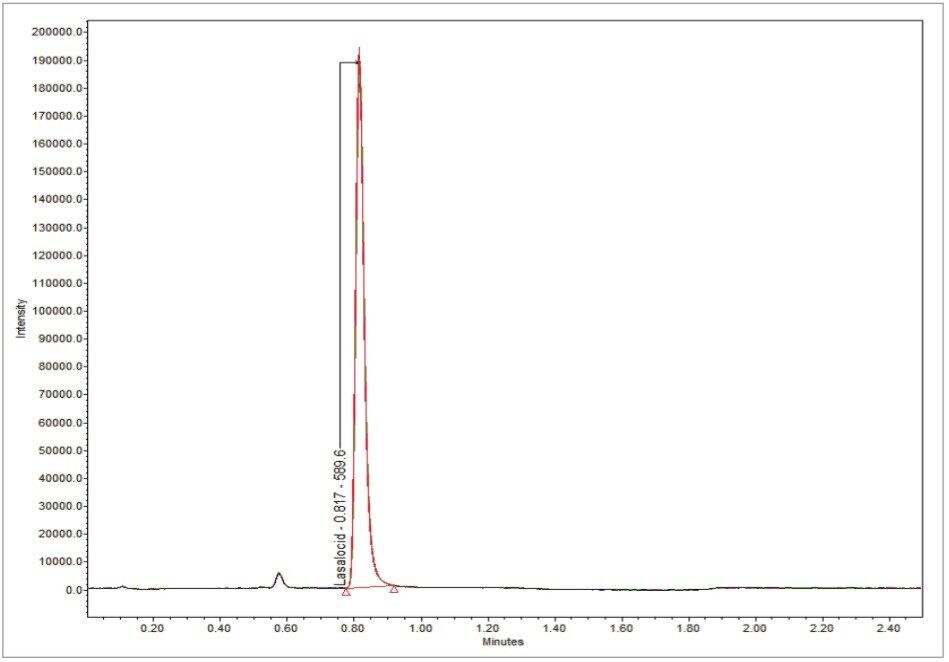
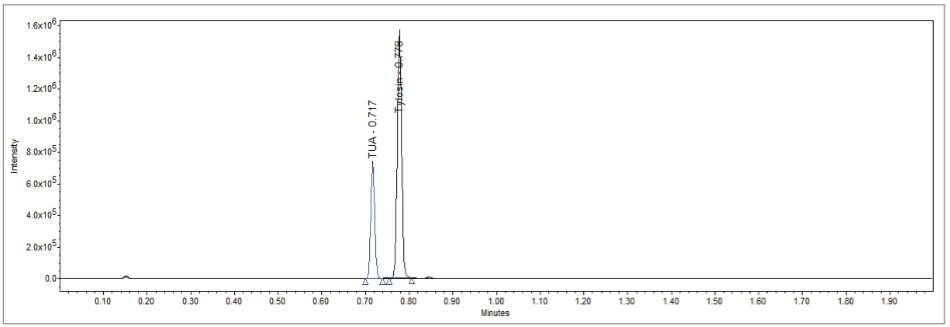
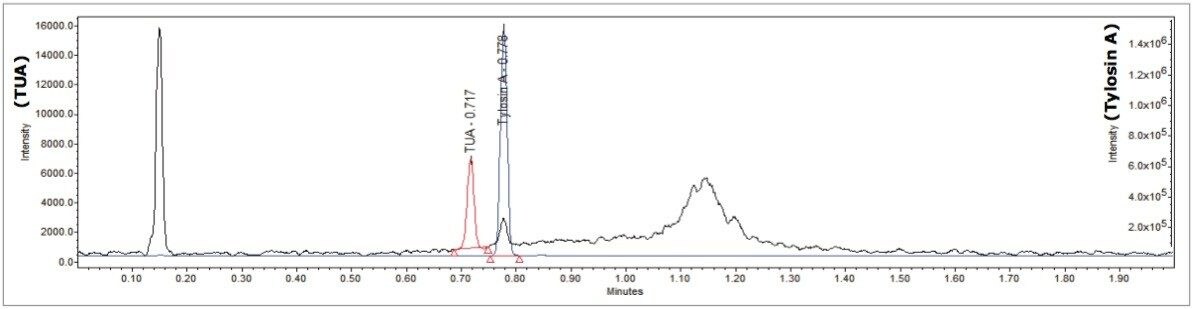
Samples were analyzed using a Waters ACQUITY UPLC System and ACQUITY QDa Mass Detector (Performance version). The experimental parameters are described in detail in Table 1.

Chromatograms from the UPLC-MS analysis were smoothed prior to integration using “mean” smoothing with five points.

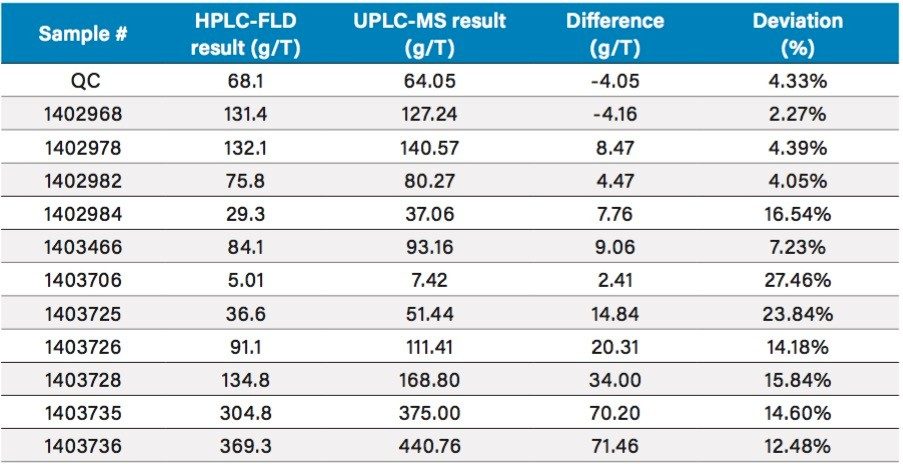
The difference (or deviation) between the different methods for the same sample were calculated by taking the root of the square of the difference divided by the average of the two results for each sample.

Table 1. Chromatographic conditions for the comparison study.

Results and Discussion

Calibration curves (peak area versus concentration) were prepared for lasalocid and tylosin. The R2 values for the lasalocid curve were 0.999984 for HPLC-FLD 0.999458 for UPLC-MS. The R2 values for the tylosin curve were R2 = 0.999996 for HPLC-PDA and 0.998943 for UPLC-MS.

Determination of analytes using UV or fluorescence detection requires chromatographic baseline separation. The high selectivity unit mass detection resolution) in the detection of the analytes using the ACQUITY QDa allowed for the determination of lasalocid and tylosin without interference from the matrix.

Results of lasalocid and tylosin for QC and actual samples determined from the UPLC-MS system were compared with those from conventional HPLC systems (existing methods, see Figure 2). Table 2 shows the comparison results, as well as the differences between these two result sets. More importantly, the results for the QC sample was in close agreement for both methods with a deviation of <10% for both lasalocid and tylosin.

Figure 2A. Top: HPLC-FLD at Ex 314 nm and Em 418 nm; Bottom: a chromatogram depicting lasalocid from sample 1402984 with UPLC-MS SIR at m/z 589.6.
Figure 2B. Top: Chromatogram depicting tylosin from sample 1403969 with HPLC-PDA at UV 286.4 nm; Bottom: UPLC-MS SIR at m/z 916.6.

Lasalocid results comparisons

Tylosin results comparisons

Table 2. Top, a comparison of results obtained from HPLC-FLD and UPLC-MS for lasalocid. Bottom, a comparison of results obtained from HPLC-PDA and MS for tylosin. TUA was not included in this table.

Given the variety of methods and complexity of feed samples, variations within proficiency test studies have resulted in widely acceptable variations recommended by the Association of American Feed Control Officials (AAFCO).3 For all the different matrices tested, the lasalocid samples showed a deviation from 2.3% up to 27.5% for the two different methods employed. The tylosin samples carried a deviation from 0.1% up to 11.8%.

Given the challenging matrices included in the analysis, and the wide range of variation reported from PT studies, the good agreement for the majority of samples is very encouraging. For the two samples that showed a >20% deviation for lasalocid, further investigation is warranted.

The repeatability of lasalocid on the UPLC-MS system was tested by injecting sample number 1403736 10 times in sequence, as shown in Figure 3. The excellent repeatability from 0.2 μL injection volumes provide evidence of the ability of the ACQUITY QDa Detector to handle high volumes of feed matrices without the need for constant maintenance.

Figure 3. A chromatogram depicting 10 replicate injections of sample 1403736 on the UPLC-MS at 0.2 μL injection volumes. Retention time relative standard deviation (RSD) was 0.07% and area RSD was 1.2%. See Table 2 for concentrations.

Tylosin Urea Adduct

Feeds produced for ruminants often contain urea (m/z = 60.06), and are sometimes used as an inexpensive replacement for a part of the protein in feed. Tylosin is known to form an adduct with urea in feeds to create a tylosin urea adduct (TUA) which complicates conventional HPLC analyses of tylosin with the need to confirm an additional peak with an analyte with which there is no readily available standard.

TUA was identified using the UPLC-MS system at m/z = 958.6 (tylosin + 1 urea - H2O) and m/z = 1018.7 (tylosin + 2 urea - H2O). Figure 4 details the chromatogram of a tylosin-fortified feed sample where TUA has been clearly detected.

Figure 4. A chromatogram of sample 1403965 displaying m/z = 916.61 for Tylosin (black) and m/z = 1018.70 for TUA (tylosin + 2 urea – H2O, blue) using UPLC-MS.

Using the same procedure outlined for previous conversion studies of TUA to tylosin A,4 an estimate of approximately 30 g TUA per ton of feed in sample 1403965 was obtained. Figure 5 details the chromatogram of a sample that was not labeled to have fortified tylosin A, but which showed residual levels of TUA, which could not have been detected using conventional HPLC-PDA chromatography. The amount of TUA was estimated against a standard of unknown purity to be present at around the 100 ng/mL level. The ability to detect low levels of residual compounds is a significant advantage with a selective mass detector, and we foresee potential applications with complete tylosin determination in the future.

Figure 5. A SIR chromatogram overlay of sample QC-TYL-11 displaying m/z = 916.61 for tylosin (blue, scale on right) and m/z = 1018.70 for TUA (black with red peak, scale on left). The chromatograph displays a residual level of TUA that was not detected with HPLC-PDA.

Conclusion

The ACQUITY UPLC System with the ACQUITY QDa Mass Detector offers a more selective tool for determining lasalocid and tylosin in complex animal feed matrices and allows an accessible means to incorporate mass spectrometry into a feed regulatory laboratory, both in terms of cost and in ease of use.

The tylosin urea adduct (TUA) was identified at both residual and feed-level concentrations. The ACQUITY QDa Mass Detector provided confirmation of TUA through selective ion monitoring.

Further method development for the UPLC-MS is planned for consolidating extraction methodology, adding additional antibiotic analytes, and for incorporating single-injection, multi-analyte quantitation.

References

  1. Official Methods of Analysis of AOAC INTERNATIONAL (2012) 19th Ed., AOAC INTERNATIONAL, Gaithersburg, MD, USA.
  2. Official Methods of Analysis of AOAC INTERNATIONAL (2012) 19th Ed., AOAC INTERNATIONAL, Gaithersburg, MD, USA, Official Method 2008.01.
  3. Proficiency Testing Program Method Performance Reports, AAFCO, 2015 (http://www.aafco.org/ Laboratory/Proficiency-Testing-Programs/ Method-Performance-Reports).
  4. JE Houglum, MK Tasler. Liquid chromatographic assay of tylosin in animal feeds. J AOAC Int. 79: 369–374, 1996.

Acknowledgements

We thank Alpharma/Zoetis and USP for their provision of standards. We kindly acknowledge Nancy Thiex of South Dakota for TUA consultation over the years. We are grateful to David Wait of Waters Corporation for facilitating and coordinating the collaboration between the Ohio Department of  Consumer Protection Laboratory and Waters Corporation.

720005546, March 2017

Back To Top Back To Top