In this work, we present data using a UPLC/oa-Tof MS platform with extended dynamic range capability that broadens its utility for metabolism studies.
The application area of drug metabolism analysis is complex and extremely challenging. LC-MS is well-suited for this, due to its inherent sensitivity and selectivity. It has revolutionized many areas of the drug discovery process, in particular lead optimization, where tandem mass spectrometry is widely used to generate ADME information for new compounds. Quantitative data is usually provided by MRM experiments using tandem quadrupole MS to determine rate of metabolism, but does not provide qualitative information on the sited mechanism of metabolism. The prevalent requirement to identify metabolites has led to a significant increase in the use of exact mass measurements. LC coupled to orthogonal acceleration-time of flight (oa-Tof) mass spectrometers addresses this need by providing sensitive and accurate qualitative and quantitative information from one analysis.
The dynamic range of LC-Tof instruments has been improved, removing errors in quantification and exact mass measurement at high metabolite concentrations. Combining the Waters Micromass Q-Tof Premier Mass Spectrometer with the Waters ACQUITY UltraPerformance LC System, which provides faster analysis and improved chromatographic resolution, we can generate higher quality data to permit automated data processing and a unique mass defect to confidently distinguish drug-related metabolites from matrix components.
In this work, we present data using a UPLC/oa-Tof MS platform with extended dynamic range capability that broadens its utility for metabolism studies. Rat microsomal incubations of 5 drug candidates were analyzed: Verapamil, Clozapine, Glyburide, Dextromethorphan, and Ketoconazole (due to the extensive data produced, only verapamil and dextromethorphan are shown). The metabolites were automatically identified using the MetaboLynx Application Manager for MassLynx Software, a post-acquisition data processing package in which expected and unexpected metabolites can be identified by comparing control and analyte samples. MetaboLynx has been enhanced further to use the specificity of exact mass measurement and apply mass defect filters. The mass defect filter utilizes the exact mass and mass deficiency of the parent drug compound to rapidly identify only drug-related metabolites.
MS system: |
Q-Tof Premier oa-Tof Mass Spectrometer |
Ionization mode: |
ESI+ at 3 kV |
Cone voltage: |
40 V |
Reference mass: |
Leucine enkephalin, [M+H]+= 556.2771 |
Acquisition details: |
100 –1000 m/z, 0.2 sec/spectrum0.1 sec inter-acquisition delay |
Resolution: |
>8000 FWHM (V mode) |
LC system: |
ACQUITY UPLC System |
Column: |
ACQUITY UPLC BEH C18 2.1 x 100 mm, 1.7 μm |
Column temp.: |
45 °C |
Flow: |
0.6 mL/min |
Mobile phase: |
A: H2O (0.1% HCOOH) B: MeCN |
Gradient: |
0.0 min 2% B, 8.0 min 98% B, 10.0 min 98% B, 10.1 min 2% B, 13.0 min 2% B |
LC system: |
Waters Alliance HT system |
Column: |
Symmetry C18 2.1 x 100 mm, 3.5 μm |
Column temp.: |
35 °C |
Flow: |
0.3 mL/min |
Mobile phase: |
A: H2O (0.1 % Formic Acid) B: MeCN |
Gradient: |
0.0 –0.5 min 2% B, 0.5 –20.0 min 80% B, 20.0 –30.0 min 80% B, 30.0 –30.5 min 2% B, 30.5 –35.0 min 2% B |
Microsomes: |
Human microsomes/S9 |
Water bath temp.: |
37 °C |
Buffers: |
50–100 mM Trisor K Phosphate @ pH 7.4 |
NADPH Regenerating System (NRS) in 2% NaHCO3(Sigma S-5761) Solution: |
0.5 mg/mL b-NADP (Sigma N-0505), 2.0 mg/mL Glucose-6-phosphate (Sigma G-7879), 1.5 units/mL Glucose-6-phosphate dehydrogenase (Sigma G-7877) |
Quench: |
Equal volume MeCN |
Drug concentration: |
100 μL 0.1 mg/mL, final quench volume 2 mL |
In Figure 2, the UPLC-Tof extracted mass chromatograms for metabolites formed for the in vitro incubation of dextromethorphan are shown at T = 15 min, T = 30 min, and T = 60 min time points. Presented in Figure 3 are the exact mass spectra for the demethylatedmetabolite formed for the in vitroincubation of dextromethorphan at each of the time points described above. Illustrated in Figure 4 are the exact mass spectra for the parent drug at each of the time points. In Figure 5, the exact mass spectra are shown for the hydroxlylated metabolite formed for the in vitro incubation of dextromethorphan at each of the time points. UPLC-Tof/MS extracted masschromatograms for metabolites formed for the in vitro incubation of verapamil are presented in Figure 6. The corresponding UPLC-Tof/MS extracted mass chromatograms are summarized in Figure 7, with the un-metabolized parent (labelled “A”). The metabolites shown are identified in Table 1 (labeled “B” through “J”).
Figure |
Metabolite I dentified |
---|---|
7b. |
cleaved N-de-alkylation/hydroxylation |
7c. |
cleaved/de-methylation |
7d. |
cleaved |
7e. |
glucuronidation/de-ethylation |
7f. |
de-ethylated |
7g. |
glucuronidation/de-methylation |
7h. |
hydroxylation |
7i. |
de-alkylation/hydroxylation |
7j. |
de-methylation |
Table 1. A list of the metabolites identified in Figure 7.
The reduced data set produced by MetaboLynx is displayed in a browser format in Figure 8, where the results of application of the post-processing mass defect data filter are illustrated.
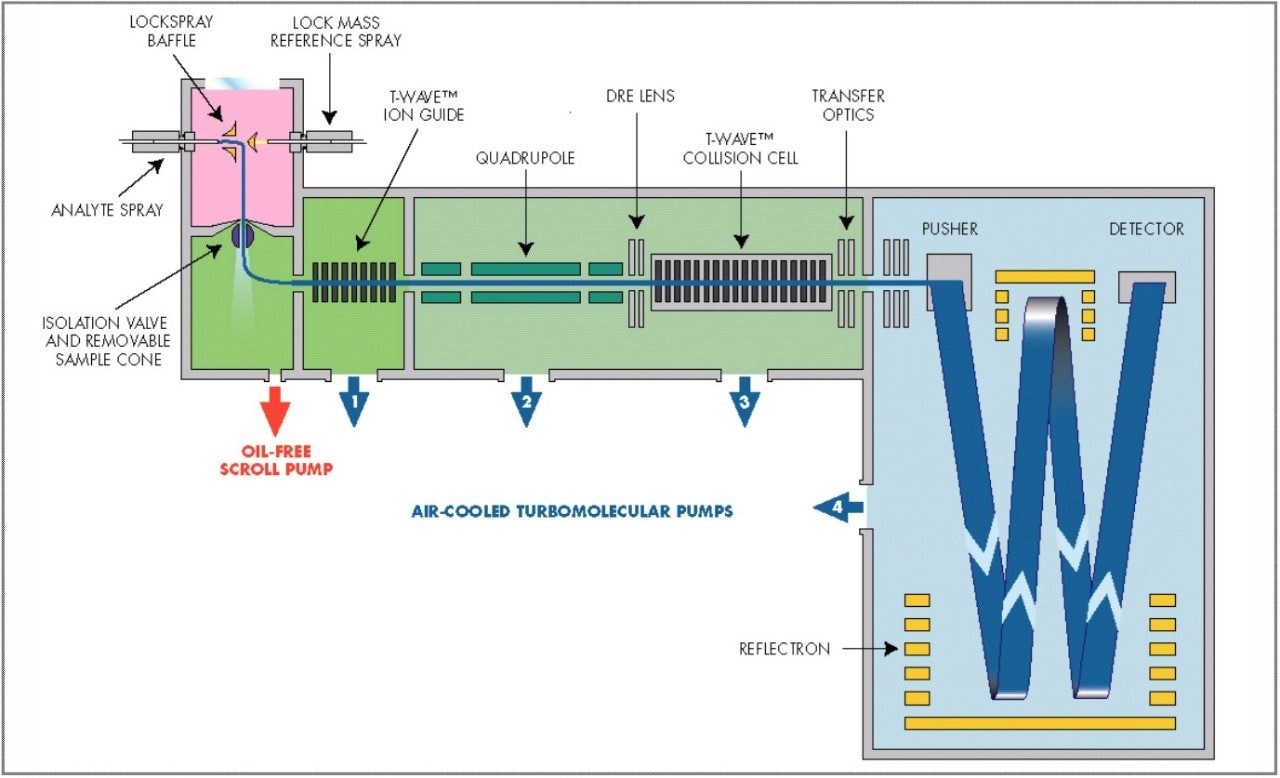
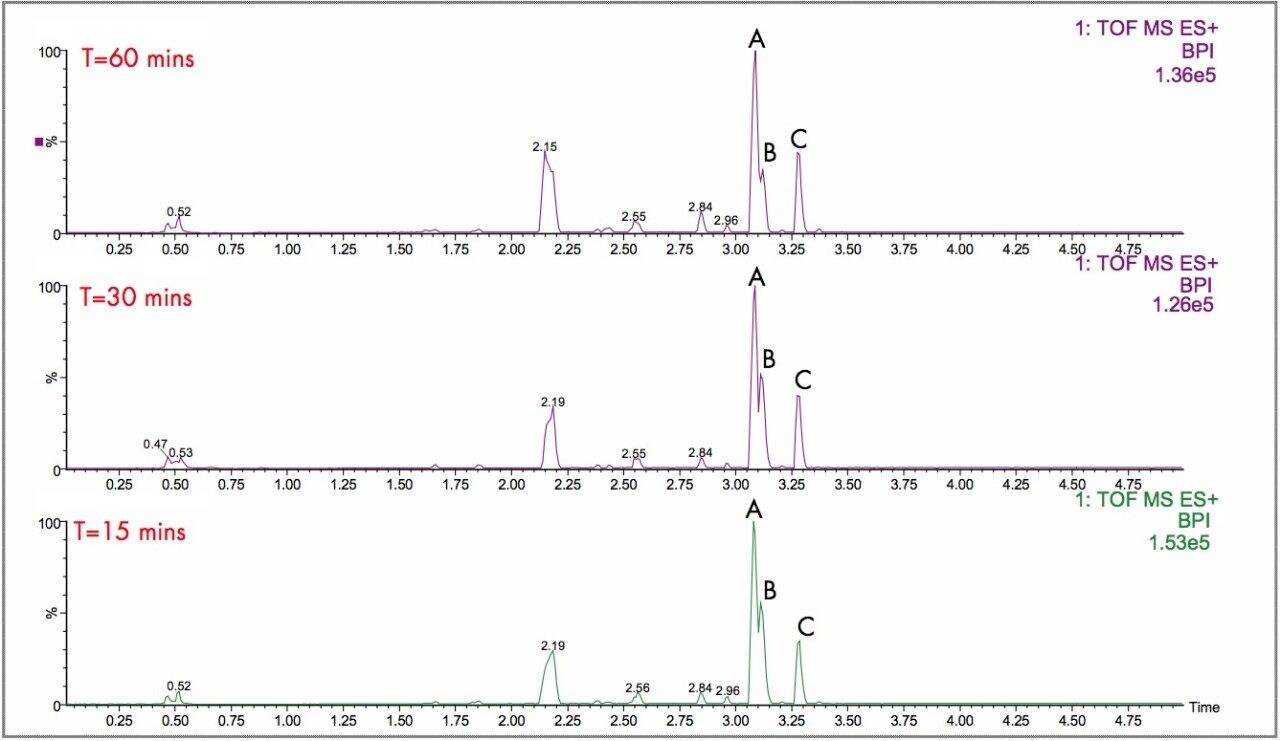
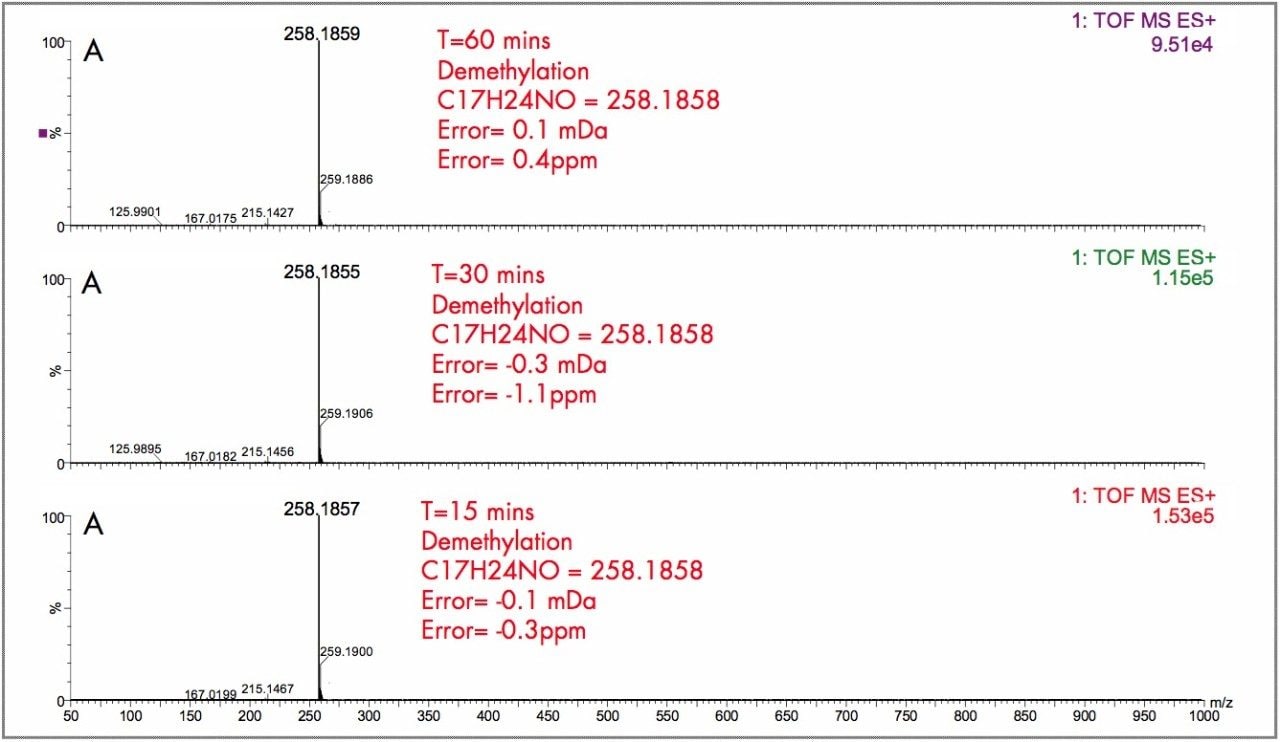
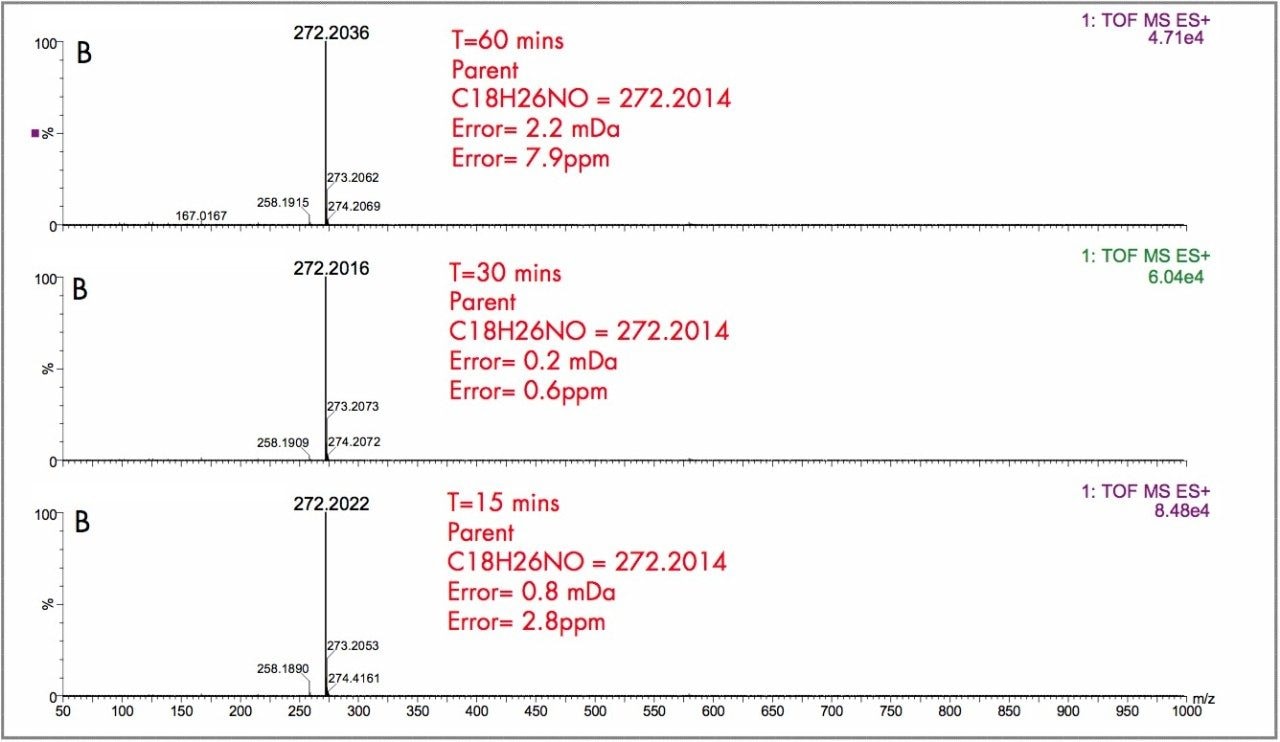
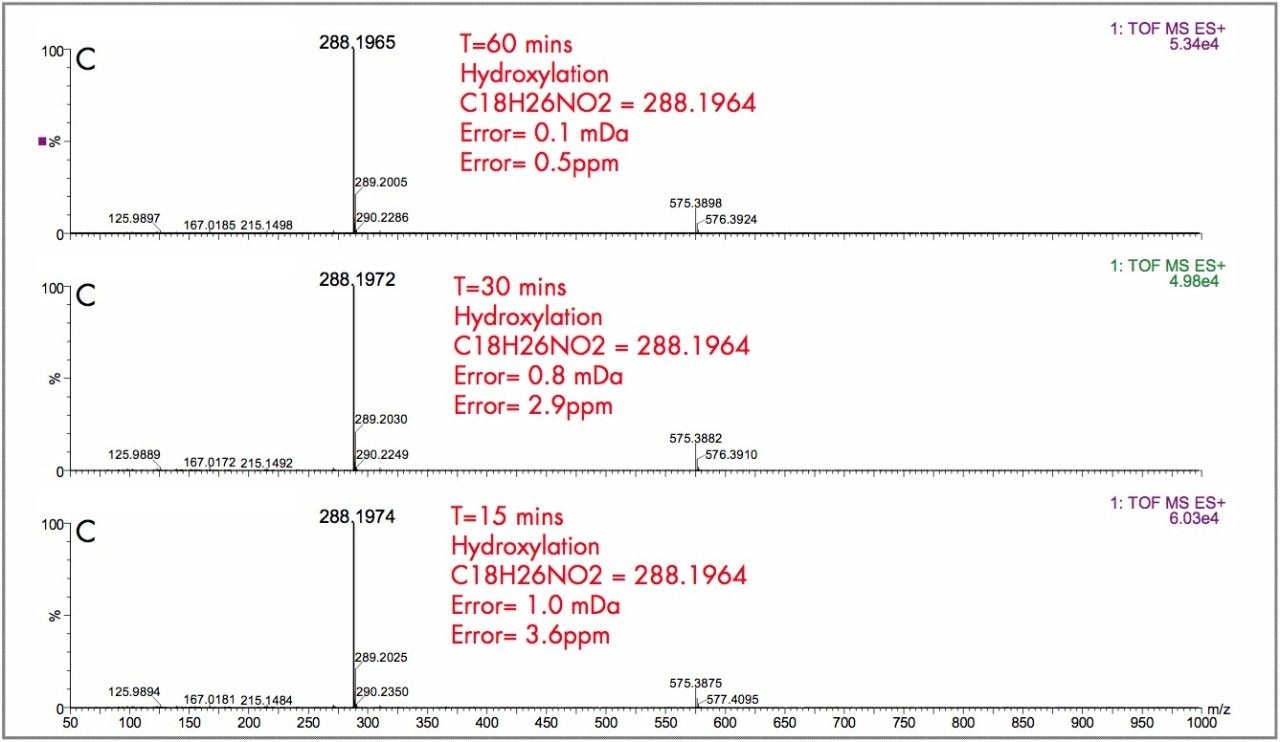
The parent drugs verapamil and dextromethorphan were incubated in vitrousing human S9 microsomes. These incubations were utilized to test both hardware and software enhancements for determining the metabolic fate of drugs. The schematic of a Q-Tof Premier in Figure 1 shows the pDRE lens, which enhances the analytical applicability of oa-Tof MS. This feature has enabled extended dynamic range up to 4 orders of magnitude, providing both qualitative and quantitative capabilities with good exact mass measurements for highly concentrated peaks. Previously, at high ion counts, a shift to lower mass would occur, giving incorrect mass measurement and less confidence in elemental composition determination. Selection of spectra at low ion counts would provide excellent mass measurement and high confidence in the resultant data, however, this could be a laborious task. Even at high ion counts, pDRE allows either the peak top, or the whole peak to be averaged to generate an exact mass spectrum. This improves the ease with which data can be generated and processed. Also, since no detector saturation is taking place, a true profile of the route and rate of metabolism will be obtained. The impact of dynamic range enhancement can be seen in Figure 2 where the UPLC-Tof BPI chromatograms formetabolites formed, for the in vitroincubation of dextromethorphan are shown at time points 15 min, 30 min, and 60 min. A true chromatographic profile is observed. The exact mass spectra obtained for the demethylated (labeled “A”) and hydroxylated metabolites (labeled “C”), can be seen for 3 time point intensities in Figures 3 and 5, respectively. In each case the spectra comprised of a single spectrum, generated from the top of the peak. Intensities of up to 150,000 counts per ion accumulation are illustrated, where no detector saturation has been observed and mass measurement errors of typically less than 3 ppm have been obtained. The corresponding spectra produced for the remaining parent dextromethorphan are shown in Figure 4. pDRE has enabled exact mass measurement to be obtained routinely over a suitable concentration range for true measurement of metabolite formation and profiling.
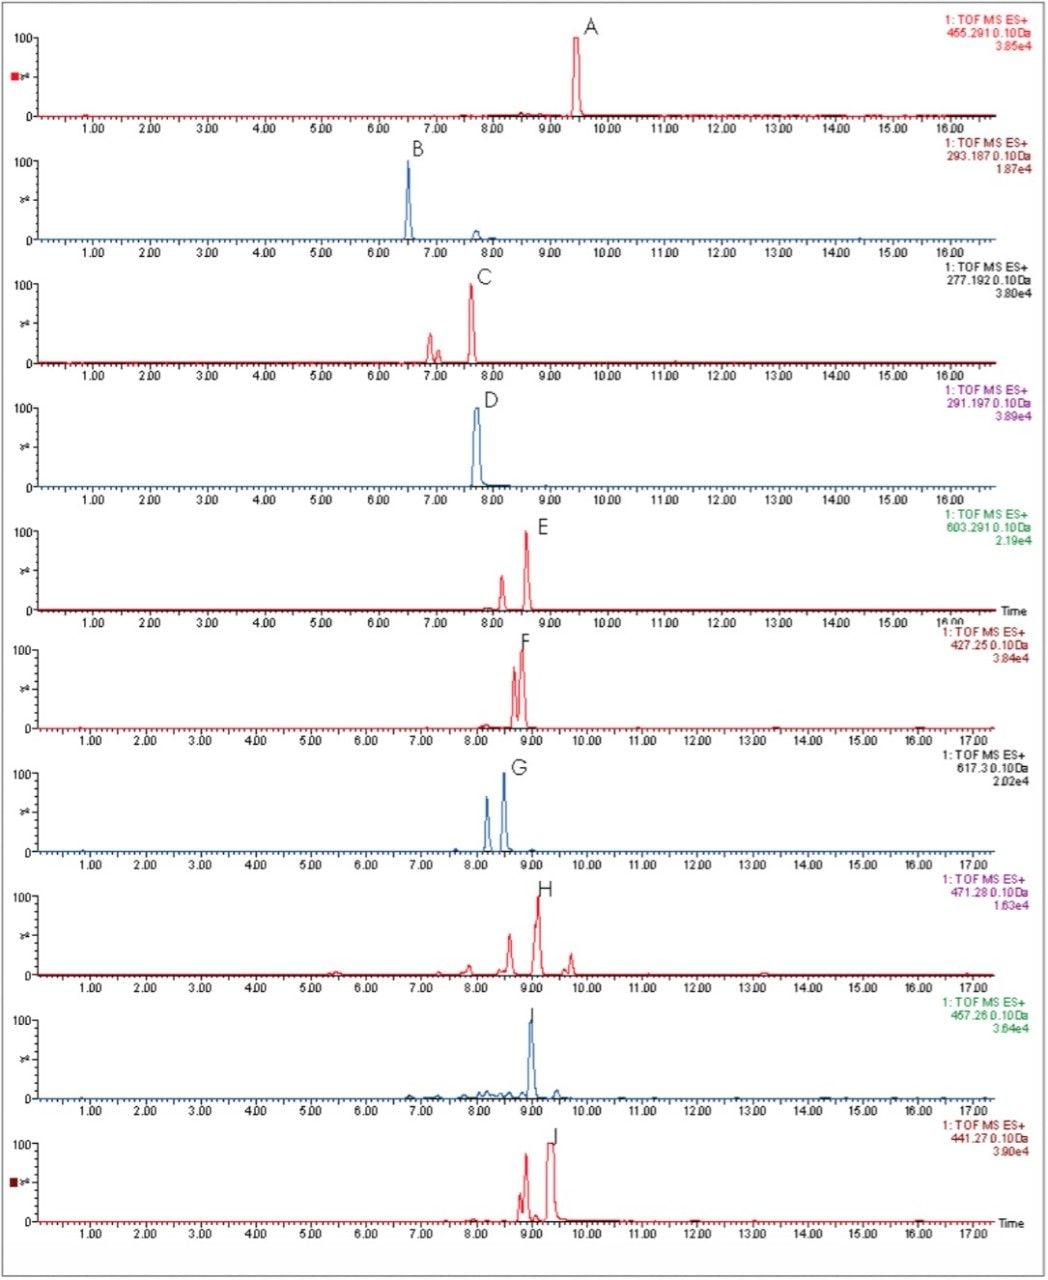
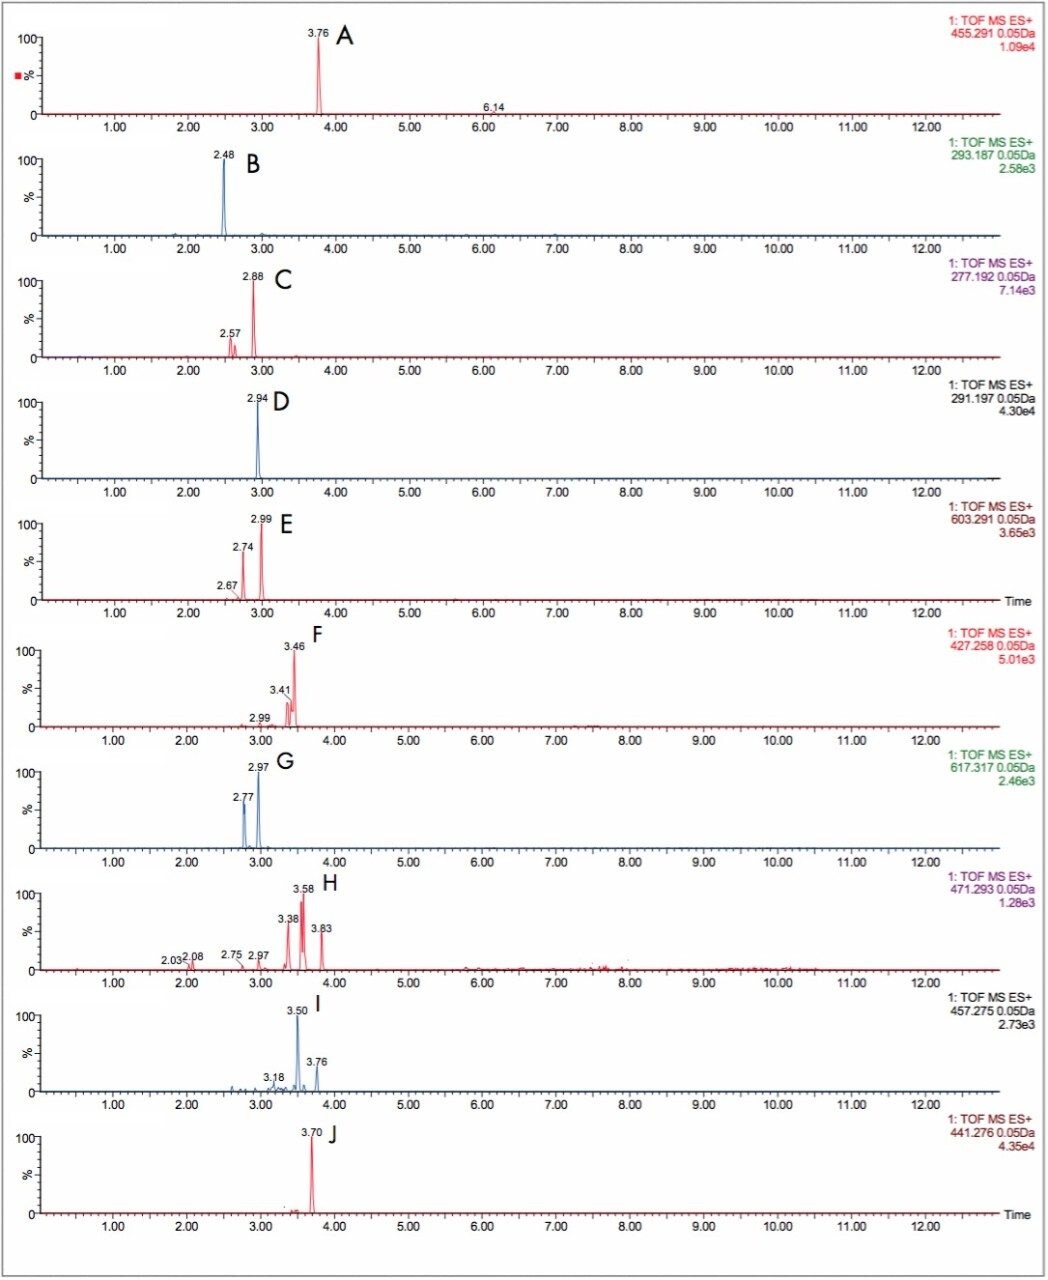
As well as improving mass measurement performance, chromatography technology has also be enhanced by using Ultra Performance LC. In Figures 6 and 7, the HPLC and UPLC-Tof extracted mass chromatograms for metabolites formed for the in vitroincubation of verapamil are presented. The HPLC data was acquired as part of a previous study.1 It is shown that not only is analysis time reduced by greater than 50%, but chromatographic resolution is also improved. Metabolite isomers can now be chromatographically resolved, reducing the risk of “missed” metabolites. Improved chromatographic resolution also adds further opportunity to obtain higher quality MS data, reducing the need for multiple simultaneous MS experiments.
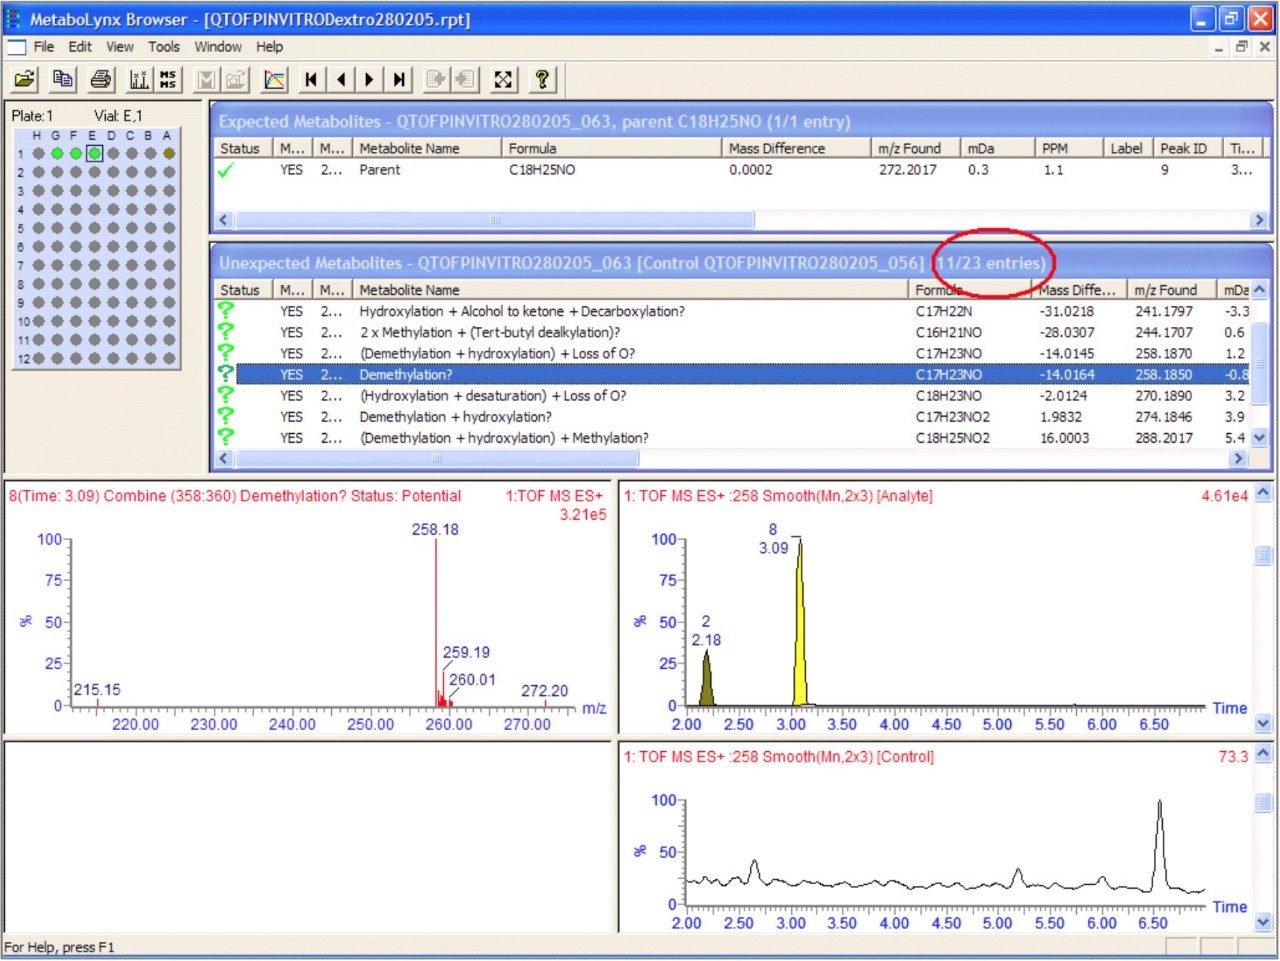
An illustration of the MetaboLynx report browser is contained in Figure 8. The processing of metabolism data is usually a significant bottleneck in metabolite identification. Using MetaboLynx to automatically process the data accelerates this step. The reduced data are displayed on a results browser, which allows rapid interpretation of the data. In addition the data can be greatly simplified by application of the post-processing mass defect data filter. The mass defectproperty of the parent drug will be maintained within a narrow mass range window, for both phase I and phase II biotransformations. The ability to acquire enhanced quality accurate mass spectra provides the opportunity to exploit mass sufficiency and deficiency. Application of a +/–7 mDa mass defect window has enabled the number of unexpected metabolites found to be reduced to 11 from 23. This post-processing step enabled immediate removal of 12 non drug matrix-related unexpected metabolites to be removed.
720001419, December 2005