A Combined Method for Anionic, Cationic, and Zwitterionic PFAS using a Direct Injection UPLC™-MS/MS Method for Environmental Water Samples
Sara Beverley
Waters Corporation, Wilmslow, United Kingdom
Published on February 26, 2026
Abstract
This application note describes the expansion of scope of a targeted method for the analysis of PFAS using a simple sample preparation procedure and direct injection. In response to the increased proportion of cationic and zwitterionic PFAS being recently reported in the aquatic environment, an existing Waters method1 has been expanded to include representative anionic, cationic, and zwitterionic forms. Isotopically labeled internal standards (ILIS) were included prior to sample preparation to improve the performance in complex matrices allowing for the use of solvent standards for quantitation. The method was optimized for the Xevo™ TQ Absolute XR Mass Spectrometer using positive and negative polarity UniSpray™ Ionization Source and nitrogen collision gas. The method performance has been validated in a variety of environmental water samples including surface, ground, treated and wastewater and shown to achieve sub ng/L lower limits of quantitation (LLOQs) in line with EU and U.K. regulatory requirements.
Benefits
Expanding the scope of PFAS analysis in a single injection to include anionic, cationic, and zwitterionic forms.
- A sensitive, direct injection method for the analysis of PFAS in environmental water samples in accordance with the regulatory requirements for environmental water testing in the EU and U.K.
- High sample throughput with reduced downtime due to the extreme robustness of the Xevo TQ Absolute XR Mass Spectrometer.
- Quantitative method for 58 native and 23 ILIS PFAS with fast polarity switching demonstrating that the analytical scope can be readily extended to include emerging PFAS with different chemical properties.
- Time and cost savings due to the efficiency gains in all aspects of method development, data processing, and review using waters_connect™ for Quantitation Software.
Introduction
Per- and polyfluoroalkyl substances (PFAS) are among the persistent organic pollutants characterized by their persistence in the environment, high mobility, and adverse impact not only on the ecosystem but also on human health.2 Aqueous film forming foam (AFFF) is recognized as a source of PFAS. Historically used to extinguish hydrocarbon-based fires, AFFF has resulted in PFAS impacts at a variety of military and civilian facilities such as fire training areas (FTAs), AFFF lagoons, fire station testing and maintenance sites, and AFFF storage tanks at aircraft hangars. While most of the scientific research over the last two decades has focused on the anionic PFAS, recent studies have identified an increasing proportion of cationic and zwitterionic PFAS being detected in the aquatic environment with similar toxicity to anionic PFAS.3 For example, 6:2 fluorotelomer sulfonamide alkylbetaine (6:2 FTAB), a zwitterionic PFAS and a novel substitute for perfluorooctanesulfonic acid (PFOS), has been identified in AFFF formulations and groundwater surrounding airfields.4,5 In a recent study, 6:2 FTAB was identified as the second most common fluorinated surfactant in AFFF concentrates. Cationic and zwitterionic PFAS exhibit high stability and are readily released into aquatic environments making their complete removal during water processing extremely challenging.6 In addition, such PFAS types tend to degrade into the anionic, terminal PFAS perpetuating environmental contamination.7
Cationic and zwitterionic PFAS differ from traditional anionic PFAS due to their unique alkyl functional groups, such as betaine, amine, amine oxide, or quaternary ammonium groups, and possess different ionic charges. Due to the presence of multiple polar functional groups or charged moieties, cationic and zwitterionic PFAS are likely to have relatively high solubility in water which explains their frequent detection in environmental samples.7 In response to the escalating contamination by cationic and zwitterionic PFAS, much research is focused on their removal from the natural environment. Such removal techniques include advanced oxidation processes (electrochemical oxidation and photocatalytic degradation), adsorption, pyrolysis and biodegradation processes.8–10
Establishing accurate and robust analytical methods for PFAS, fully representing the chemical diversity, is essential in determining their concentration for both regulatory monitoring and remediation processes. Since 2000, the Water Framework Directive 2000/60/EC (WFD) has been the main legal act for water protection in Europe. Together with the Environmental Quality Standards Directive (EQSD) and the Groundwater Directive, it applies to inland, transitional and coastal surface waters, as well as groundwaters. The WFD covers surface water pollutants of greatest (EU-wide) concern by identifying them as priority substances, including a subset of priority hazardous substances. They are listed in Annex X of the Directive, and environmental standards are set for them in the EQSD. A new standard has been established for the sum of 25 PFAS (expressed as PFOA equivalents).11 In 2025, the Drinking Water Inspectorate (DWI) in England and Wales outlined the requirements for monitoring 48 PFAS (including 6:2 FTAB) with a cumulative limit of 100 ng/L in raw water sources that will ultimately be used for supplying drinking water.12
The Xevo TQ Absolute XR Mass Spectrometer is equipped with a novel slotted bandpass ion guide (StepWave™ XR Ion Transfer Device) that effectively mitigates Q1 quadrupole contamination. This innovation dramatically improves robustness by resisting contamination, one of the most common challenges in high-throughput direct injection workflows.13 A study conducted using the Xevo TQ Absolute XR Mass Spectrometer in complex environmental matrices showed maximal system uptime for PFAS analysis across 24 weeks and more than 17,500 injections with no unscheduled downtime resulting in fewer maintenance interruptions compared to previous generations of the Xevo TQ Mass Spectrometers.14
This application note describes an increase to scope of the direct injection MRM methodology previously reported1 to include representative cationic and zwitterionic PFAS suitable for the analysis of surface, ground, treated and wastewater samples. To achieve the sub ng/L level of detection in a variety of water types, an ACQUITY™ I-Class PLUS System was coupled to the Xevo TQ Absolute XR Mass Spectrometer with UniSpray Ionization Source. Due to the chemical properties of the cationic/zwitterionic PFAS, positive polarity ionization mode was selected as the most sensitive mode for these compounds. The rapid polarity switching capability of the Xevo TQ Absolute XR Mass Spectrometer was utilized to develop a quantitative MRM method for 58 native PFAS and 23 isotopically labeled internal standards.
Experimental
The aims of this study were to expand the scope of the 47 PFAS direct injection method previously reported1 to include additional representatives from the anionic, cationic, and zwitterionic classes in a single chromatographic separation, polarity switching method. The extended method was further optimized to use nitrogen as the collision gas, thus allowing the MS system to be operated using a single gas supply for sustainability purposes. In addition, due to its size and mean free path, nitrogen as a collision gas favors the transmission of low mass product ions which is beneficial for PFAS analysis with many product ions being below m/z 100. As the molecular mass of nitrogen is lower than that of argon, the pressure in the collision cell was increased by adjusting the gas flow to 0.3 mL/min to maintain optimal fragmentation. The collision energies (CE) for each PFAS transition were also adjusted for nitrogen using the default conversion factor of 1.4.
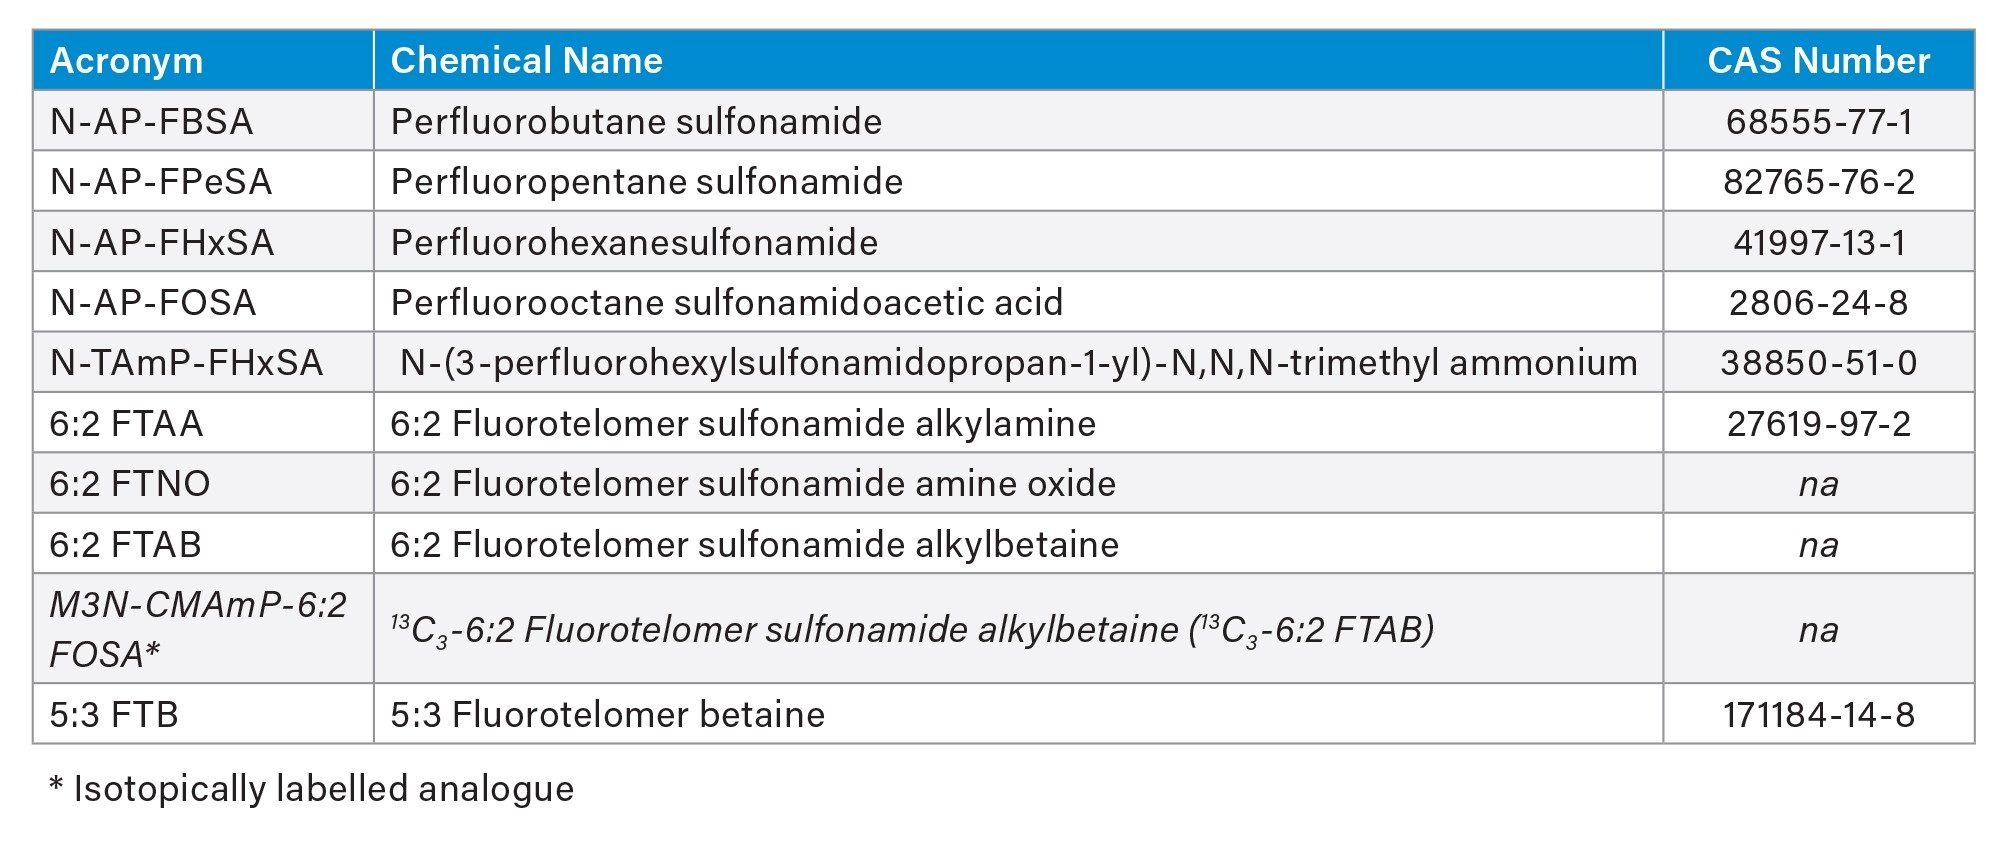
Reference standards for the additional cationic/zwitterionic native PFAS and an isotopically labeled analogue (Table 1) were purchased from Wellington Laboratories. The additional PFAS were all shown to ionize more favorably using positive polarity UniSpray Ionization Source. The MS source parameters were optimized to favor the least sensitive PFAS using the approach previously reported.1 Two MRM transitions were optimized for all native PFAS and a single, most intense MRM for each ILIS.
Table 1. The additional native cationic/zwitterionic PFAS and isotopically labelled analogue included in the analytical scope.
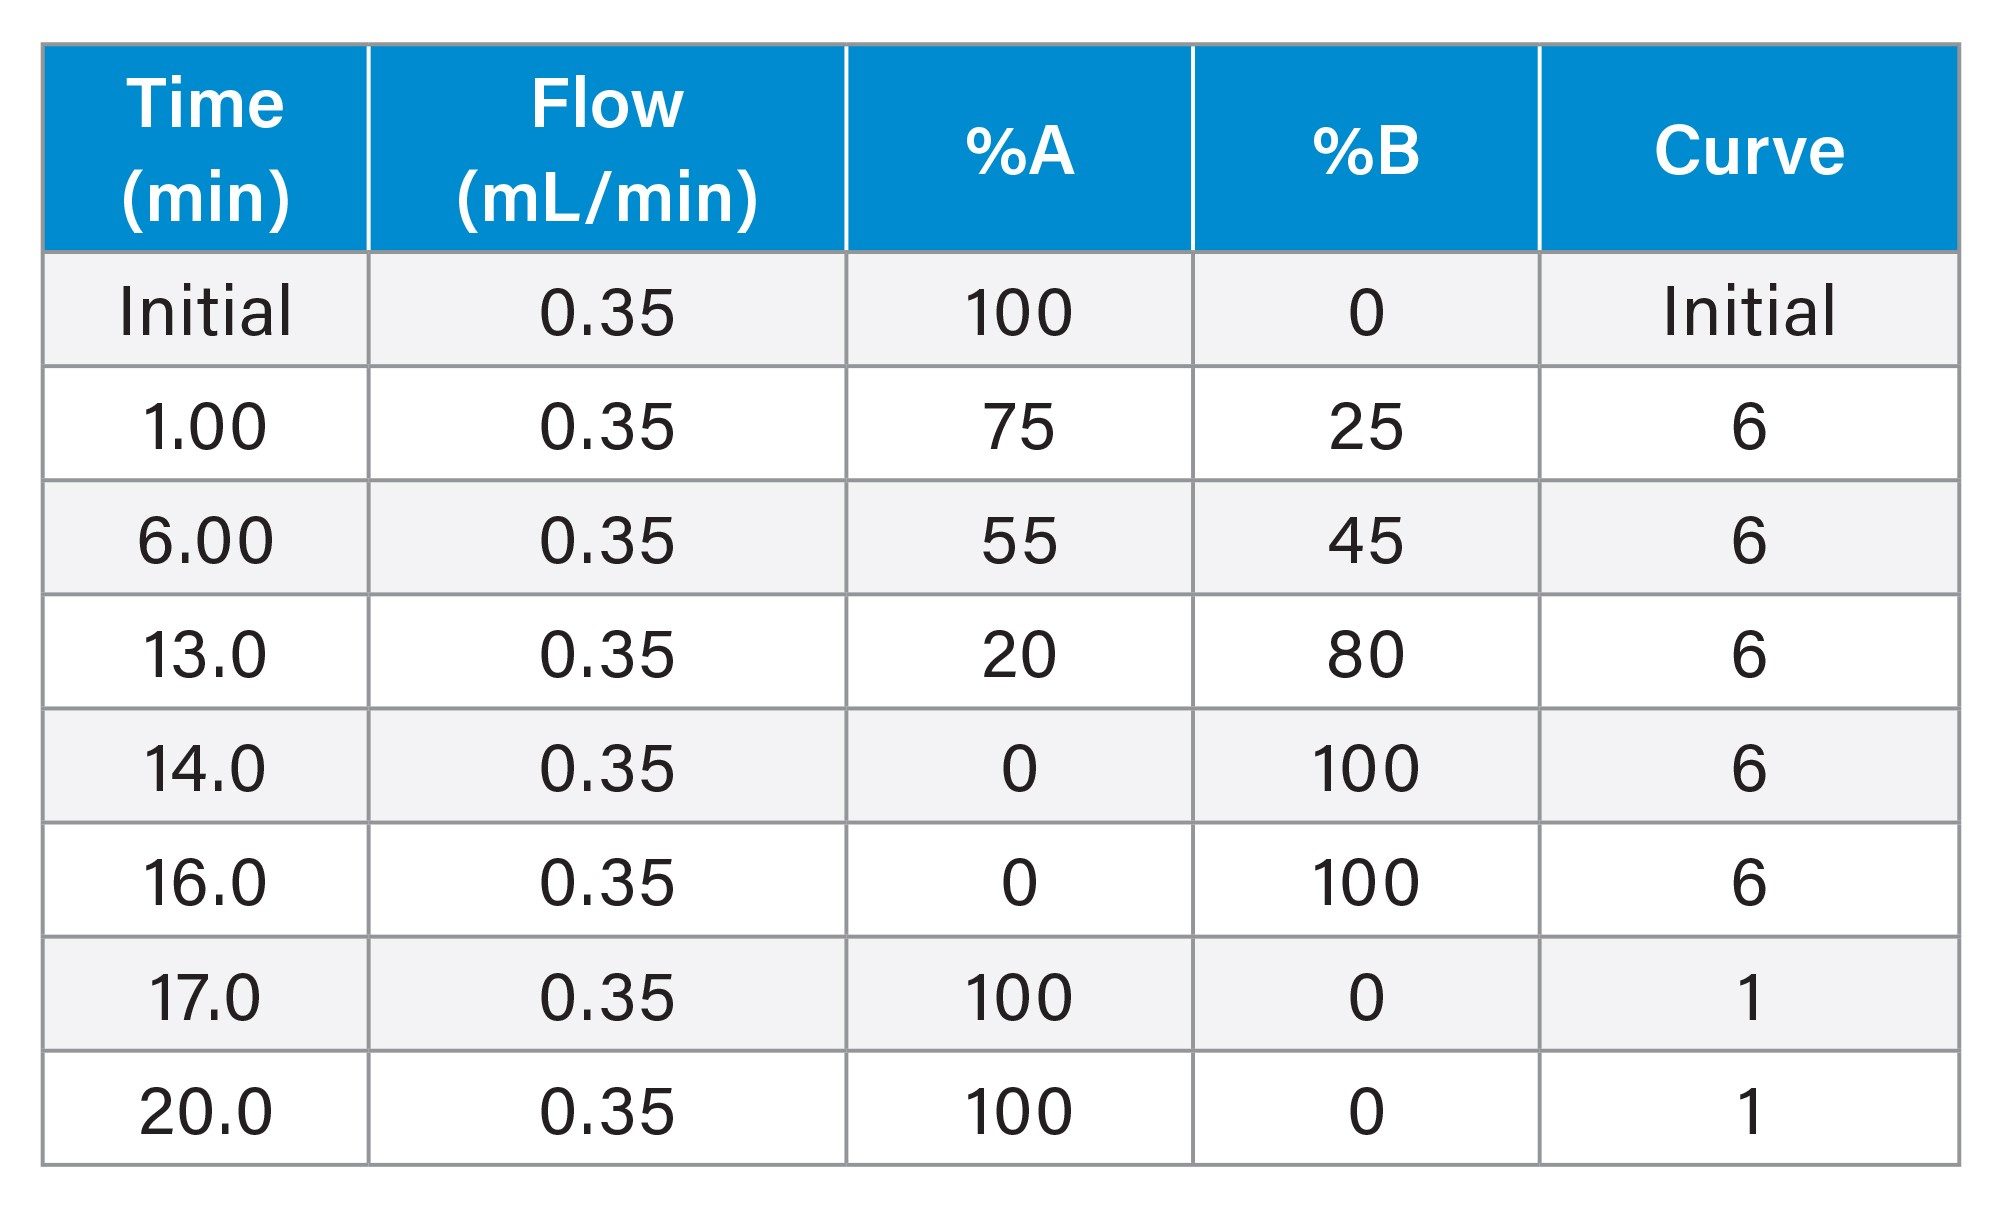
The chromatographic gradient was optimized including the additional PFAS with all 58 native and 23 ILIS PFAS eluting within 16 minutes and an overall 20-minute run time allowing for adequate column cleaning and re-equilibration. The Autodwell functionality within the waters_connect Advanced Method Editor (AME) Application was enabled to ensure a minimum of 12 points per peak were achieved for reliable quantitation based on the average peak width.
Solvent standards with a composition of 50:25:25% water:methanol:acetonitrile containing 0.1% formic acid at the following concentrations were used for quantitation purposes: 0.12, 0.24, 0.6, 2.4, 6.0, 12.0, 24.0, 60.0, 120.0 and 240.0 ng/L. The exact concentration for each PFAS was automatically adjusted in the waters_connect MSQuan Processing Software according to the standard purity and salt concentration information provided with the reference materials.
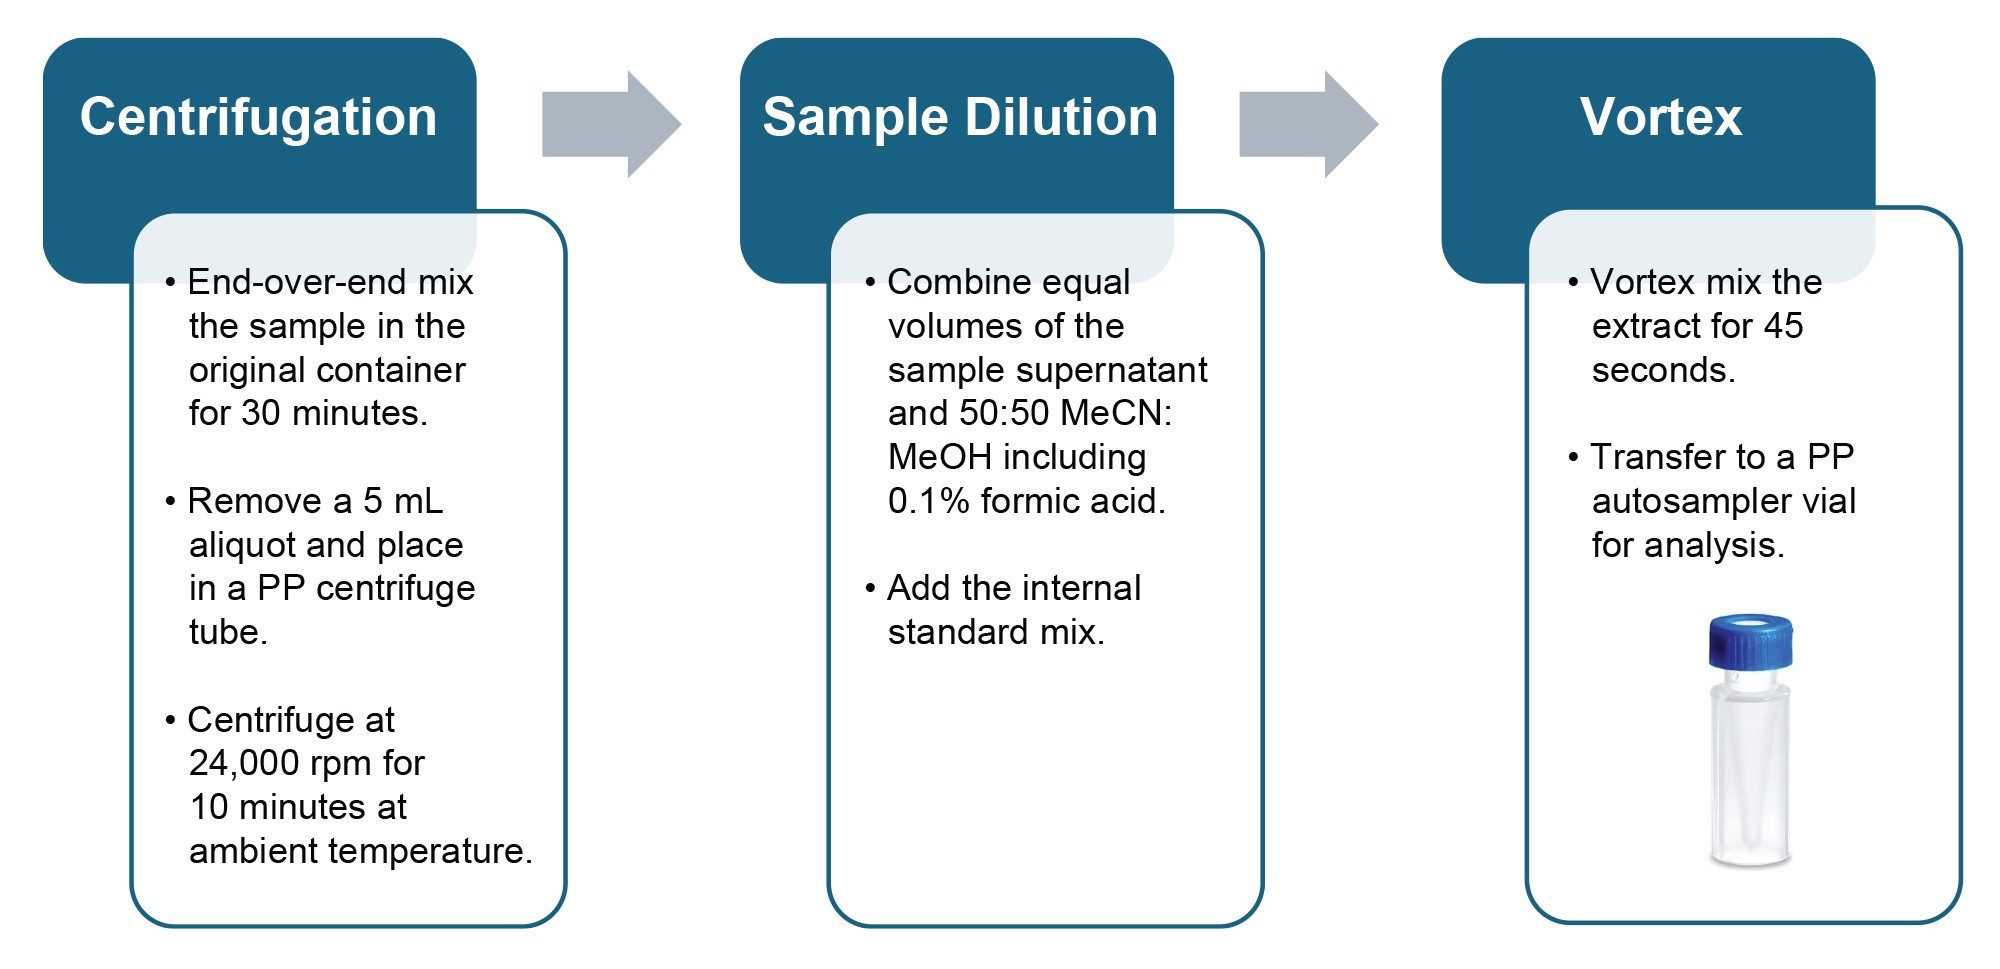
Sample Preparation
Samples of environmental water were obtained from external sources within the U.K. and screened for the presence of PFAS prior to inclusion in the method validation study.
A simple protocol suitable for the preparation of environmental water samples prior to direct injection was developed (Figure 1).
Method Conditions
LC Conditions
|
LC system: |
ACQUITY I-Class PLUS System with BSM and FTN. Sample Manager fitted with Waters PFAS Kit and Atlantis™ Premier BEH™ C18 AX 5 µm, 2.1 x 50 mm Isolator Column (p/n: 186009407) |
|
Vials: |
Polypropylene 12 x 32 mm screw neck vial, 700 µL (p/n: 186005219) with pre-slit PTFE/Silicone septa (p/n: 186000305) |
|
Column(s): |
ACQUITY Premier BEH C18 Column 1.7 µm, 2.1 x 100 mm (p/n: 186009453) |
|
Column temperature: |
40 oC |
|
Sample temperature: |
10 oC |
|
Injection volume: |
50 µL |
|
Flow rate: |
0.350 mL/min |
|
Mobile phase A: |
2 mM ammonium acetate in water:methanol 95:5 (v/v) |
|
Mobile phase B: |
2 mM ammonium acetate in methanol |
Gradient Table
MS Conditions
|
MS system: |
Xevo TQ Absolute XR Mass Spectrometer |
|
Ionization mode: |
UniSpray Ionization Source positive/ negative mode |
|
Acquisition mode: |
MRM |
|
Impactor voltage: |
1 kV |
|
Desolvation temperature: |
450 oC |
|
Desolvation gas flow: |
900 L/hr |
|
Cone gas flow: |
150 L/hr |
|
Source temperature: |
110 oC |
|
Collision energy: |
See Table 2 |
|
Cone voltage: |
See Table 2 |
Data Mangement
|
Software: |
waters_connect for Quantitation Software |
Results and Discussion
Instrument and Method Performance in Environmental Water Samples
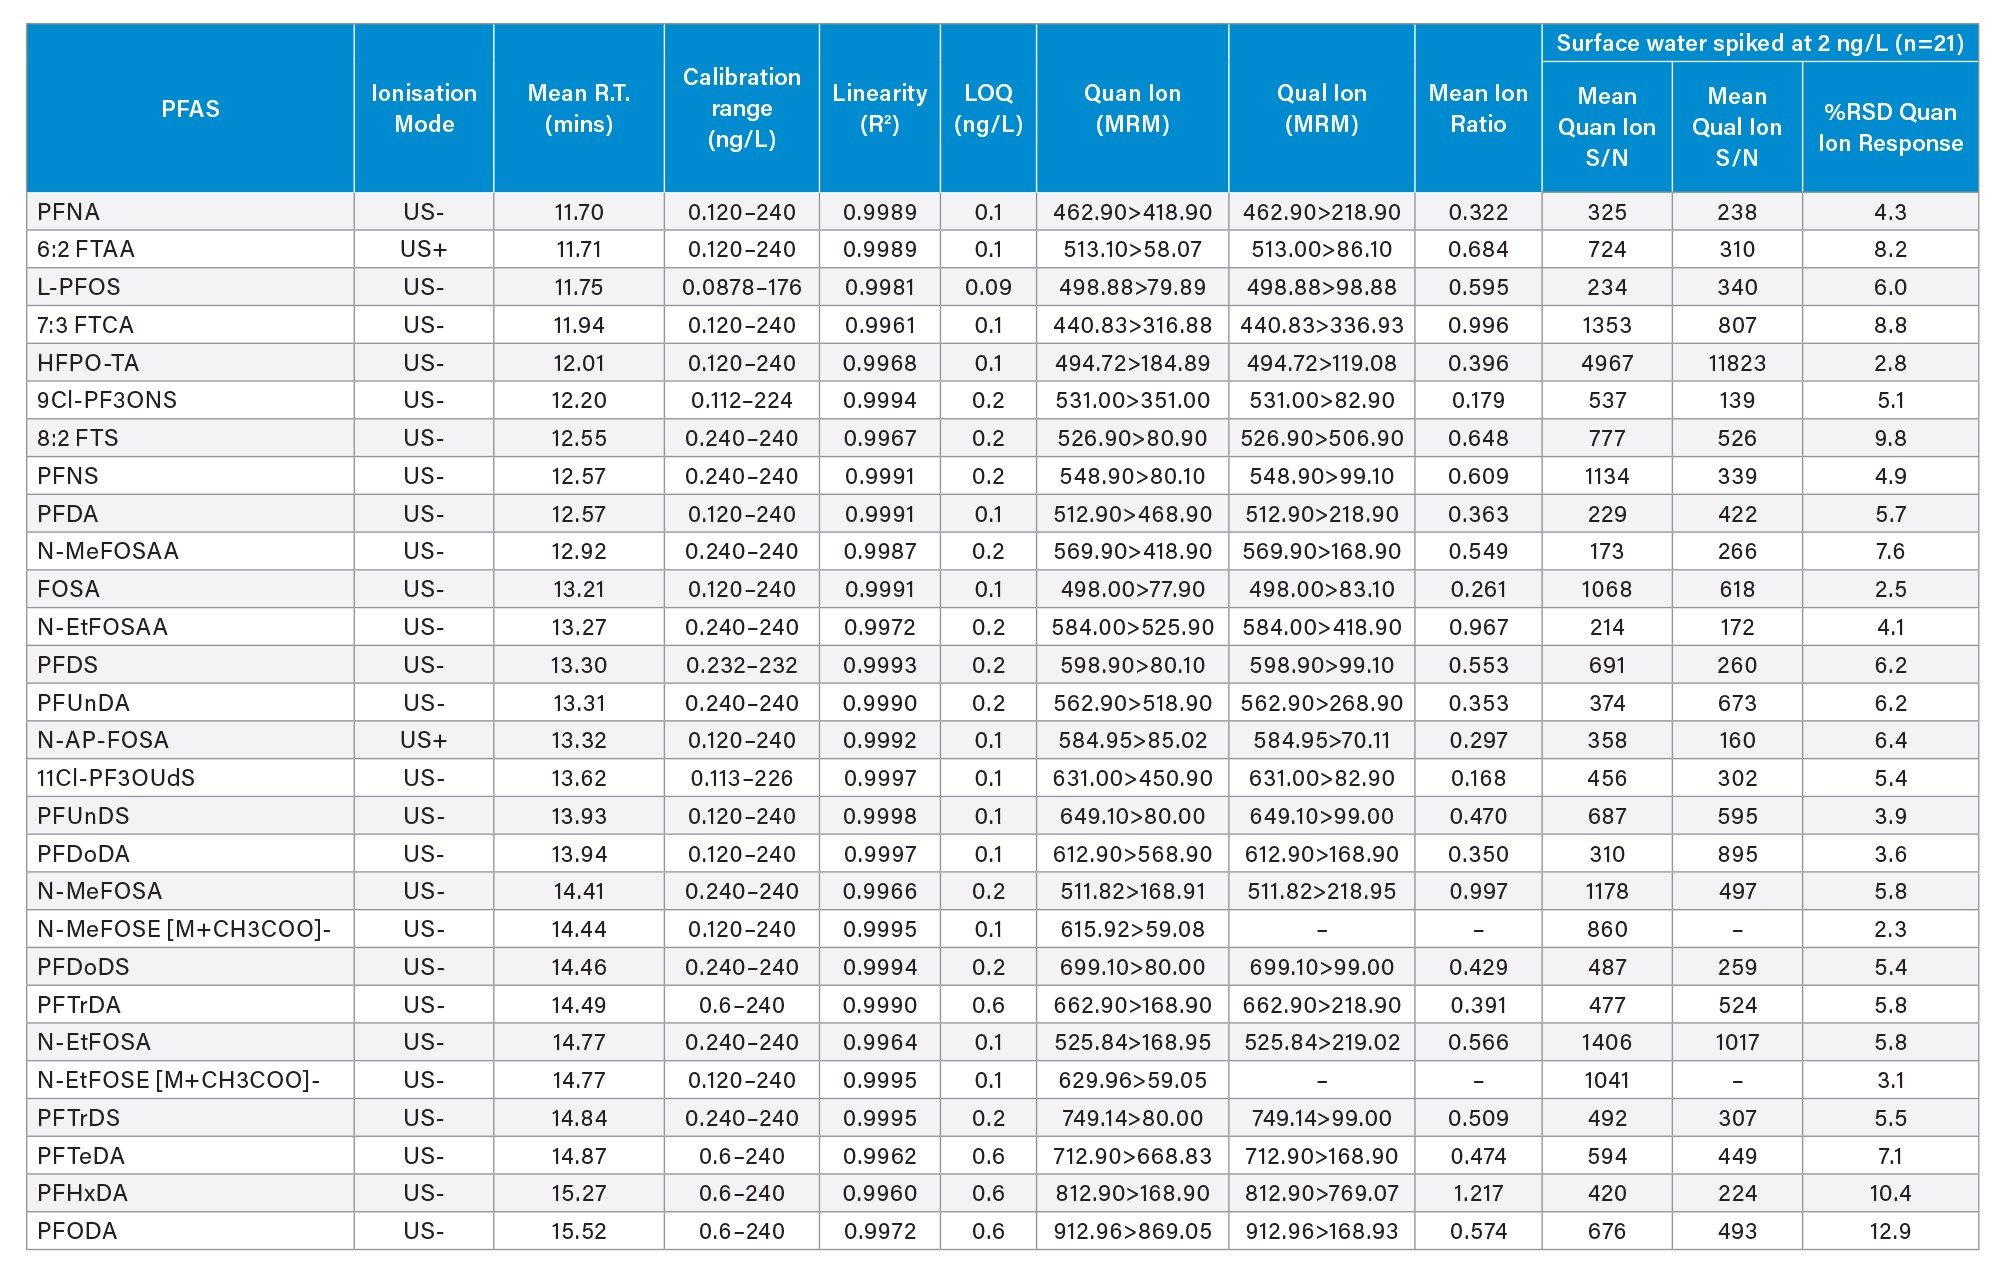
Following the initial method development and optimization phase, the following performance parameters were determined for each native PFAS: linearity (R2), linear dynamic range, sensitivity, background contamination, and carryover. Table 2 shows the performance parameters for 58 PFAS in surface water with each parameter summarized below.
Table 2(a). Method Performance Data for 58 PFAS in Surface Water.
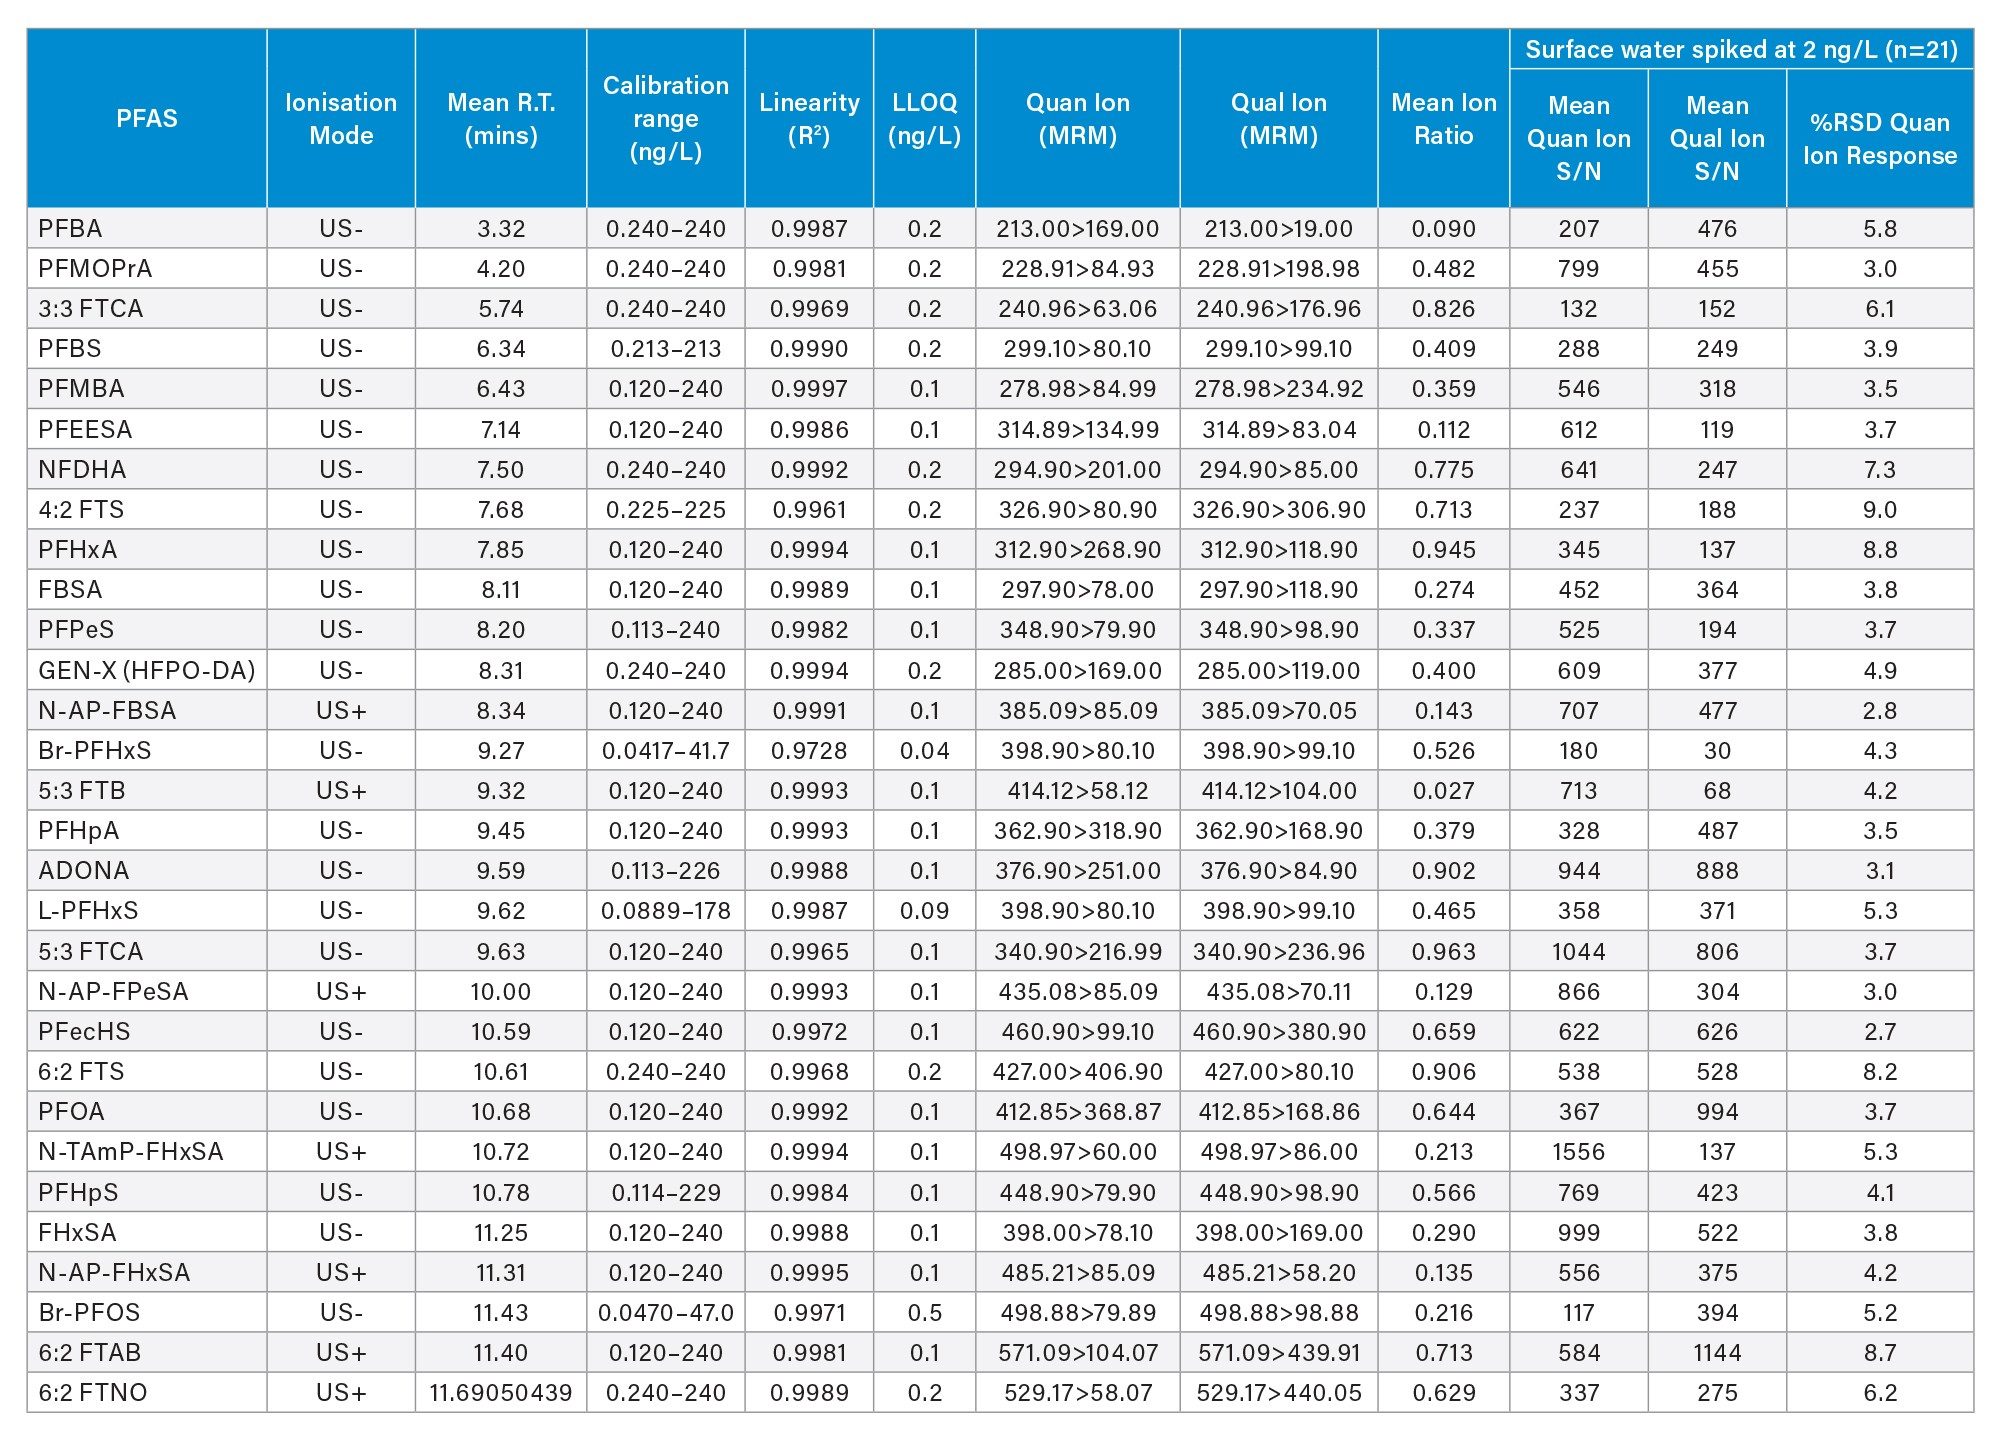
Table 2(b). Method Performance Data for 58 PFAS in Surface Water.
Sensitivity
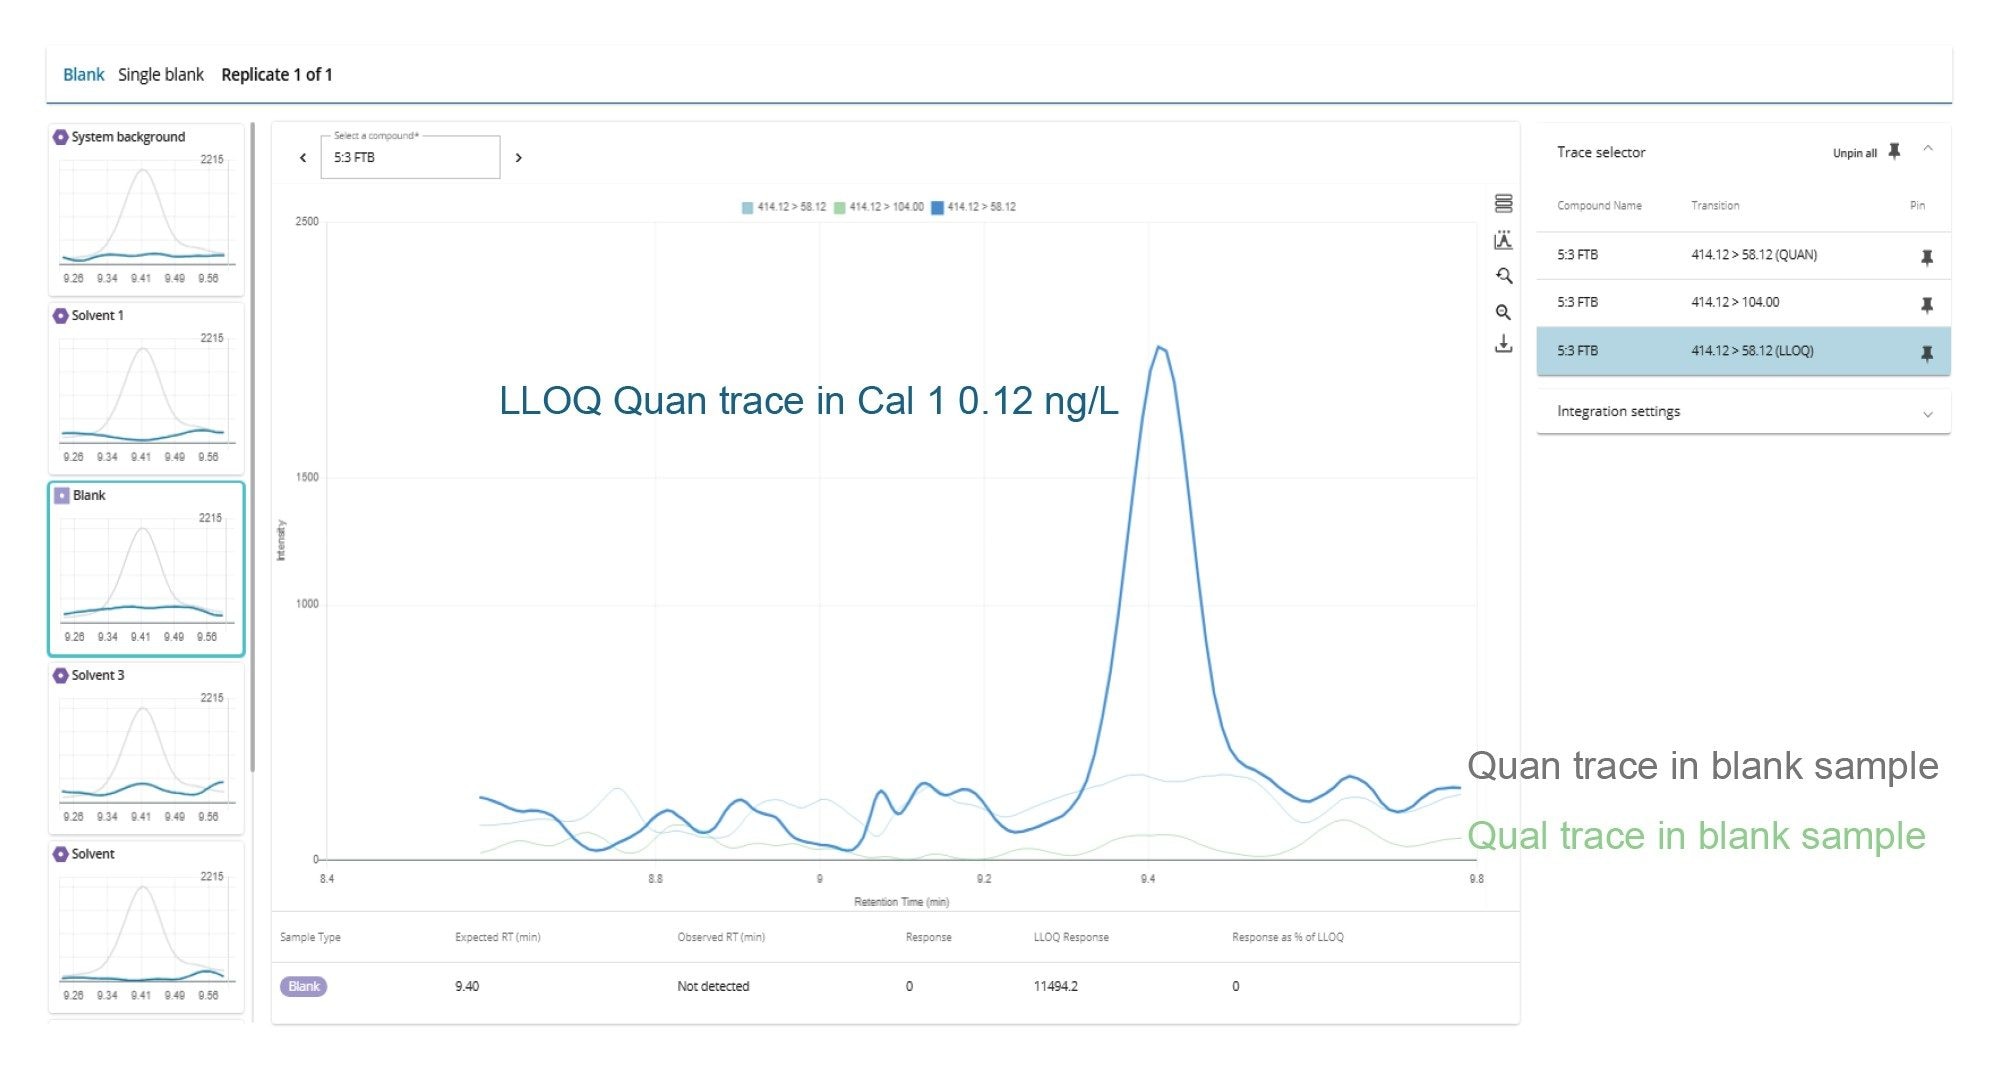
The LLOQ was defined as the lowest calibration standard where all the confirmatory criteria were achieved. The LLOQs ranged from 0.04 to 0.6 ng/L, depending on the PFAS (Table 2) outperforming the EU and U.K. regulatory requirements for drinking water. The LLOQ values are corrected for the standard purity/ salt form within waters_connect MSQuan Processing Software. Figure 2 shows an example of the LLOQ determined for 5:3 FTB (equivalent to 0.12 ng/L) in comparison to the various blank control samples included in the analysis as displayed in the MSQuan blank review tab.
Linearity
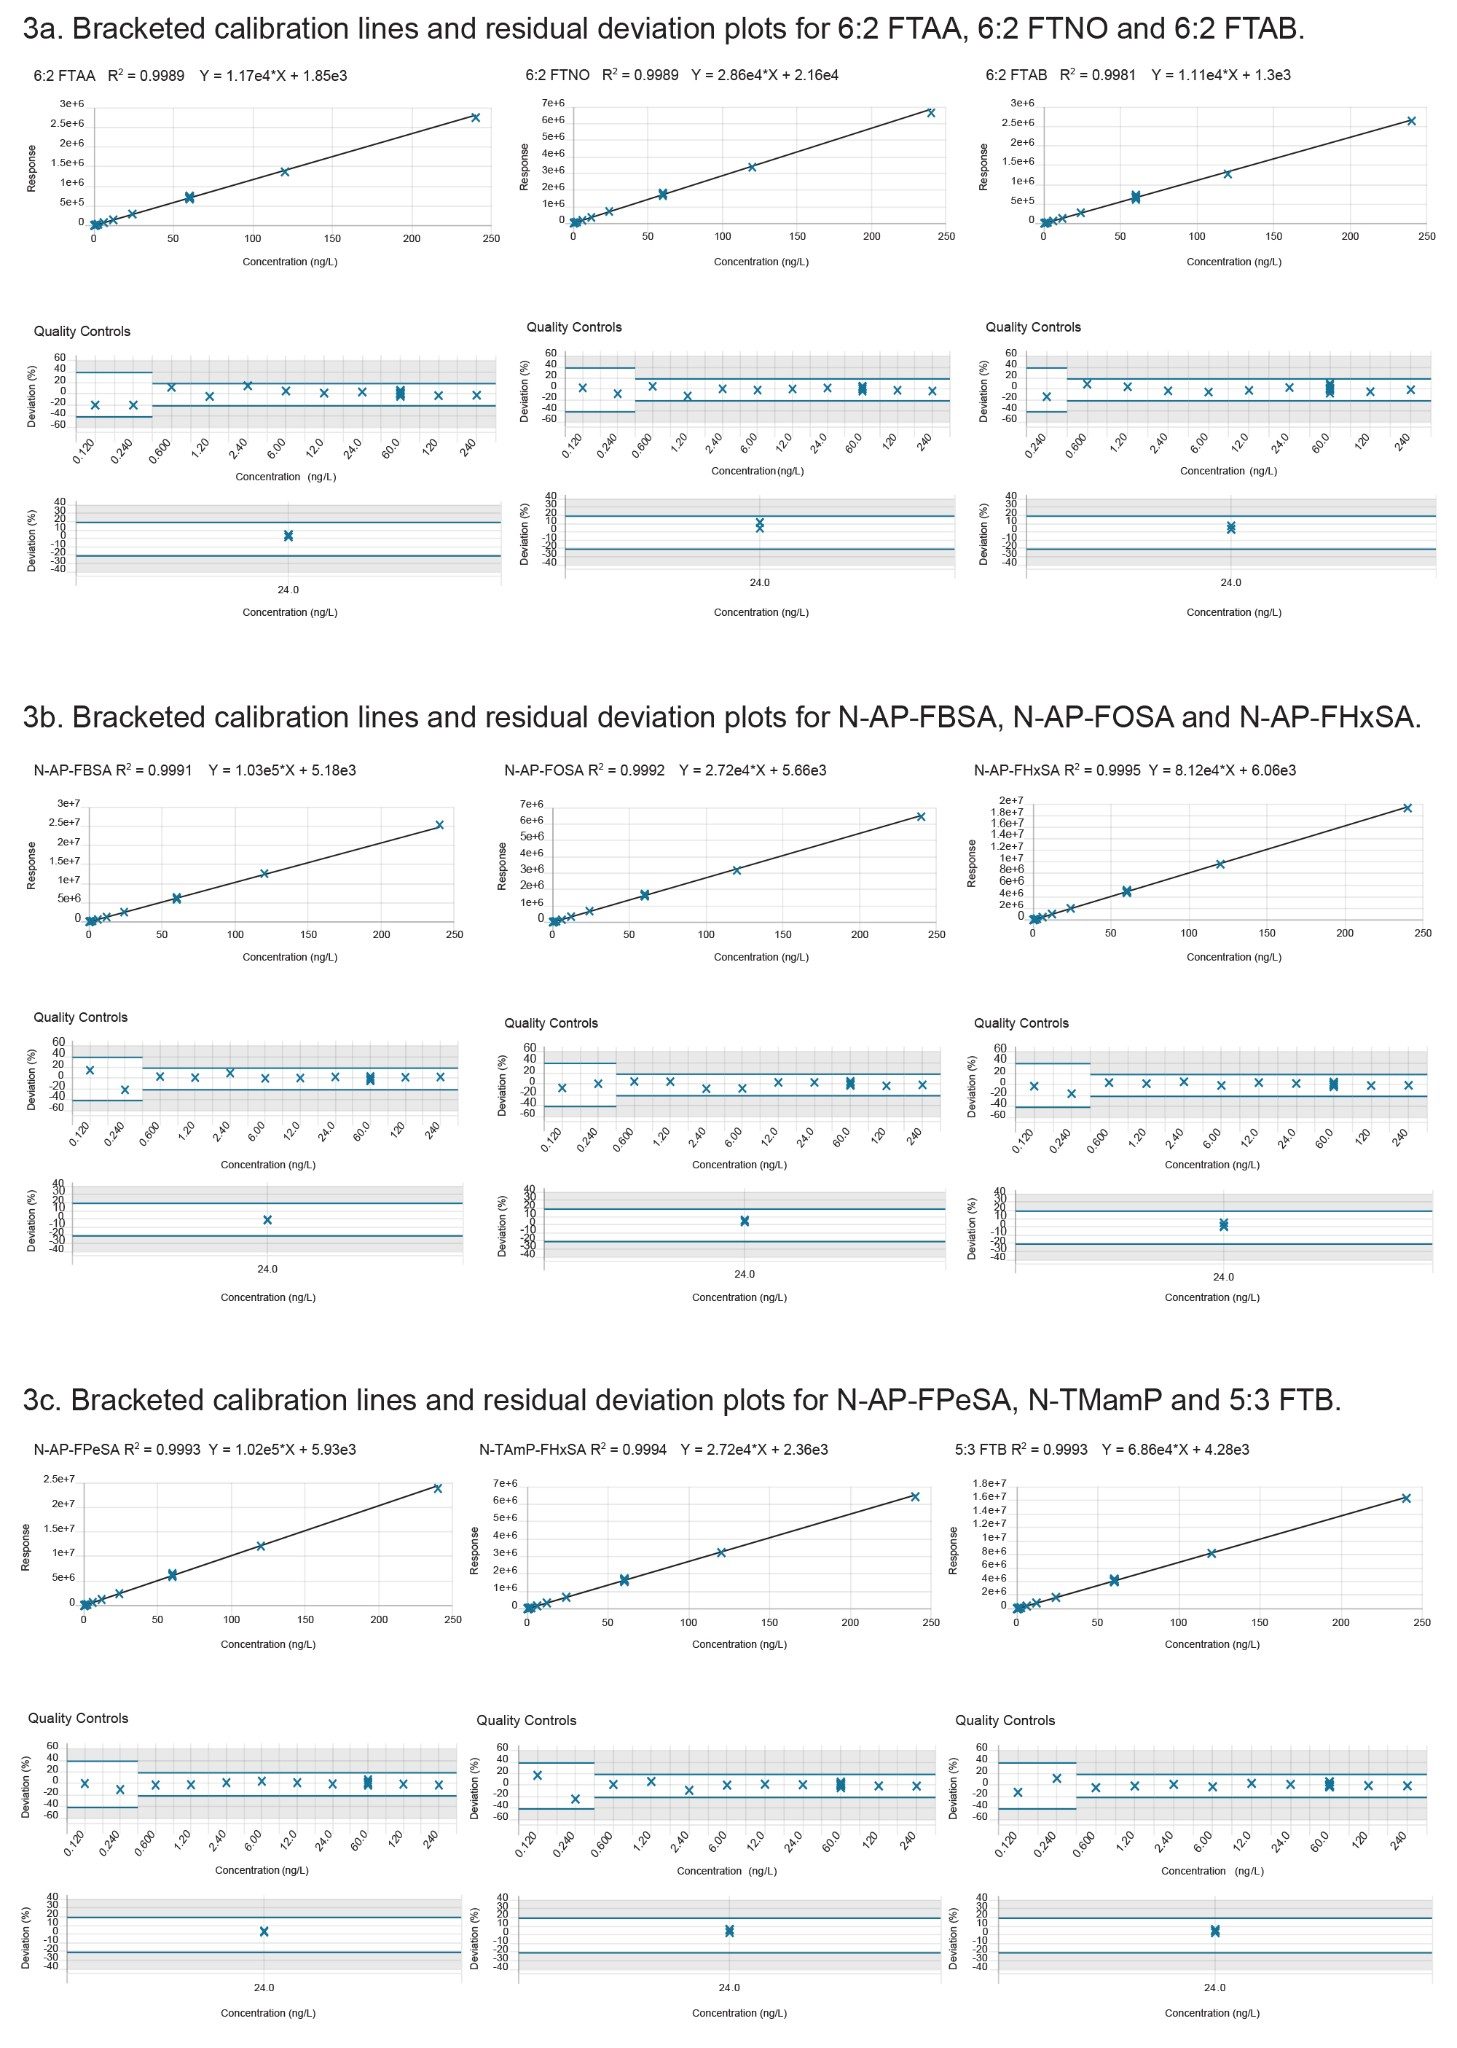
All native PFAS showed excellent linearity with R2 values exceeding a minimum of 0.996 with residual deviation within ±20 % (at calibration levels above the LLOQ) (Table 2) exceeding the performance criteria for PFAS analysis, as defined by the EURL for halogenated POPs guidance documents.15 A weighting factor of 1/X with a linear fit was used for all PFAS. A minimum of three orders of linear dynamic range (LDR) was obtained for all PFAS, with some achieving five orders of LDR (data not shown). As the concentration of PFAS can vary from sub ng/L to µg/L between samples, an extended LDR is beneficial in terms of reducing the amount of sample dilution and repeat analysis required. Figures 3 (a-c) show the bracketed calibration curves, residual deviation and QC plots (n=3) for the cationic and zwitterionic PFAS.
Carryover
One of the biggest challenges when analyzing PFAS at the sub ng/L levels required for regulatory testing, is controlling the background and carryover due to their widespread use and physiochemical properties. The carryover was assessed via calculating the concentration of any PFAS in a solvent blank immediately following an injection of the top calibration standard. The use of the FTN sample manager with HPS needle and wash solvent composition containing 25:25:25:25 (v/v) acetonitrile:methanol:water:isopropanol was found to control the system carryover with no PFAS exceeding 30% of the lowest calibration standard peak area meeting the performance criteria.15
Repeatability and Matrix Effects
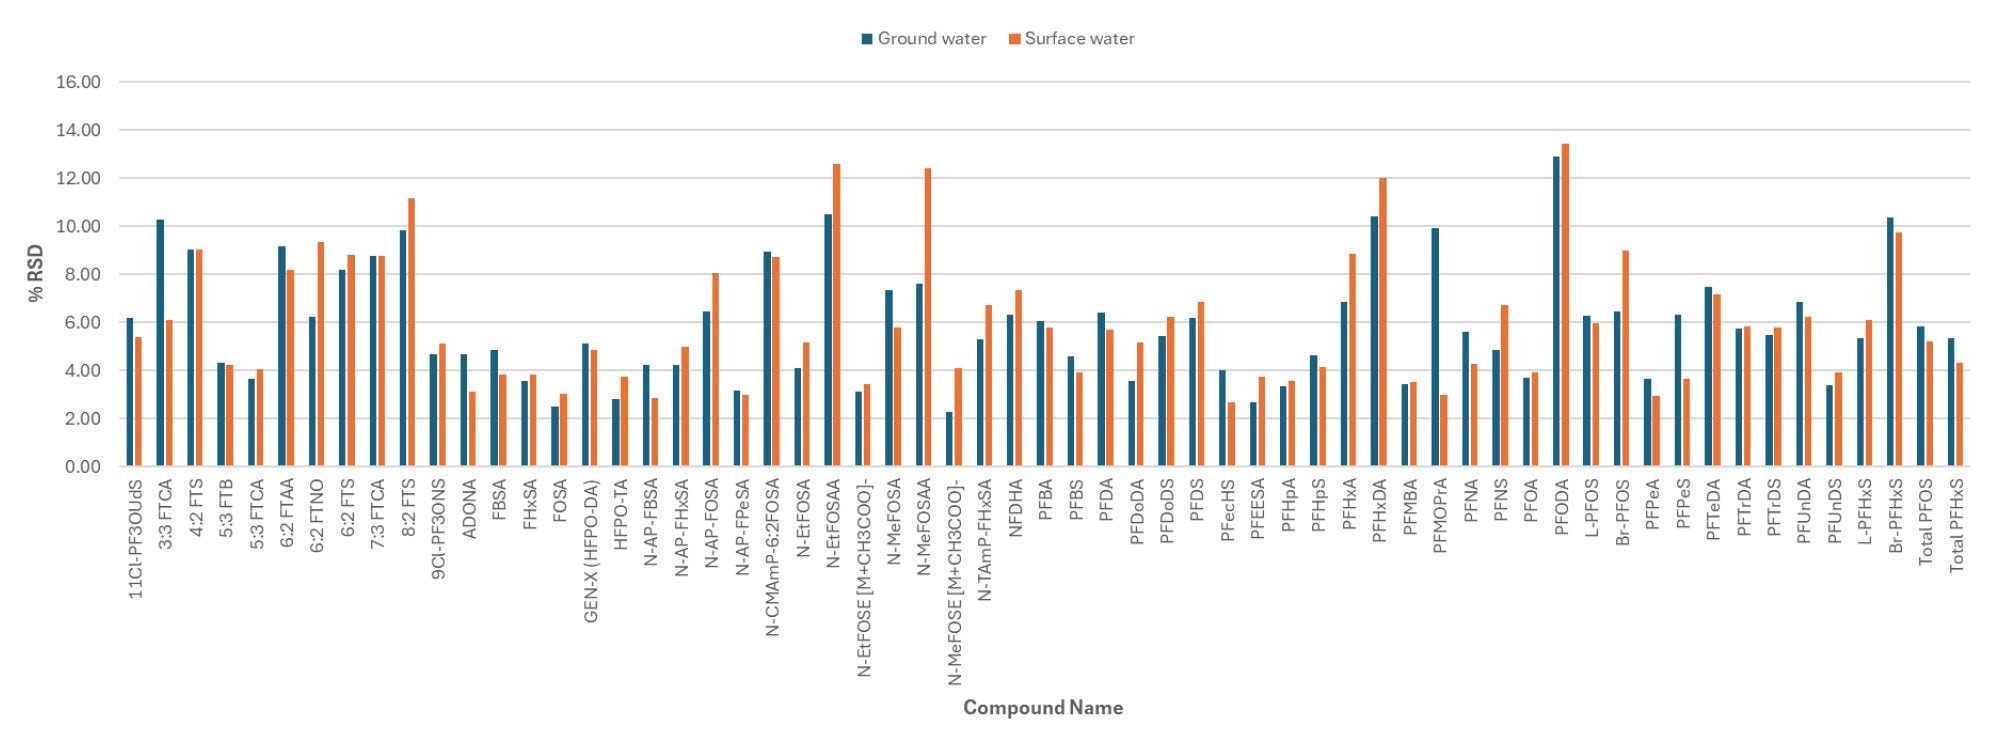
The intra-batch injection repeatability in surface and ground water samples spiked at 2 ng/L (n=21) was determined and found to be less than 14%, based on the RSD of the Quan transition peak area, for all PFAS included in the study (Figure 4). The mean signal to noise (S/N) for both the Quan and Qual transition peak areas in surface water spiked at 2 ng/L was calculated and shown to exceed 100/1 for both transitions (Tables 2a and 2b). The enhancement to the StepWave XR Ion Guide design has been shown to improve technical repeatability by reducing high mass contamination in the ion transfer region, thus minimizing the decline in peak area sometimes observed in rapid polarity switching methods during large volume direct injection methods.
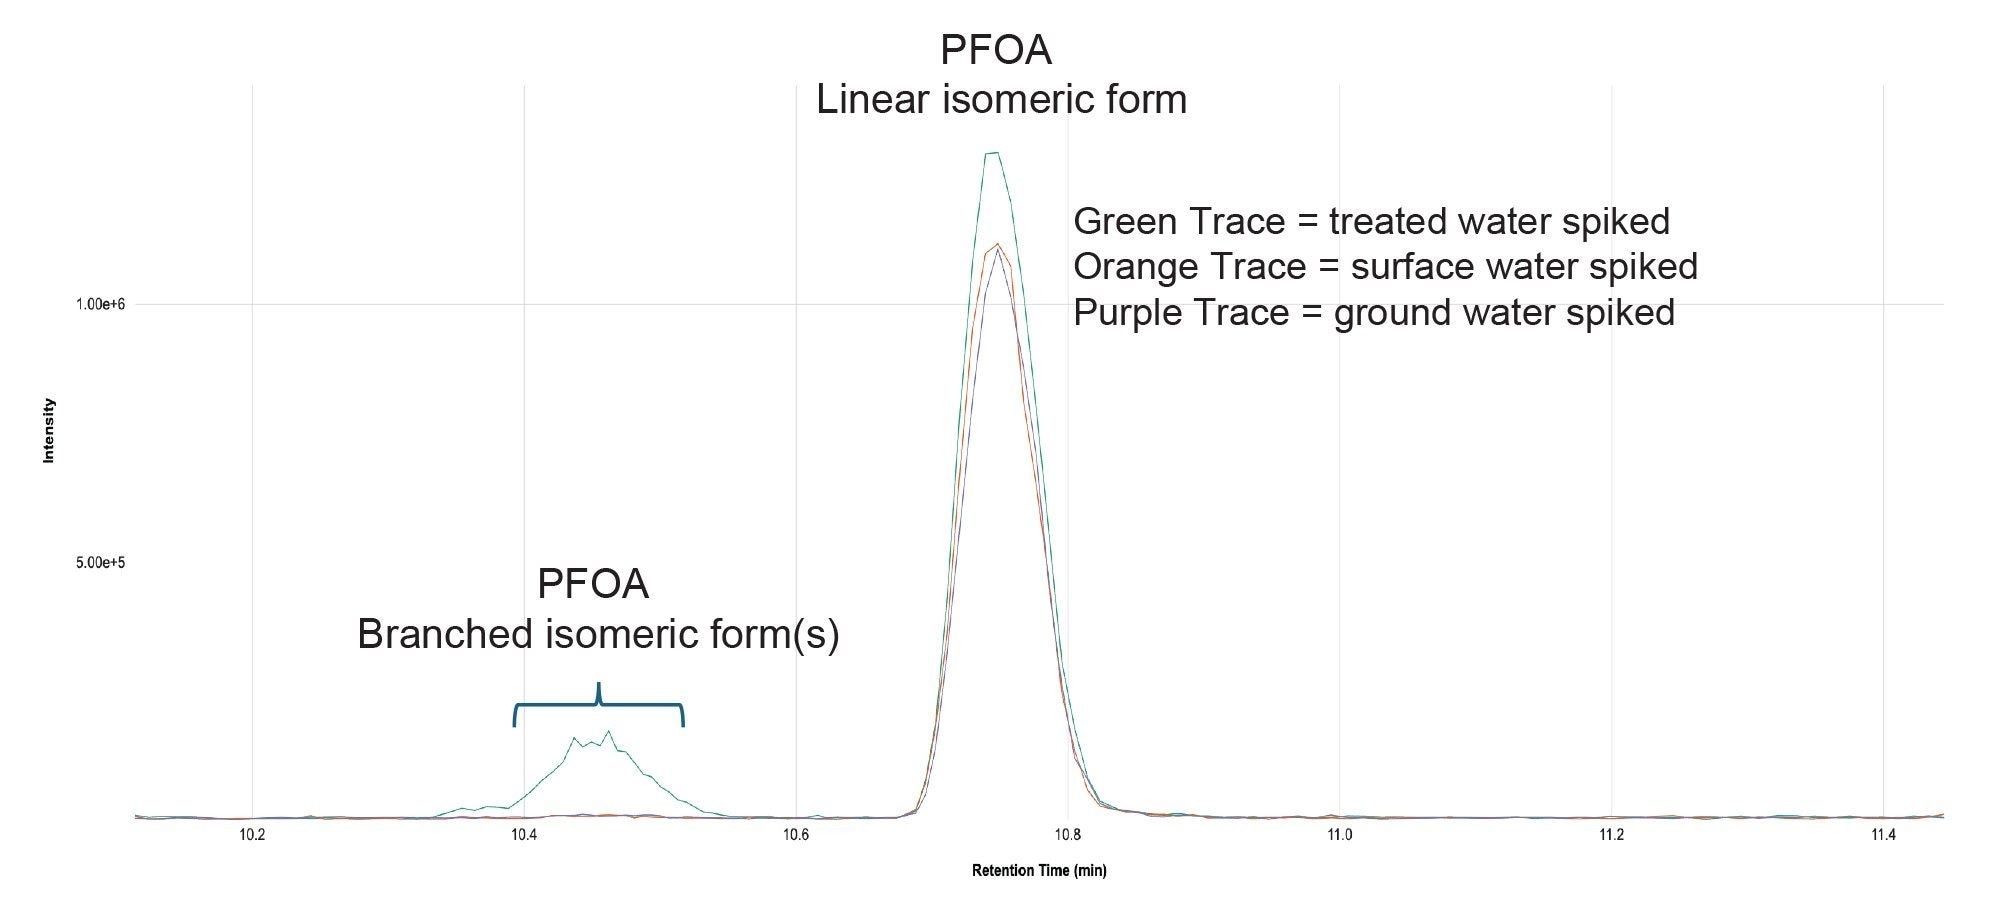
An overlay of the Quan transition MRM chromatograms for PFOA spiked into blank ground, surface and treated water samples illustrates the potential for matrix effects, circa 20% suppression in this case, when analyzing different environmental water samples in the same analytical run (Figure 5). For this reason, the use of isotopically labeled PFAS analogues as internal standards for accurate quantitation is recommended. Tools within MSQuan allow the response and retention time deviation along with the % recovery of the ILIS to be visualized across the analytical run supporting the efficiency of the review by exception workflow. At the time of writing, isotopically labeled analogues are not available for all the native PFAS included in the official watch lists. MSQuan includes a function to create a ‘composite’ internal standard, by either averaging or summing the responses of multiple ILISs to more accurately correct for the matrix effects the analyte encounters at the time of elution.
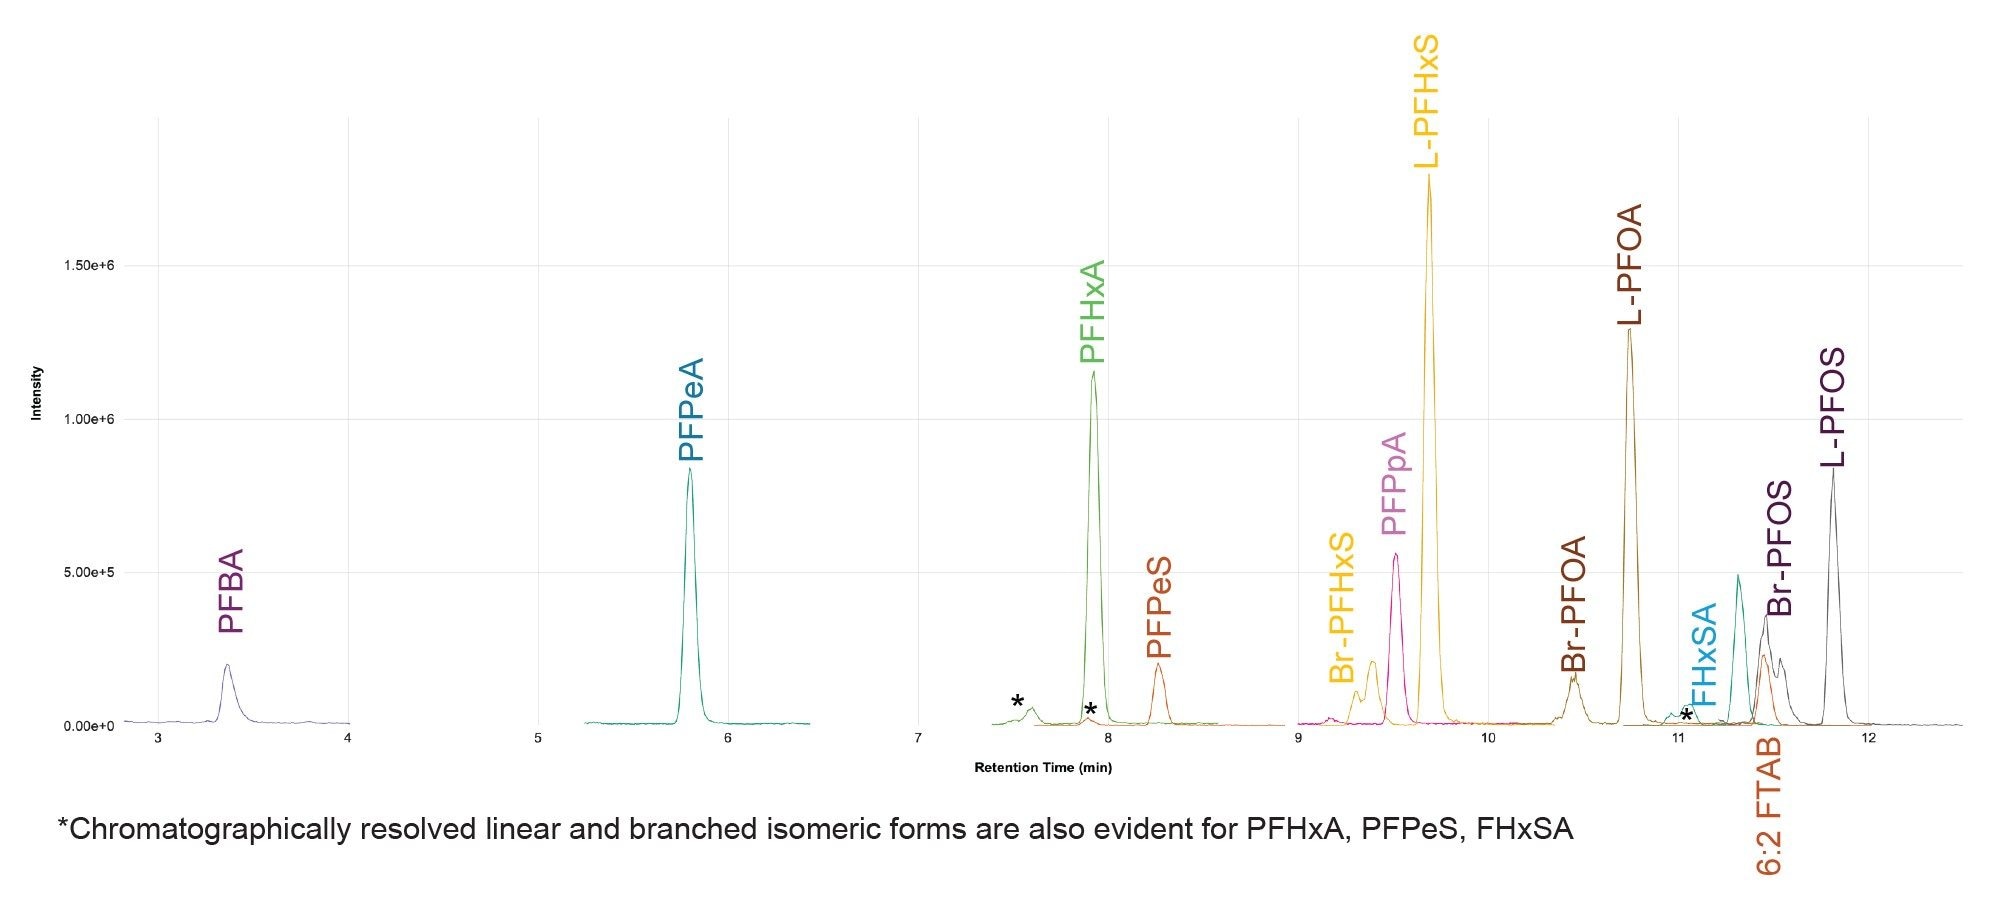
Figure 6 also shows the presence of branched isomeric form(s) of PFOA, chromatographically resolved from the linear form, being more prevalent in certain water samples. This may relate to the original PFAS production method e.g., ECF or telomerization and/or the processing treatment the sample has undergone. It has been reported that the more polar branched isomers are likely to remain in water samples whereas, linear forms adsorb to soil and sediments.17 In addition, studies have shown that linear and branched isomers have unique negative associations.17
Precision
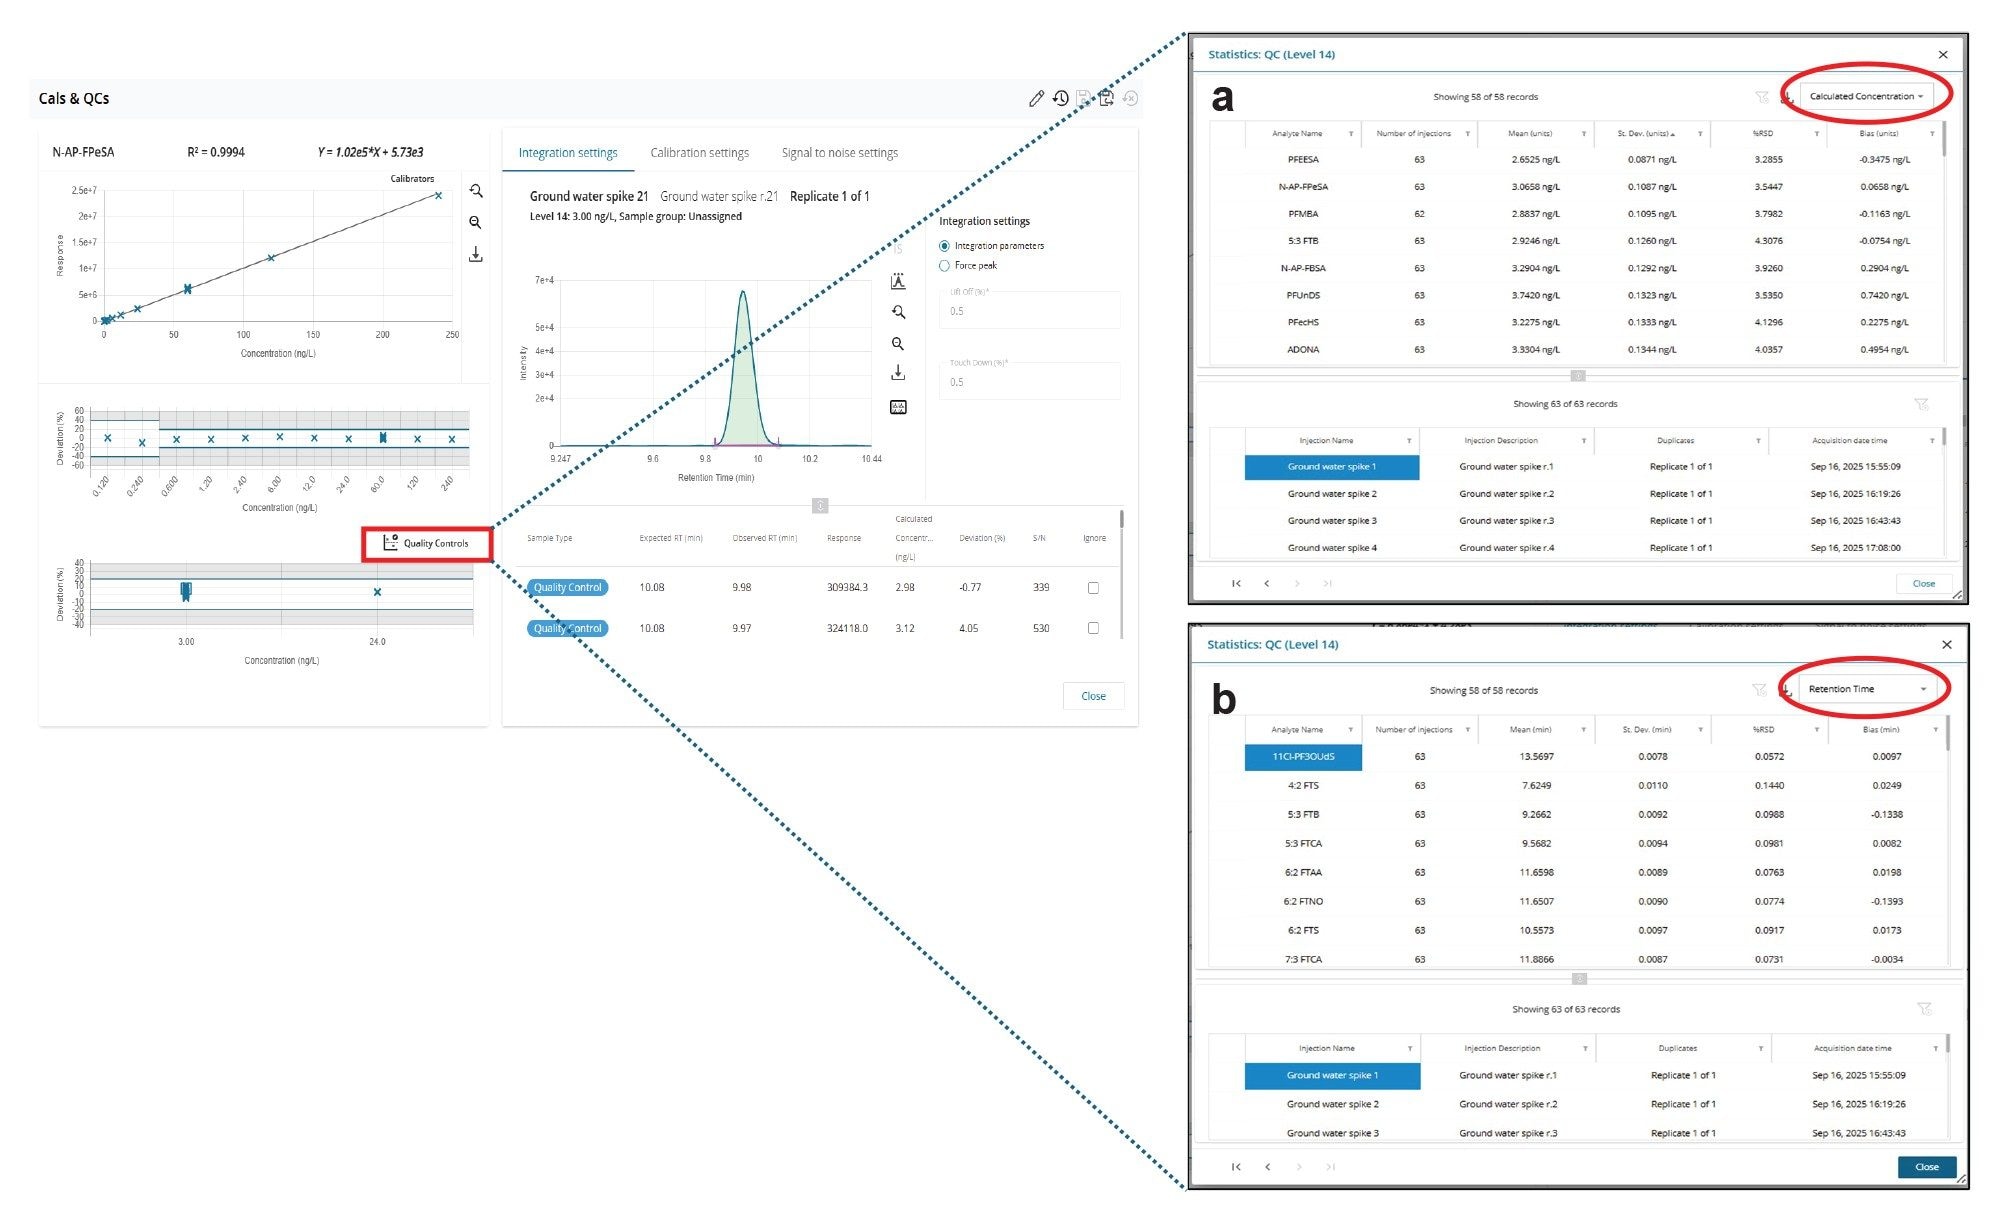
The method precision, in terms of both retention time stability and repeatability of the measurement was determined in three water types (surface, ground, and treated samples) at a concentration of 3.0 ng/L. Aliquots of the different water types were spiked in bulk and 21 replicate injections (50 µL) of each type were performed consecutively with no blank or cleaning interventions to replicate an extended analytical run in a monitoring laboratory. The QC Statistics tool in MSQuan was used to calculate the retention time and calculated concentration deviation for all PFAS across the 63 injections, in total three QC levels. This operation was performed with an icon click from the Cals & QCs tab in MSQuan (Figure 6).
For all PFAS, the % RSDs for retention time were <0.3 % and <15 % for calculated concentration deviation across the 21 injections of each of the three matrices (n=63 in total) meeting established performance criteria for PFAS analysis.15
Recovery
Due to the amphiphilic nature of PFAS, it is well known that some compounds can readily adsorb to the sides of sample collection vessels and labware. The limited solubility of the longer chain PFAS in high aqueous samples can also result in the precipitation of these analytes on storage over time.
For these reasons, the apparent recovery of the direct injection procedure was determined using a negative AQC surface water sample to mimic the sample collection to analysis steps. An aliquot of the surface water was spiked with a representative PFAS mix at 3.0 ng/L and stored in a polypropylene vessel in the fridge for 72 hours. After the 72-hour storage period, the spiked AQC sample was processed according to the procedure defined in Figure 1. A second aliquot of the surface water AQC sample was processed concurrently and spiked with the PFAS mix to give an equivalent concentration post- processing procedure. The pre- and post- spiked AQC samples were analyzed without the use of the ILIS along with surface water blanks and a matched calibration curve to calculate the apparent recovery for each PFAS.
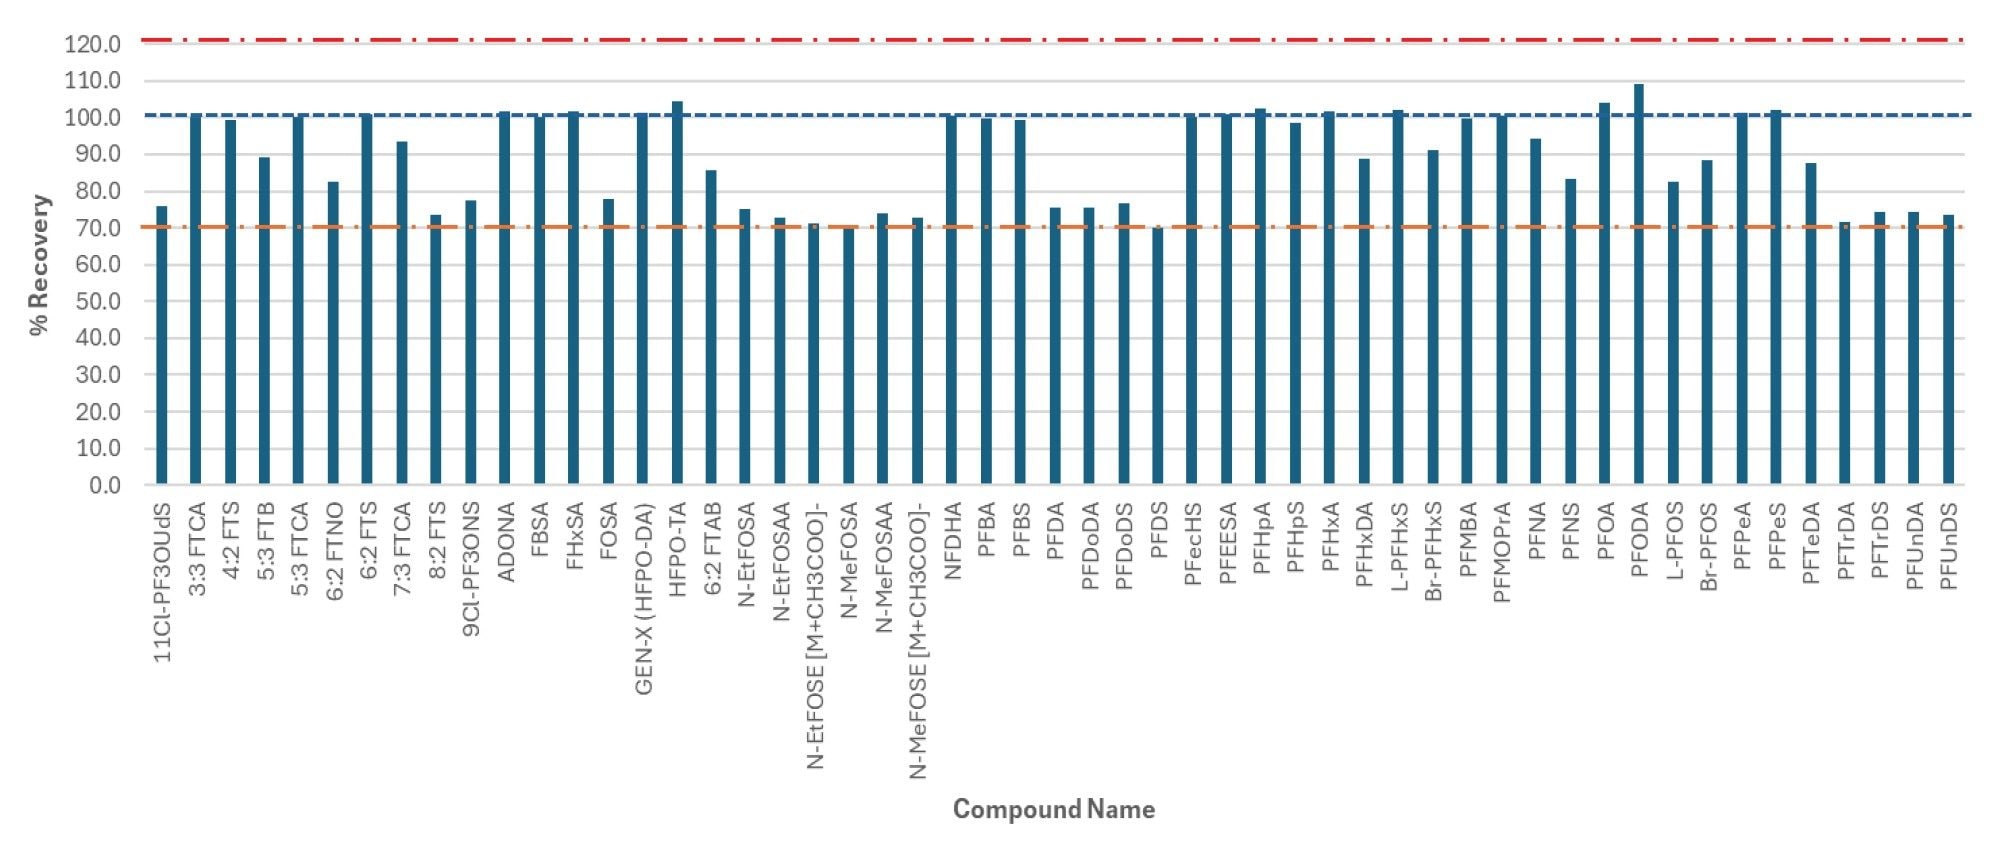
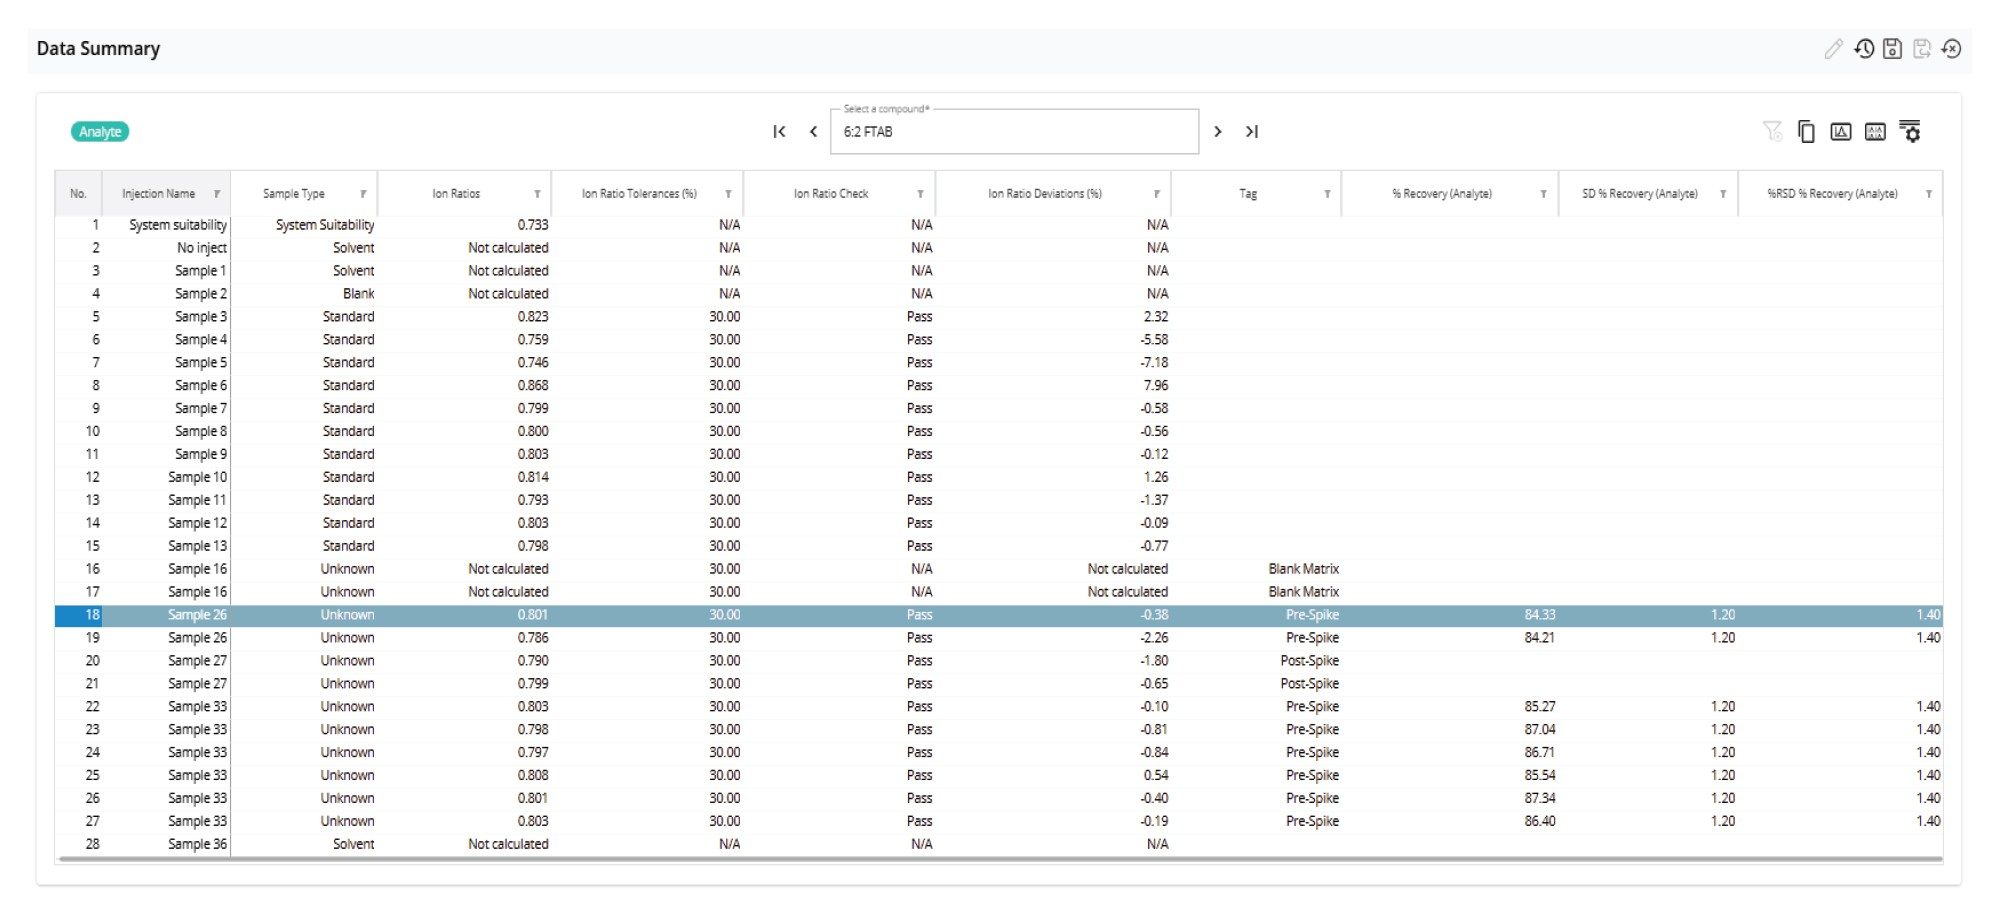
The data reporting tools in MSQuan were used to calculate the % recovery, SD % recovery and %RSD recovery along with the ion ratios for each PFAS. Figure 7 shows mean% recovery for all PFAS, and Figure 8 shows a screenshot of the Data Summary table configured to display recovery and ion ratio performance data. The Data Summary table can be configured to display a variety of information, as defined by the analyst. The mean recovery in surface water ranged from 70 to 109 % for all PFAS included in the study. As expected, the apparent recoveries obtained for the more hydrophobic and longer C-F chain PFAS were lower in comparison to the more hydrophilic, short to mid chain PFAS.
Detection of PFAS in an Unknown Wastewater Sample
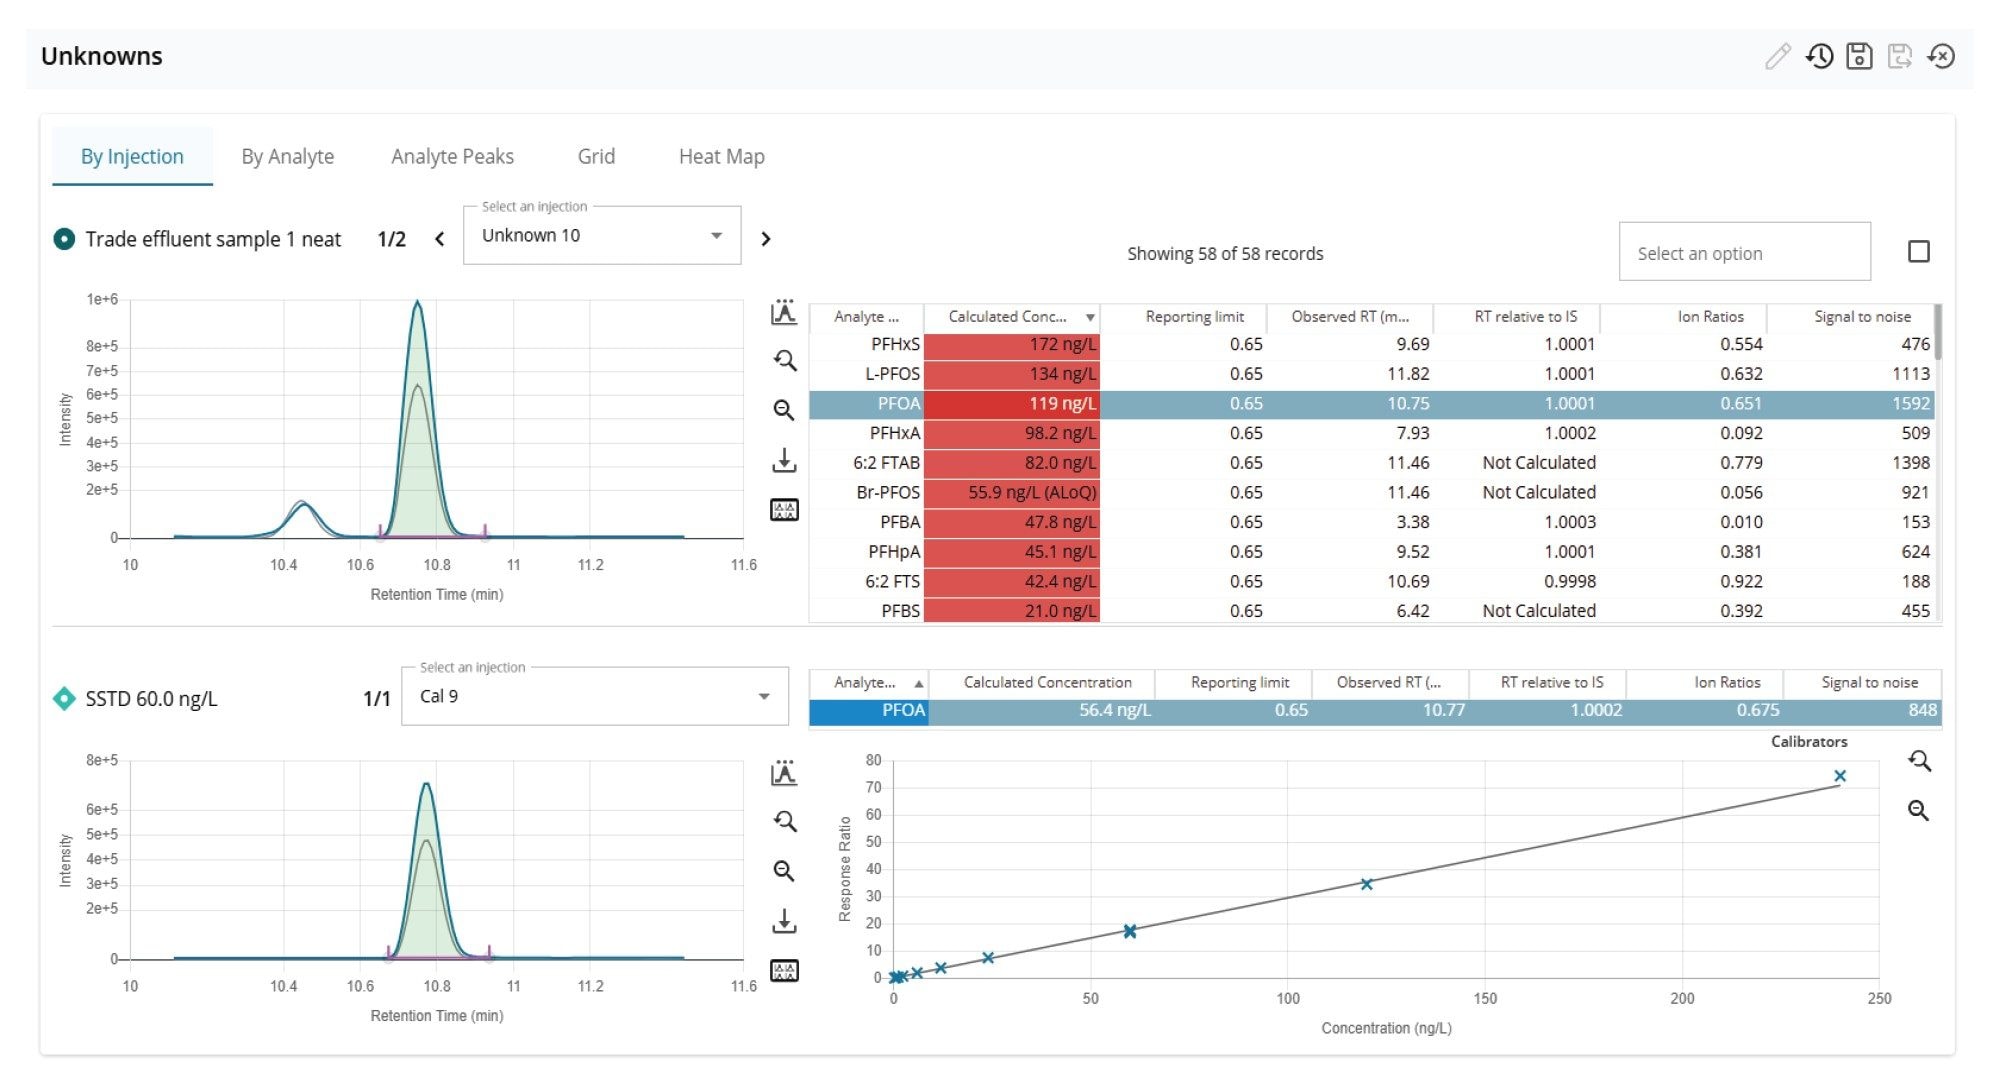
A sample of previously uncharacterized ‘trade effluent’ wastewater was analyzed in duplicate following the developed procedure. The trade effluent sample was quantified against solvent standards covering the concentration range 0.24 to 240 ng/L. A total of 16 PFAS were identified (passing the confirmatory requirements) in the wastewater exceeding the Environmental Quality Standard (EQS) reporting level of 0.65 ng/L.16 The PFAS with concentrations exceeding 20 ng/L are shown in Figure 9. The highest concentration detected was L-PFHxS at 172 ng/L, with L-PFOS at 134 ng/L and L-PFOA at 119 ng/L.
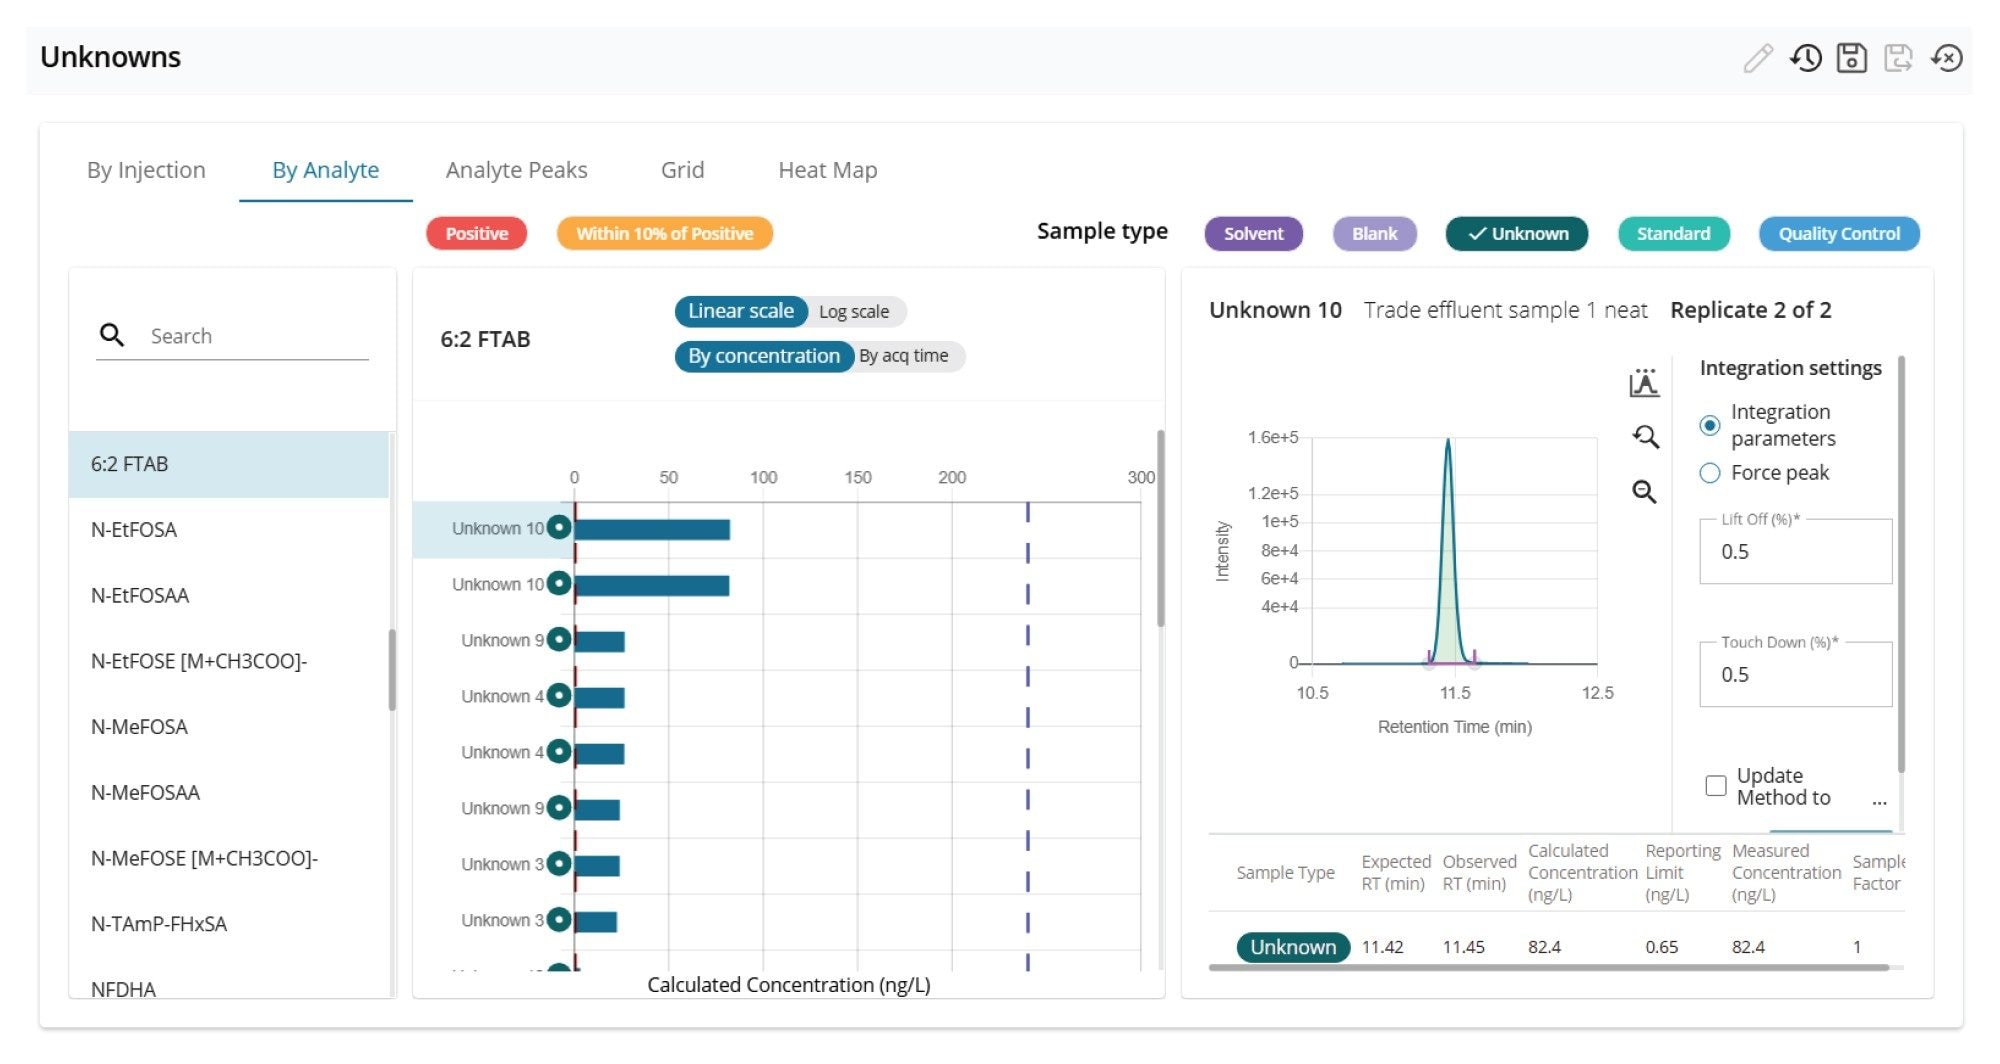
Figures 10 and 11 show the ‘Unknown’ workflow views in MSQuan. The ‘By Analyte’ view comparing the trade effluent sample (replicate 1) to a solvent standard at 120 ng/L showing retention time alignment and closely matching ion ratio for is shown in Figure 10 for PFOA. Figure 11 shows ‘By Injection’ view visualizing the concentrations of the zwitterionic PFAS, 6:2 FTAB detected in the samples (unknowns and QCs) across the batch.
The data demonstrates the potential of high concentrations of PFAS in U.K. wastewater with identifications of anionic, cationic, zwitterionic forms and degradation products. The concentrations of PFAS identified ranged from 0.975 (PFDA) to 172 ng/L (L-PFHxS). These findings reinforce the requirements to expand the scope of PFAS in targeted analytical methods to monitor the occurrence of contamination in environmental water samples. Due to the complexity of such samples and the advantages of direct injection the choice of MS system is critical in terms of adequate sensitivity, linear dynamic range and robustness to withstand 1000’s of injections of complex extract with minimal maintenance.
Conclusion
Historically, most of the research into PFAS contamination, ecotoxicity and remediation strategies has focused on the anionic forms of PFAS. More recently, increasing reports of the occurrence of cationic and zwitterionic forms, frequently originating from AFFF impact sites is driving the need to expand the scope of targeted MRM methods for quantitative analysis of PFAS in environmental water samples. Due to the chemical properties of the cationic and zwitterionic PFAS, they are found to ionize more favorably in positive polarity mode in contrast to the anionic forms where negative polarity mode predominates. UniSpray Ionization Source has previously been shown to offer unique benefits in terms of enhanced sensitivity for PFAS ionization of the labile species.1
Expanding the analytical scope to include anionic, cationic and zwitterionic forms demands the MS system to be capable of fast polarity switching speed to deliver dwell times necessary to achieve (at least) the minimum number of data points per peak for reproducible quantitative performance. Direct injection methods have become increasingly popular as they allow laboratories to maximize throughput efficiency, however, they can put strain on the analytical system in terms of maintaining optimum performance in the presence of often complex extracts injected at large volumes (> 20 µL) with minimal downtime.
Based on the findings of the validation study, it has been demonstrated that:
- The Xevo TQ Absolute XR Mass Spectrometer offers fast, robust polarity switching, capable accurate and precise quantitative performance in a range of environmental water samples following direct injection. The instrument performance was shown to be excellent in terms of linearity, repeatability, precision and robustness exceeding official performance criteria for PFAS analysis.
- The scope of the MRM method for PFAS was readily expanded to include representative cationic and zwitterionic PFAS showing the base method is ‘scalable’ allowing the analyst to add new and emerging PFAS as required for monitoring purposes and future changes to regulations.
- Analysis of a trade effluent wastewater sample revealed concentrations of both the anionic and zwitterionic PFAS exceeding 100 ng/L. 6:2 FTAB, which is a major component of AFFFs used for firefighting, was identified with a concentration of 82.2 ng/L. The occurrence of zwitterionic PFAS in environmental water confirms the need to expand the scope of targeted MRM methods.
- Sensitivity, in terms of LLOQ in surface water, is sub ng/L showing that the expanded method is suitable for checking compliance with current regulations including the EU Drinking Water Directive 2020/2184 (where applicable) and U.K. DWI guidelines.
- Due to enhancements in the StepWave XR Ion Guide, the MS system could maintain optimal performance in terms of accuracy and precision following repeated large volume (50 µL) direct injection of various environmental water sample types with no user maintenance intervention.
- The waters_connect for Quantitation Applications (AME, Sample Sub, MS ToolKit and MSQuan) were shown to significantly increase efficiency in terms of time reduction and cost savings during all aspects of method development, validation, data processing and review phases compared to MassLynx™ MS Software when performing the same tasks.
References
- Davies J, Adams S, Hird S, Organtini KL, Rosnack J. Extending PFAS coverage and sensitivity in a direct injection UPLC-MS/MS method for water matrices based on EU and UK drinking water regulations. Waters Application Note 720008137. Dec 2023.
- Li JG. Perfluorinated organic compounds: Emerging environmental pollutants with potential health risks. Chin. J. Prev. Med. 2015;49:467–469.
- Xiao F. Emerging poly- and perfluoroalkyl substances in the aquatic environment: A review of current literature. Water Research. 2017;Nov 124(1):482495.
- Place BJ, Field JA. Identification of novel fluorochemicals in aqueous film- forming foams used by the US military, Environ. Sci. Technol. 2012;46(13):7120.
- Backe WJ, Day TC, Field JA. Zwitterionic, cationic, and anionic fluorinated chemicals in aqueous film forming foam formulations and groundwater from U.S. military bases by nonaqueous large-volume injection HPLC-MS/MS, Environ. Sci. Technol. 2013;47(10): 5226–5234
- Mabury SA, D’Agostino LA. Identification of novel fluorinated surfactants in aqueous film forming foams and commercial surfactant concentrates, Environ. Sci. Technol. (2014).
- Zhang X, Fang M, Bai Z, Zong Y, Zhao S, Zhan J. Bioaccumulation, Biotransformation and Oxidative Stress of 6:2 Fluorotelomer Sulfonamidoalkyl Betaine (6:2 FTAB) in Earthworms (Eisenia fetida). Toxics;2025 (13):337.
- Gomez-Ruiz B, G´omez-Lavín S, Diban N, Boiteux V, Colin A, Dauchy X, Urtiaga A. Efficient electrochemical degradation of poly- and perfluoroalkyl substances (PFASs) from the effluents of an industrial wastewater treatment plant. Chem. Eng. J. 2017;(322):196–204.
- Gomez-Ruiz B, G´omez-Lavín S, Diban N, Boiteux V, Colin A, Dauchy X, Urtiaga A. Boron doped diamond electrooxidation of 6:2 fluorotelomers and perfluorocarboxylic acids, Application to Industrial Wastewaters Treatment. J Electroanalytical Chem. 2017;(798):51–57.
- Bruton TA, Sedlak DL. Treatment of aqueous film-forming foam by heat- activated persulfate under conditions representative of in situ chemical oxidation. Environ. Sci. Technol. 2017; 51 (23):13878–13885.
- Directive (EU) 2020/2184 of the European Parliament and of the Council of 16 December 2020 on the Quality of Water Intended for Human Consumption (recast) [Online] https://eur-lex.europa.eu/eli/dir/2020/2184/oj
- Drinking Water Inspectorate (DWI) Information Letter, Requirements for Poly and Perfluorinated Alkyl Substances (PFAS) Monitoring by Water Companies in England and Wales 05/2021 [Online] https://dwi-content.s3.eu-west-2.amazonaws.com/wp-content/uploads/2021/10/04203217/Information-Letter-PFAS-Monitoring.pdf
- Plumb R. Xevo TQ Absolute XR: Maximum Robustness and Sensitivity For High-Throughput Bioanalysis. Waters Application Note 720008821. June 2025.
- Hancock P, Adams S. Gould D. Enhanced Reliability for Long-Term PFAS Analysis with the Xevo TQ Absolute XR Mass Spectrometer. Waters Application Note 720008824. May 2025.
- EURL for Halogenated POPS. Guidance Document on Analytical Parameters for the Determination of Per- and Polyfluoroalkyl Substances (PFAS) in Food and Feed. September 2024; Version 2. https://eurl-pops.eu/user/pages/05.news/48.Guidance-Document-PFAS/Guidance%20Document%20PFAS%20V2.0%20(incl.%20Annex%20V2.0).pdf?g-66352cfe
- Directive 2008/105/EC of the European Parliament and of the Council of 16 December 2008 on environmental quality standards in the field of water policy, amending and subsequently repealing Council Directives 82/176/EEC, 83/513/EEC, 84/156/EEC, 84/491/EEC, 86/280/EEC and amending Directive 2000/60/EC of the European Parliament and of the Council [Online] Directive - 2008/105 - EN - EUR-Lex
- Schulz K, Silva MR, Klaper R. Distribution and effects of branched versus linear isomers of PFOA, PFOS, and PFHxS: A review of recent literature. Science of The Total Environment. 2020; Sep 733:139186.
720009242, February 2026