Subvisible Particles: Why Don’t I Just Filter My Biologic Samples?
Waters Corporation, United States
Published on November 07, 2025
Introduction
Filtration of a therapeutic is often cited as a key method to remove particles generated during the manufacturing process. From ultrafiltration and diafiltration (UF/DF) to tangential flow filtration (TFF), several methods are employed throughout the bioprocess to remove aggregates and other product impurities.1 While filtration removes preformed particles, including subvisible particles (SVPs), it does not account for the inherent instability of biologic samples, and thus subvisible aggregates can be generated over time even after filtration2. In addition, the expansion in the complexity of biologic therapies leads to additional challenges during the manufacturing process from purification to filtration. In some cases, filtration cannot be applied as is the case with cell-based therapies. Therefore, all biologics need to be formulated to be stable over the long term, regardless of filtration.
In this application note, we use Aura® System and backgrounded membrane imaging (BMI) to explore the effect of filtration on three different biologic formulations, two therapeutic proteins and a lipid nanoparticle (LNP) formulation. We analyze for the presence of SVPs in these three sample types immediately after filtration and sequentially over a two-week period. Here, we learned that filtration greatly reduces the original SVP content, but SVP formation continues to increase as a function of time with a rate that is sample dependent.
Experimental
Sample Composition
Two commercially available proteins, herein referred to as Protein 1 and Protein 2 were used. The LNP sample, with similar lipid composition to the Moderna® COVID-19 vaccine, contains PEG-DMG, SM- 102, cholesterol, and DSPC; at a final concentration of lipid and RNA of 0.9 mg/mL and 45 µg/mL, respectively. The LNP monomeric diameter was defined as 110 nm by dynamic light scattering. All samples were stored at 4°C prior to analysis. Samples were filtered using a 0.2 µm nylon syringe (PVDF only) filter, and the filtered sample was collected for further testing over time.
Time Points
Samples were measured for SVPs prior to filtration and immediately after filtration. The filtrate was stored at 4°C and subsequently evaluated for SVPs at 1-day, 1-week and 2-weeks post-filtration.
Measurements
The samples, four replicates per condition and 40 µL per well, were measured using BMI and analyzed using Particle Vue v4.2. SVP counts were recorded at a size greater than 2 µm.
Results and Discussion
Impact of Filtration on SVP Counts
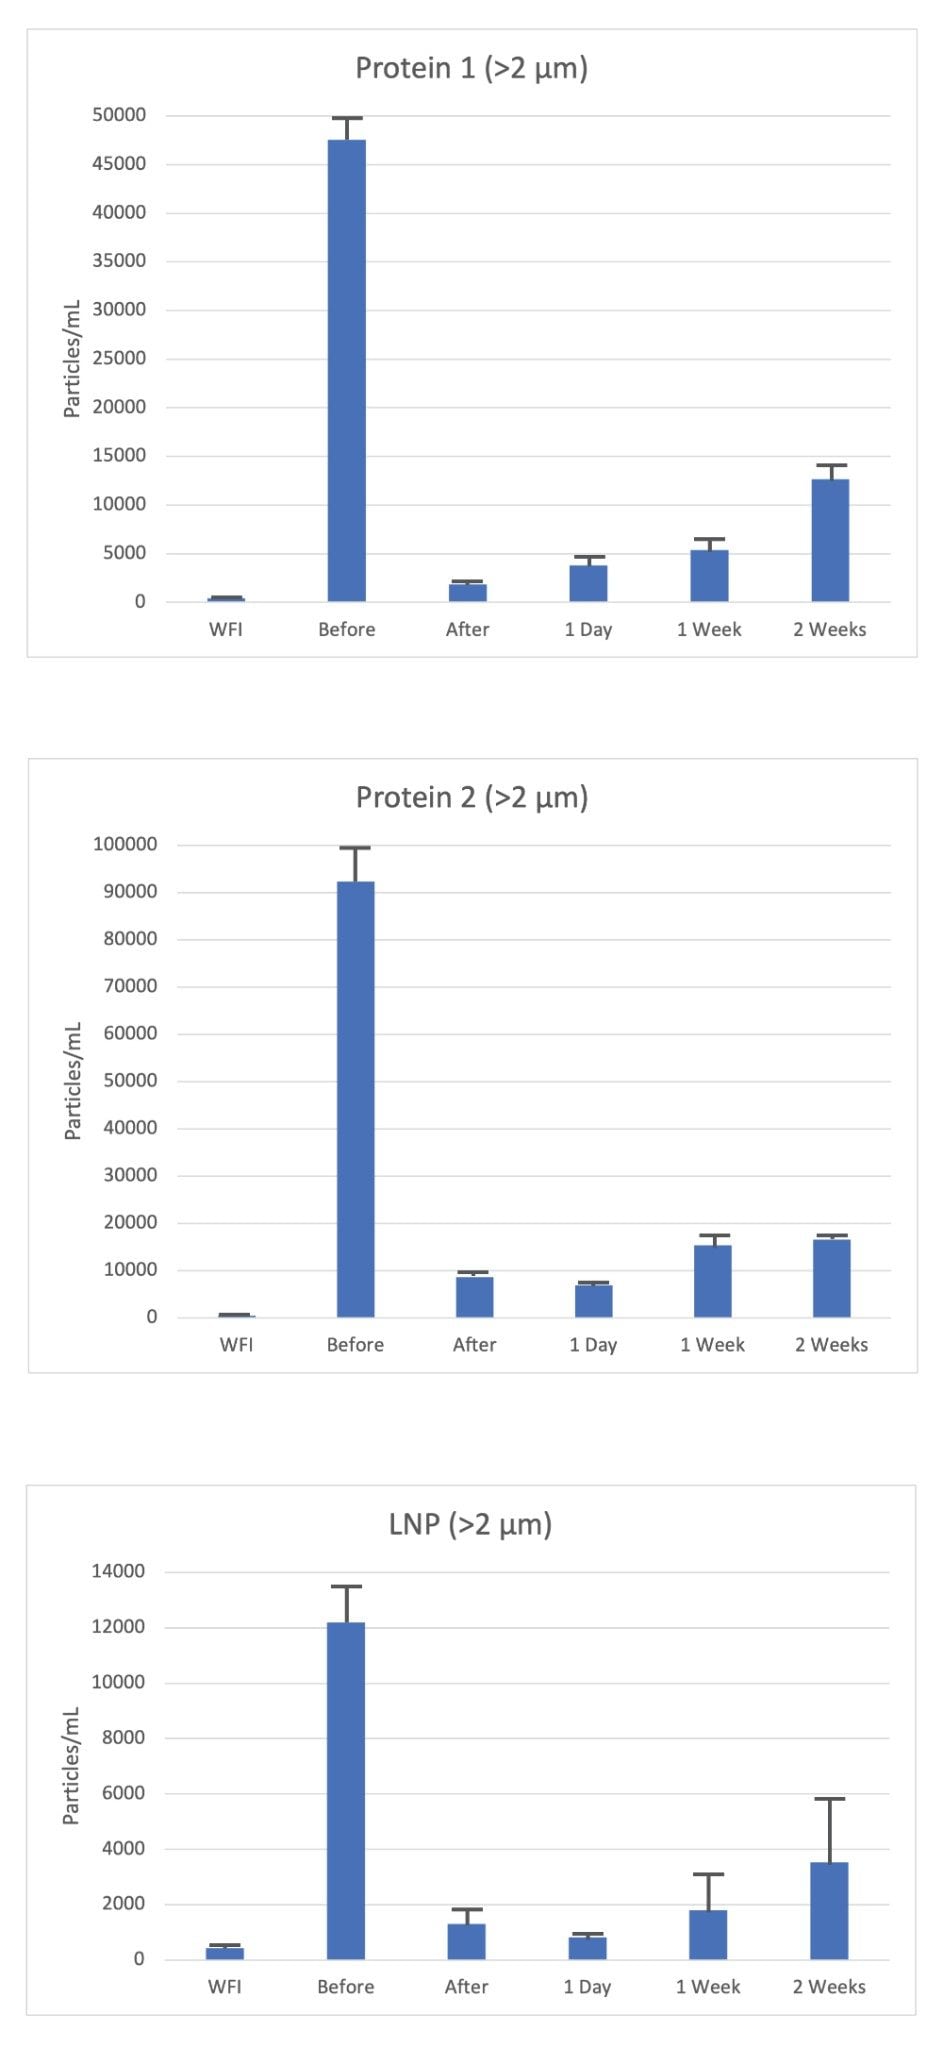
In this small study across the three different samples tested (Protein 1, Protein 2 and LNPs), a significant amount (>90%) of subvisible particles (>0.2 µm) were removed by a single round of filtration using a 0.2 µm syringe filter.
Interestingly, filtration did not remove all particles larger than the size threshold of the filter, and thus highlights the limited efficiency on SVP clearance (Figure 1a). An explanation for this includes that a single round of filtration itself is imperfect and often biologics are filtered more than once and through various methods.
Impact of Storage on SVP Counts
To evaluate the impact of storage on particle counts, each sample filtrate was stored at 4°C for the allotted time (1-day, 1-week and 2-weeks). In each case, the particle count within the filtrate increased as a function of time (Figure 1). Protein 1 filtrate demonstrated the fastest rate of increase in particle count (>2 µm) rising from 1,500 particles/mL to >10,000 particles/mL at two weeks, representing >400% increase in SVPs. Although the starting count immediately after filtration was the highest across all three samples, Protein 2 doubled in particle count over the two-week storage period suggesting the protein is more susceptible to filtration induced aggregation. Finally, the LNP sample showed a similar increase post-filtration, rising from 750 to 4,000 particles/mL for particles >2 µm over the two-week period, however the effect was less striking than that seen with the protein formulations.
From this analysis, a single round of filtration removed close to 90% of the SVP content, however a significant fraction remained, suggesting a requirement for several rounds of filtration to reach a buffer-like baseline of particles. This highlights the importance of measuring particle count post filtration under appropriate storage conditions over time. In summary, we can determine that filtration of all three different biologic formulation resulted in increasing in SVP counts over time, but with different rates of increase dependent on the biologic and formulation type.
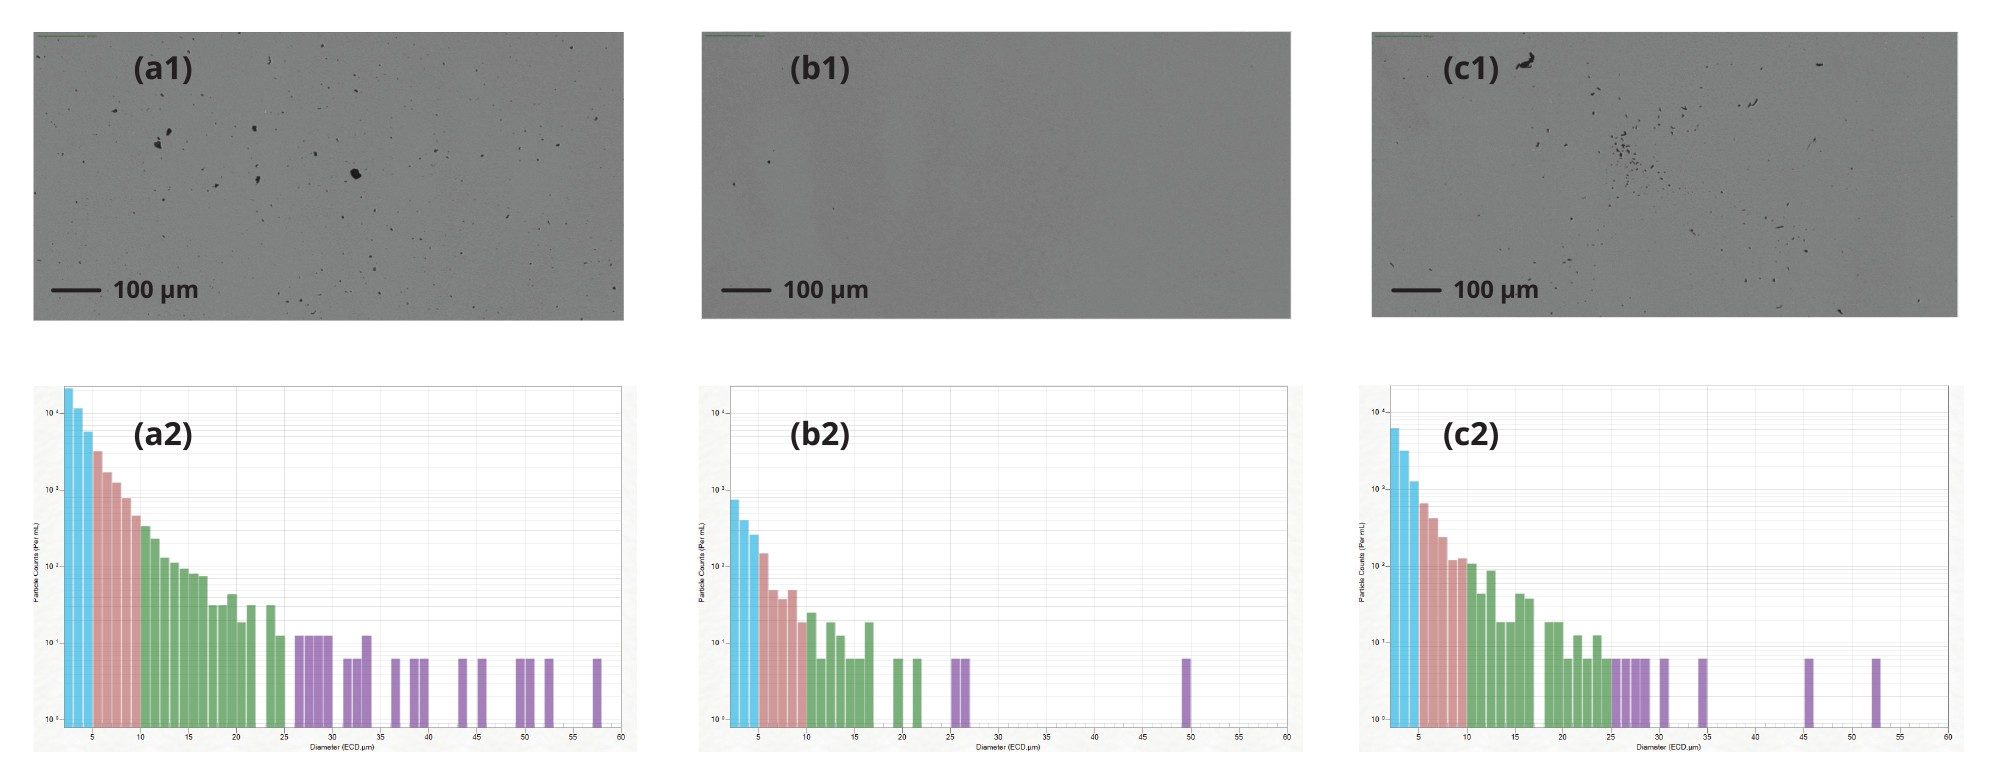
In Figure 2, we highlight the particle image and distribution of Protein 1, a) prior to filtration, b) immediately after filtration, and c) after two weeks storage at 4 °C. Prior to filtration, there is a significant number of subvisible particles, which was cleared following filtration using a 0.2 µm syringe filter with little to no particles at size range 10–25 µm and >25 µm (Figure 2b). Following two-weeks storage of the filtered formulation we observe an exponential increase in particles across all size ranges, 2–10 µm, 10–25 µm and >25 µm (Figure 2c). This corresponding rise in particulates as a function of time highlights the need to track sample stability following filtration. Aura System provides a solution to accurately and rapidly assess the generation of particles following sterile filtration.
Conclusion
Sample filtration is used as an integral part of the bioprocess to remove extraneous particles from the final drug product; however, it does not fix the inherent stability of biomolecules. Stability itself is governed by thermodynamics: time, temperature and the chemical nature of the sample and its formulation. Subvisible particles are the most important stability parameter: they highlight the presence of large physiologically relevant aggregates with the capacity to affect both safety and efficacy of any final drug product. What we have shown is that cleaning the final product using filtration doesn’t result in a stable particle-free sample risking drug efficacy and patient safety. Applying Aura System in your workflow enables rapid long-term stability assessment via a low volume, high throughput assay.
References
- Zydney, A.L., 2021. New developments in membranes for bioprocessing–A review. Journal of Membrane Science, 620:118804.
- Saggu, M., et al., 2021. Extended characterization and impact of visible fatty acid particles-a case study with a mAb product. Journal of Pharmaceutical Sciences, 110(3): 1093–1102.
720009113, October 2025