See What’s Really in Your Formulation with Backgrounded Membrane Imaging
Waters Corporation, United States
Published on November 06, 2025
This is an Application Brief and does not contain a detailed Experimental section.
Experiments in this application brief were performed on the HORIZON® system, an earlier generation of Waters BMI technology. The Aura™ platform now replaces HORIZON as the current standard for BMI, offering improved image resolution and more accurate quantitative particle analysis.
Introduction
Protein aggregation in therapeutic protein products can induce adverse immunogenic responses in patients1–4. Per the FDA’s recommendations, “strategies to minimize aggregate formation should be developed as early as feasible in product development”5 and “an assessment should be made of the range and levels of subvisible particles (2–10 µm) present in therapeutic protein products initially and over the course of the shelf life”.5 Yet, accurate subvisible protein aggregation analysis has remained elusive to protein drug formulators since current subvisible analyzers are not sensitive enough to measure protein aggregates effectively.
In this application note, we explore how backgrounded membrane imaging (BMI), a high refractive index contrast technique used by the HORIZON particle analysis system, performs highly sensitive measurements of subvisible protein aggregates in the 2 µm–4 mm size range, enabling 30% higher reproducibility compared to flow imaging.
Results and Discussion
Increased Refractive Index Contrast for Improved Measurement Sensitivity
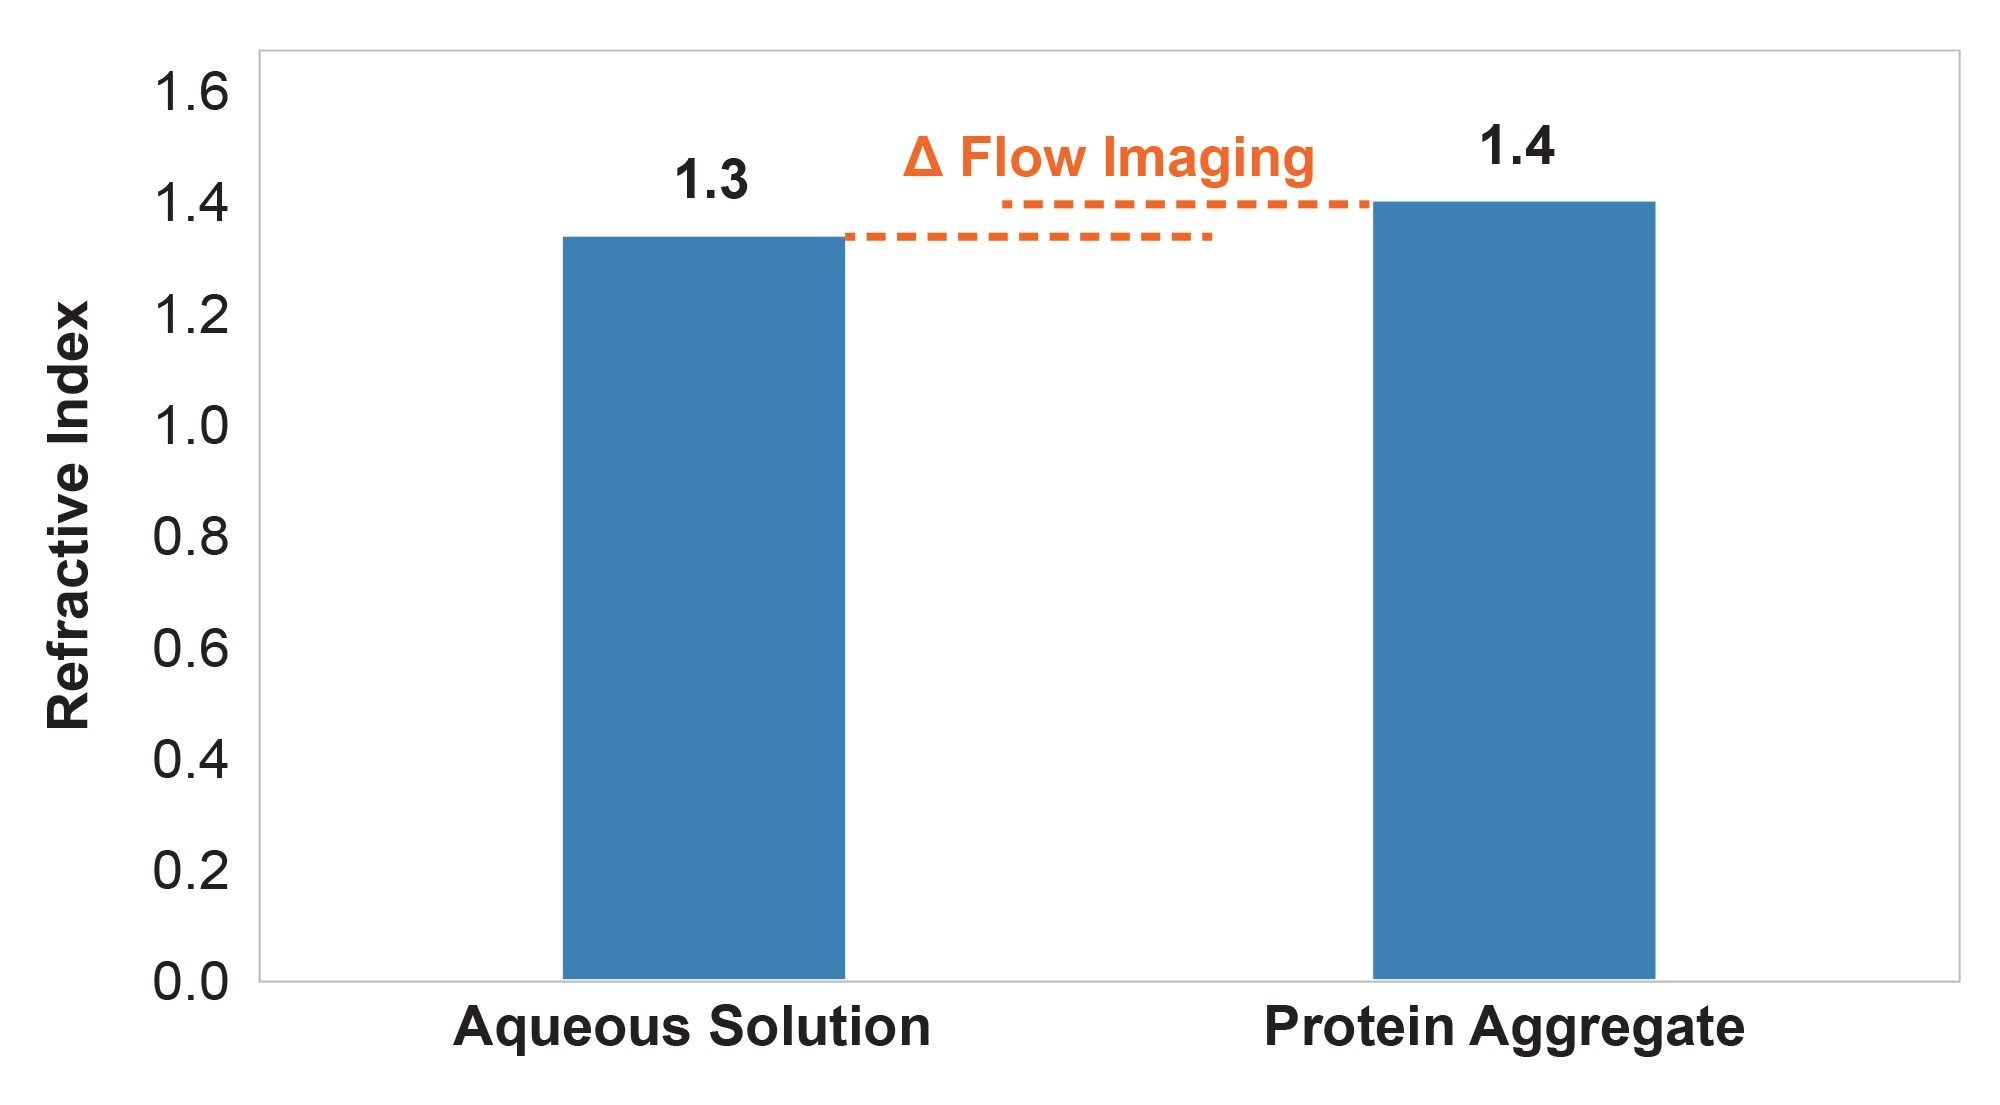
Refractive index contrast (Δn) plays a key role in how accurately protein aggregates are measured by a particle analysis system. Protein aggregates can have a significant water content and therefore a refractive index (n) that very closely resembles that of water (Figure 1).6–8
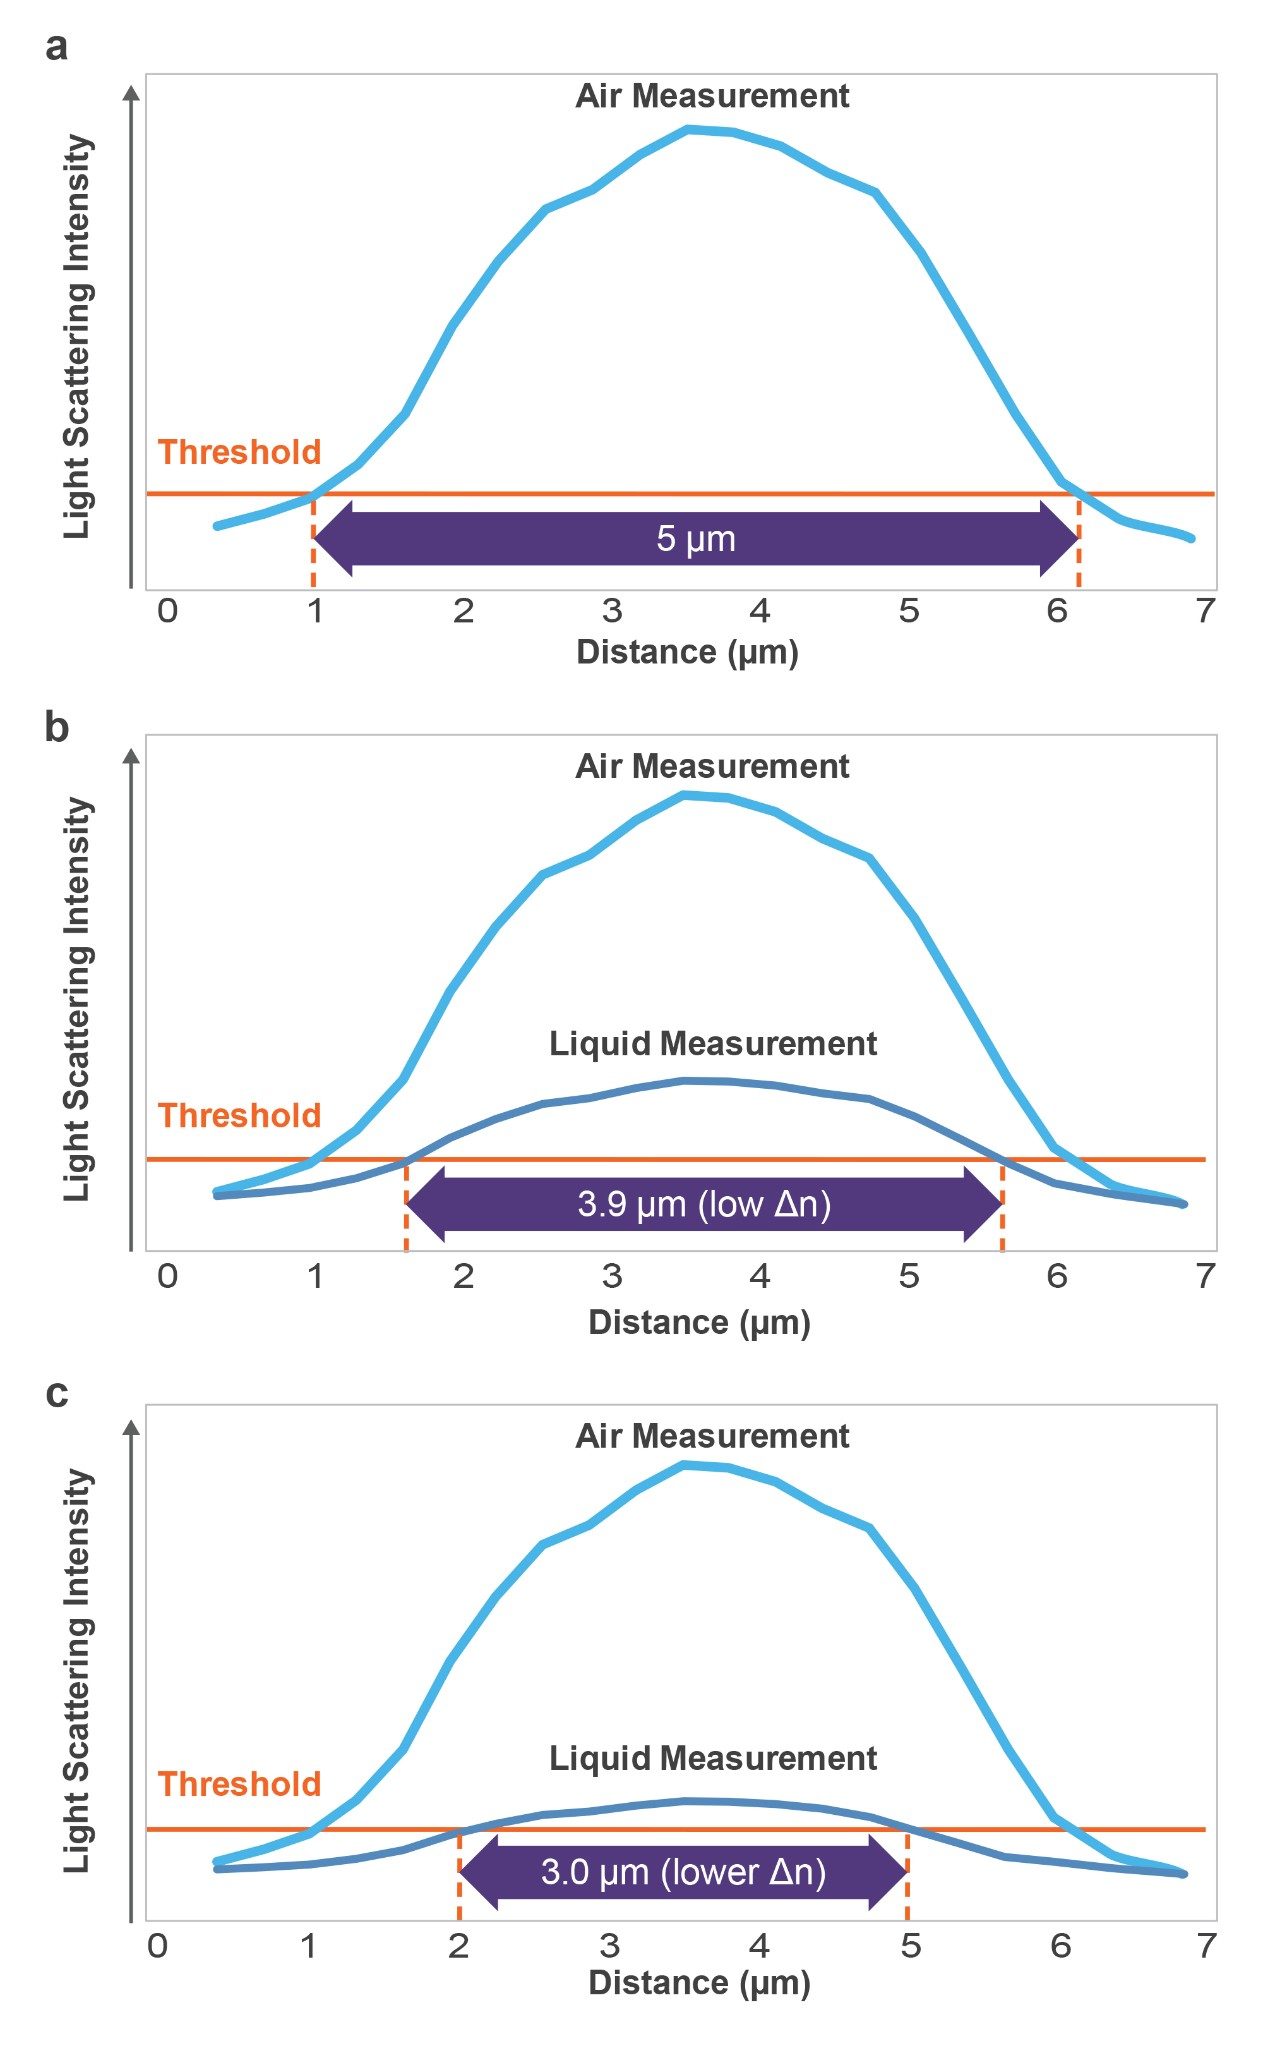
This is a basic optical limitation of translucent particles, which are difficult to analyze using fluidics-based particle analyzers like flow imagers (FI) and light obscurators (LO) due to poor image and poor signal contrast. It is now well established that a low Δn causes FI and LO systems to dramatically undercount and undersize subvisible protein aggregates7,9 to the point that some of these particles are essentially invisible to these techniques.8,10 This is because all image analysis systems work on intensity thresholding (essentially establishing the contrast) that determines where a particle edge begins and where it ends (Figure 2). If measured in air (high refractive index contrast) particles are properly thresholded and sized. But as the refractive index contrast between the particles and the solution decreases, the particles will appear smaller and dimmer, as shown in Figures 2 b,c.
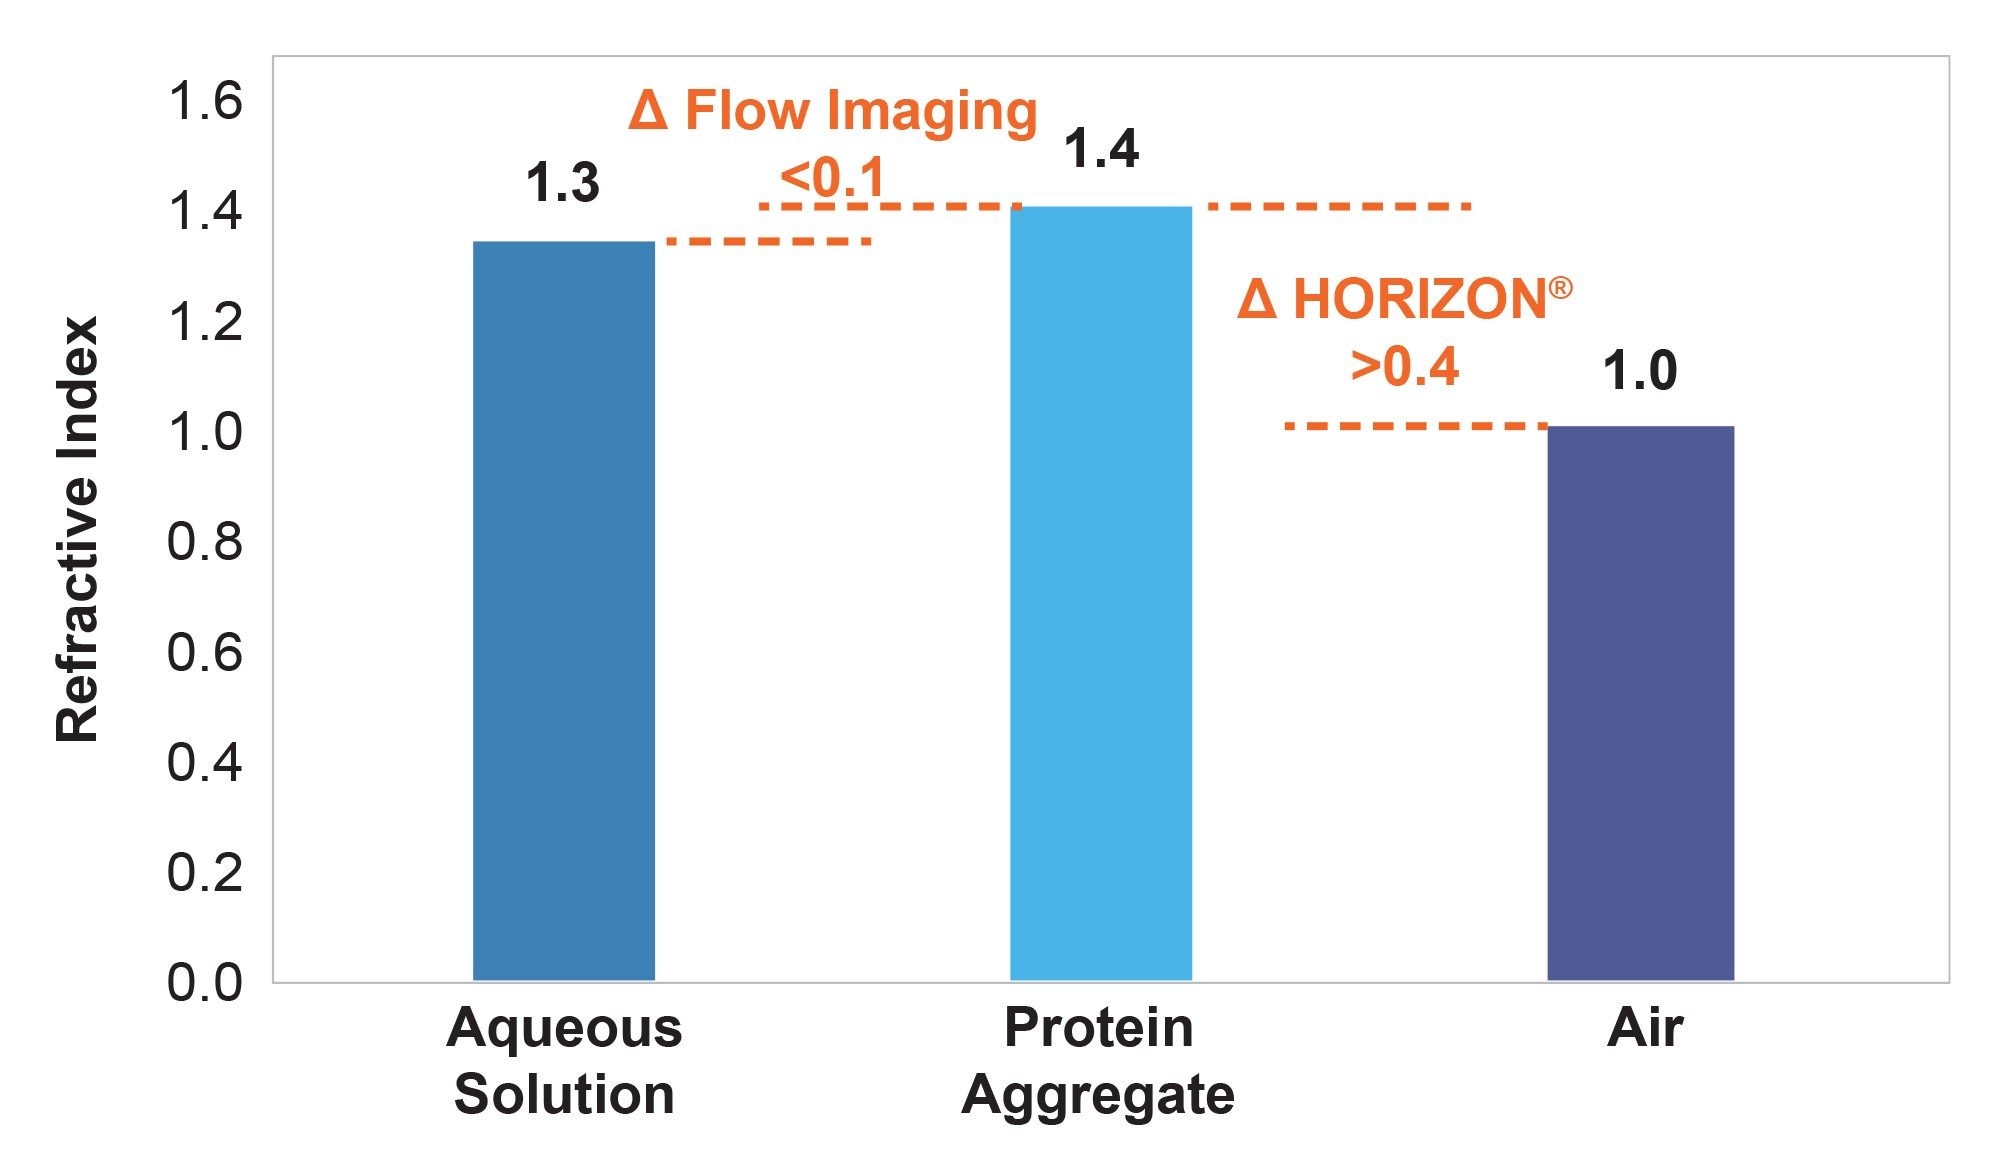
To add to the difficulty of using fluidics-based systems, excipients commonly used to decrease aggregate formation, like sucrose and polysorbate, can increase the refractive index of a formulation10, further reducing an already small Δn to negatively impact protein aggregate counts and size distribution. To overcome the basic optical limitations of fluidic-based subvisible particle analyzers, Waters developed BMI, the technique that powers the HORIZON® system. BMI enables high contrast measurements by measuring subvisible particles in air instead of aqueous solution, significantly increasing the refractive index contrast for improved count accuracy and particle size determination (Figure 3).
Here, we compare the particle counting sensitivity of the HORIZON® instrument with flow imagers via two studies. The first investigates the impact of particle refractive index by looking at protein aggregate count accuracy across a wide particle concentration range in a pharmaceutical solution. The second investigates the impact of solution refractive index by looking at subvisible particle counting accuracy in the presence of a common excipient at varying concentrations.
Study 1 — Understanding the Impact of Protein Aggregate Refractive Index
IgG Protein Aggregate Study
IgG protein aggregates were made using an alternative stir-agitation method based on Kiese et. al.11 and Mahler et. al.12 Briefly, anti-streptavidin IgG1 was dialyzed using 10 kDa MWCO Spectra/Por 7 tubing (Spectrum Laboratories). A concentration of 1 mg/mL was prepared with distilled, deionized water Milli-Q (Millipore) in 20 mM acetic acid (Fisher) adjusted to pH 5.0. The solution was stirred at 650 rpm for 24 hrs at room temperature.
The Stir Agitated protein aggregates were then serially diluted three-fold into filtered phosphate buffered saline (PBS). Each sample was run on both a HORIZON® system (N=4 wells at 50 µL per well) and a flow imager (N=3 at 100 µL measured per sample). For each 100 µL measured in the flow imager, an additional 200 µL was needed to purge the flow cell.
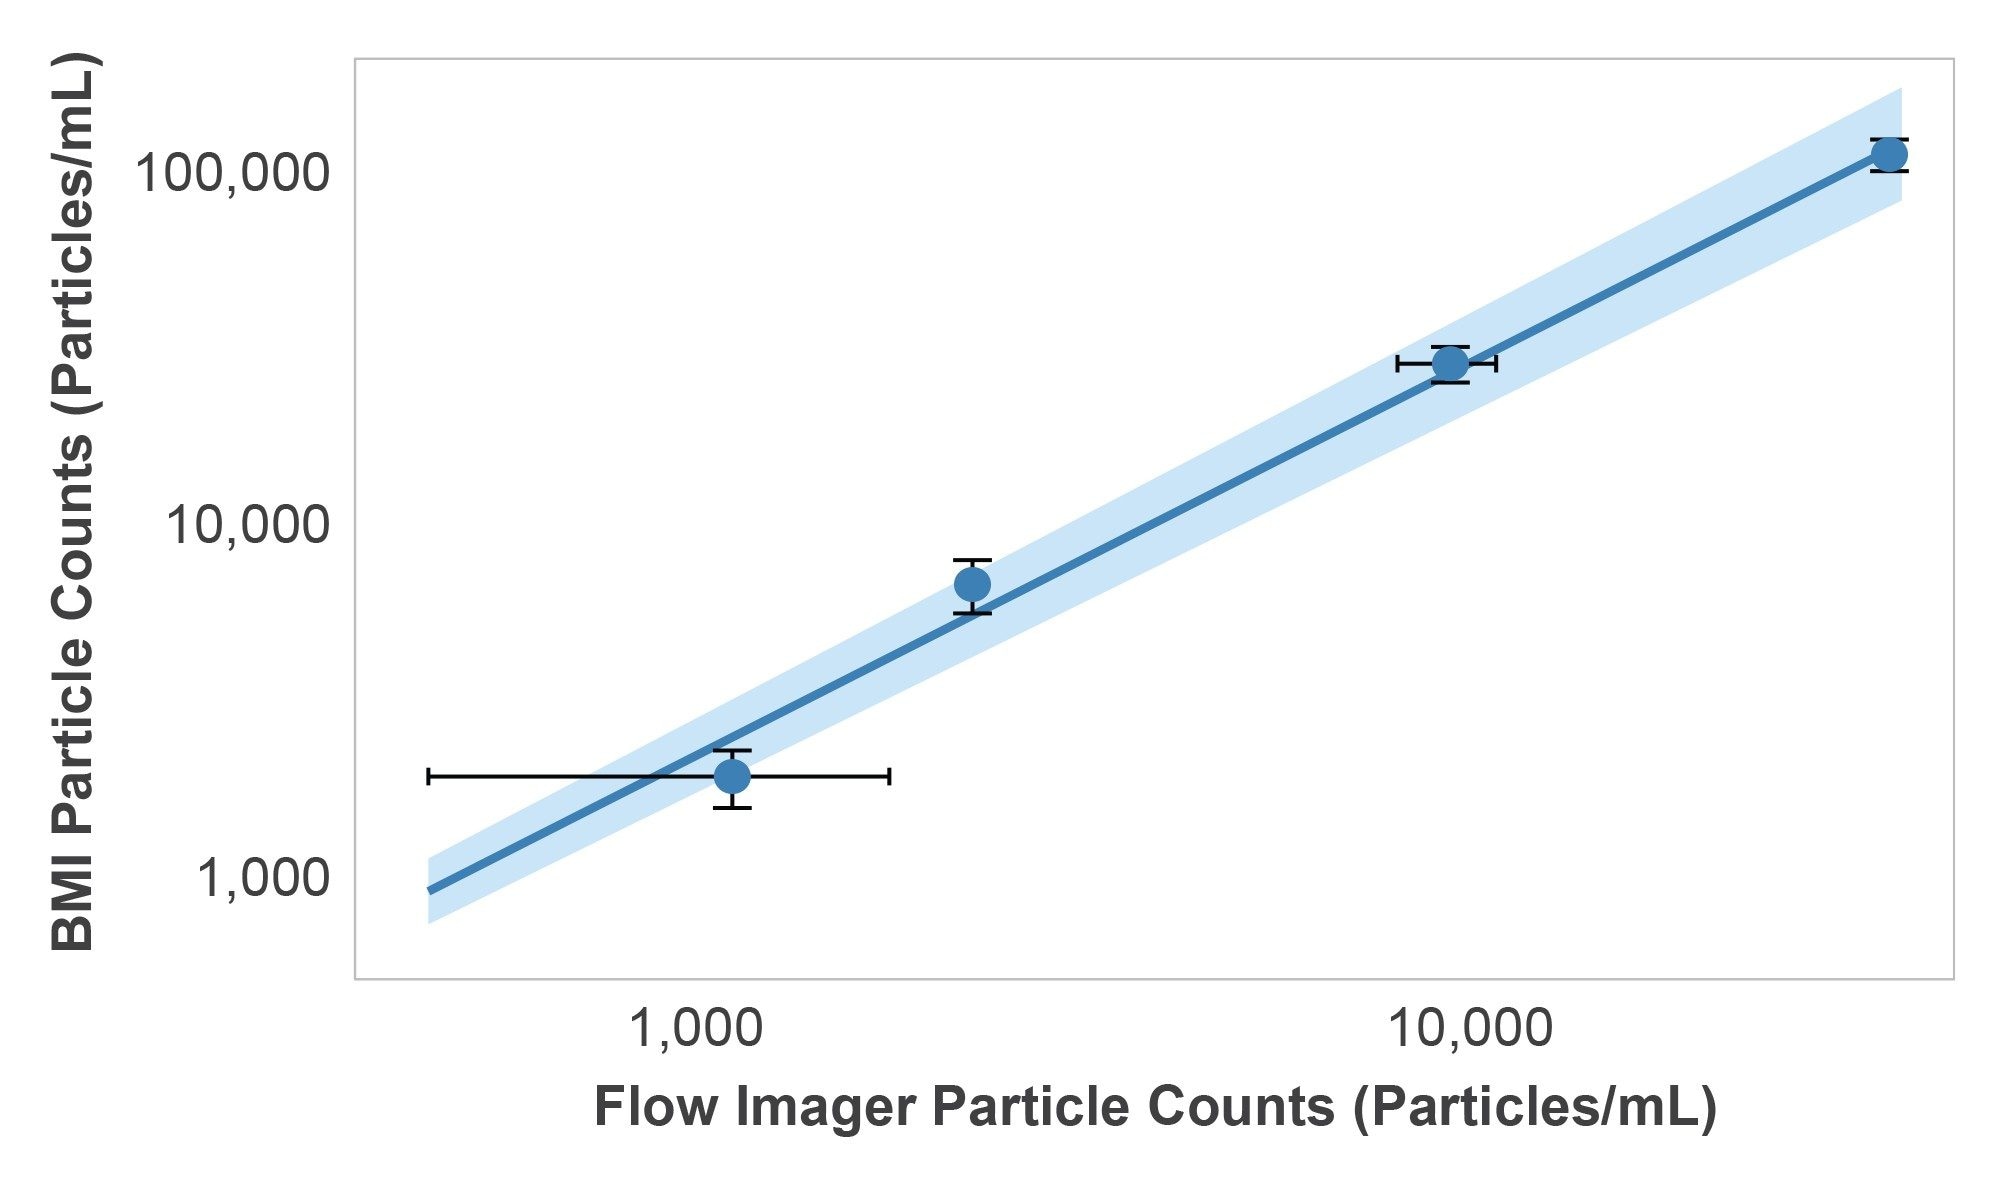
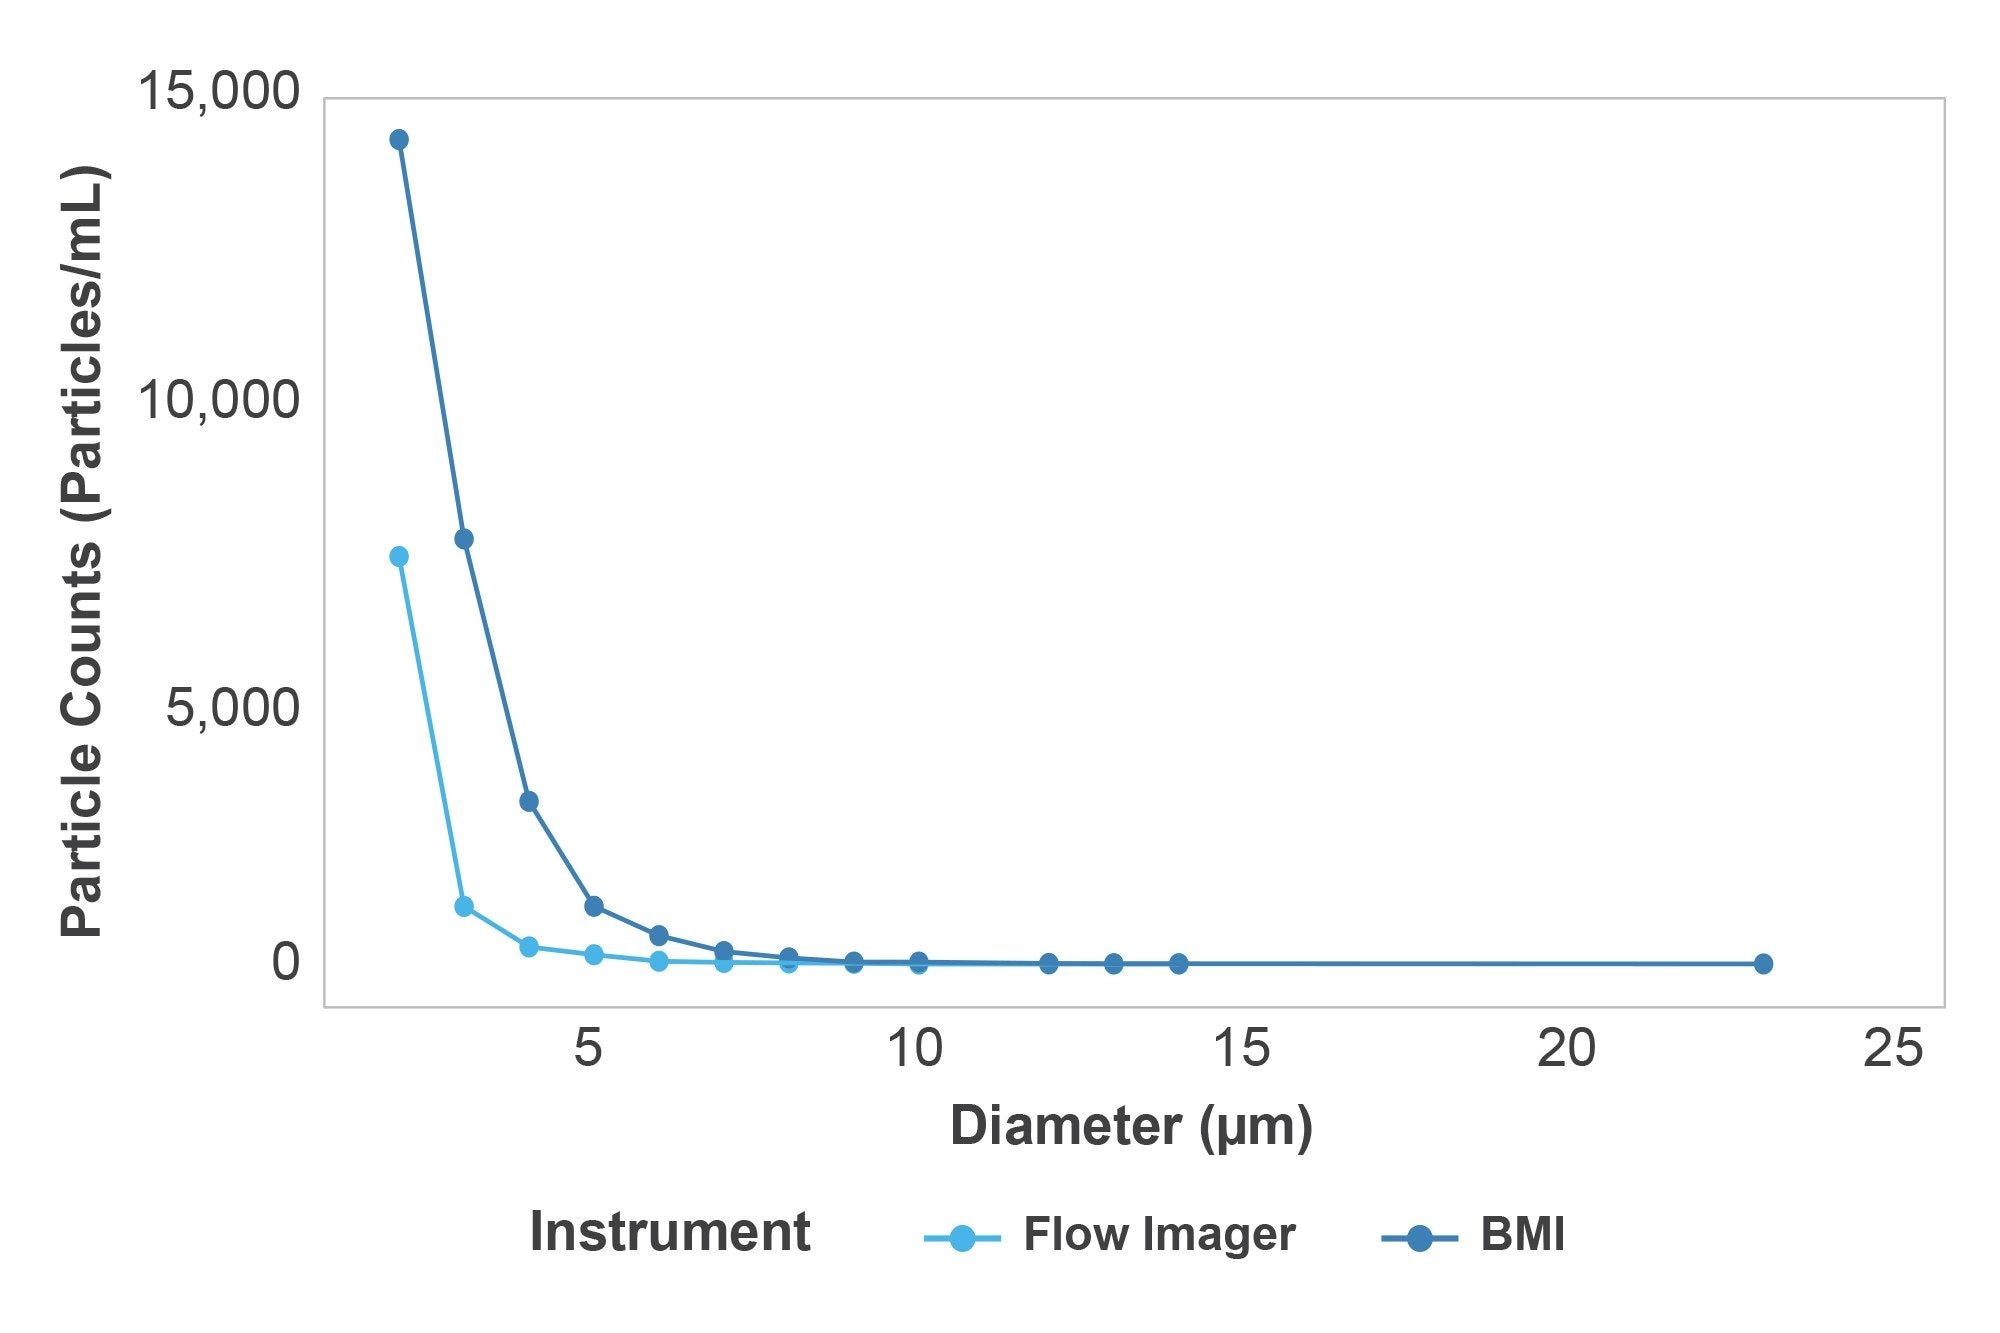
Particle counts for the HORIZON® system and the flow imager showed a linear response with respect to each other. However, the total particle counts measured with BMI using the HORIZON® instrument were roughly 3.26X higher than the total counts measured with the flow imager over the entire concentration range (Figure 4). Additionally, the HORIZON® system produced average CVs of 14.4% using 50 µL samples while the flow imager produced average CVs of 20.1% in 300 µL samples with increasing variability as the particle size decreased. This demonstrates that the HORIZON® instrument produced more robust results with 6X less sample volume per measurement. While results from both systems exhibited the expected particle size exponential decay, the flow imager counted significantly less particles in size bins <10 µm, suggesting that the refractive index is a bigger factor in these measurements (Figure 5).
Study 2 — Understanding the Impact of Solution Refractive Index
Excipient Effect Study
Protein aggregates made of immunoglobulin G (IgG) antibody were generated using the periodic interfacial compression method described in Bee et al.13 Briefly, IgG protein was diluted into pH 7.4 phosphate buffer saline then filtered using 0.2 µm pore size sterile filters. Samples were then rotated at 15 rpm for 3 hrs at 22 °C room temperature.
Solutions of interfacially compressed IgG aggregates were each formulated with varying sucrose concentrations from 0 to 20% w/v. Sucrose solutions were prepared using crystalline sucrose (Fisher, catalog #S2-500GM) dissolved into distilled deionized water. A 100% stock sucrose solution was prepared by mixing 100 mg sucrose into 100 mL ddH2O. The 100% stock sucrose solution was then diluted into 50% (50:50 stock sucrose:particles) and a 20% sucrose solution + particles (20:30:50 sucrose:water:particles) and the 10% sucrose solution (10:40:50 stock sucrose:water:particles). Three wells were assayed on the HORIZON® system for each sucrose concentration (N=4), at a volume of 50 µL each. Sucrose concentrations had no impact on the IgG aggregates particle count measured with the HORIZON® system. All results gave expected measurements with the average CV for IgG aggregates=5.4% (Figure 6).
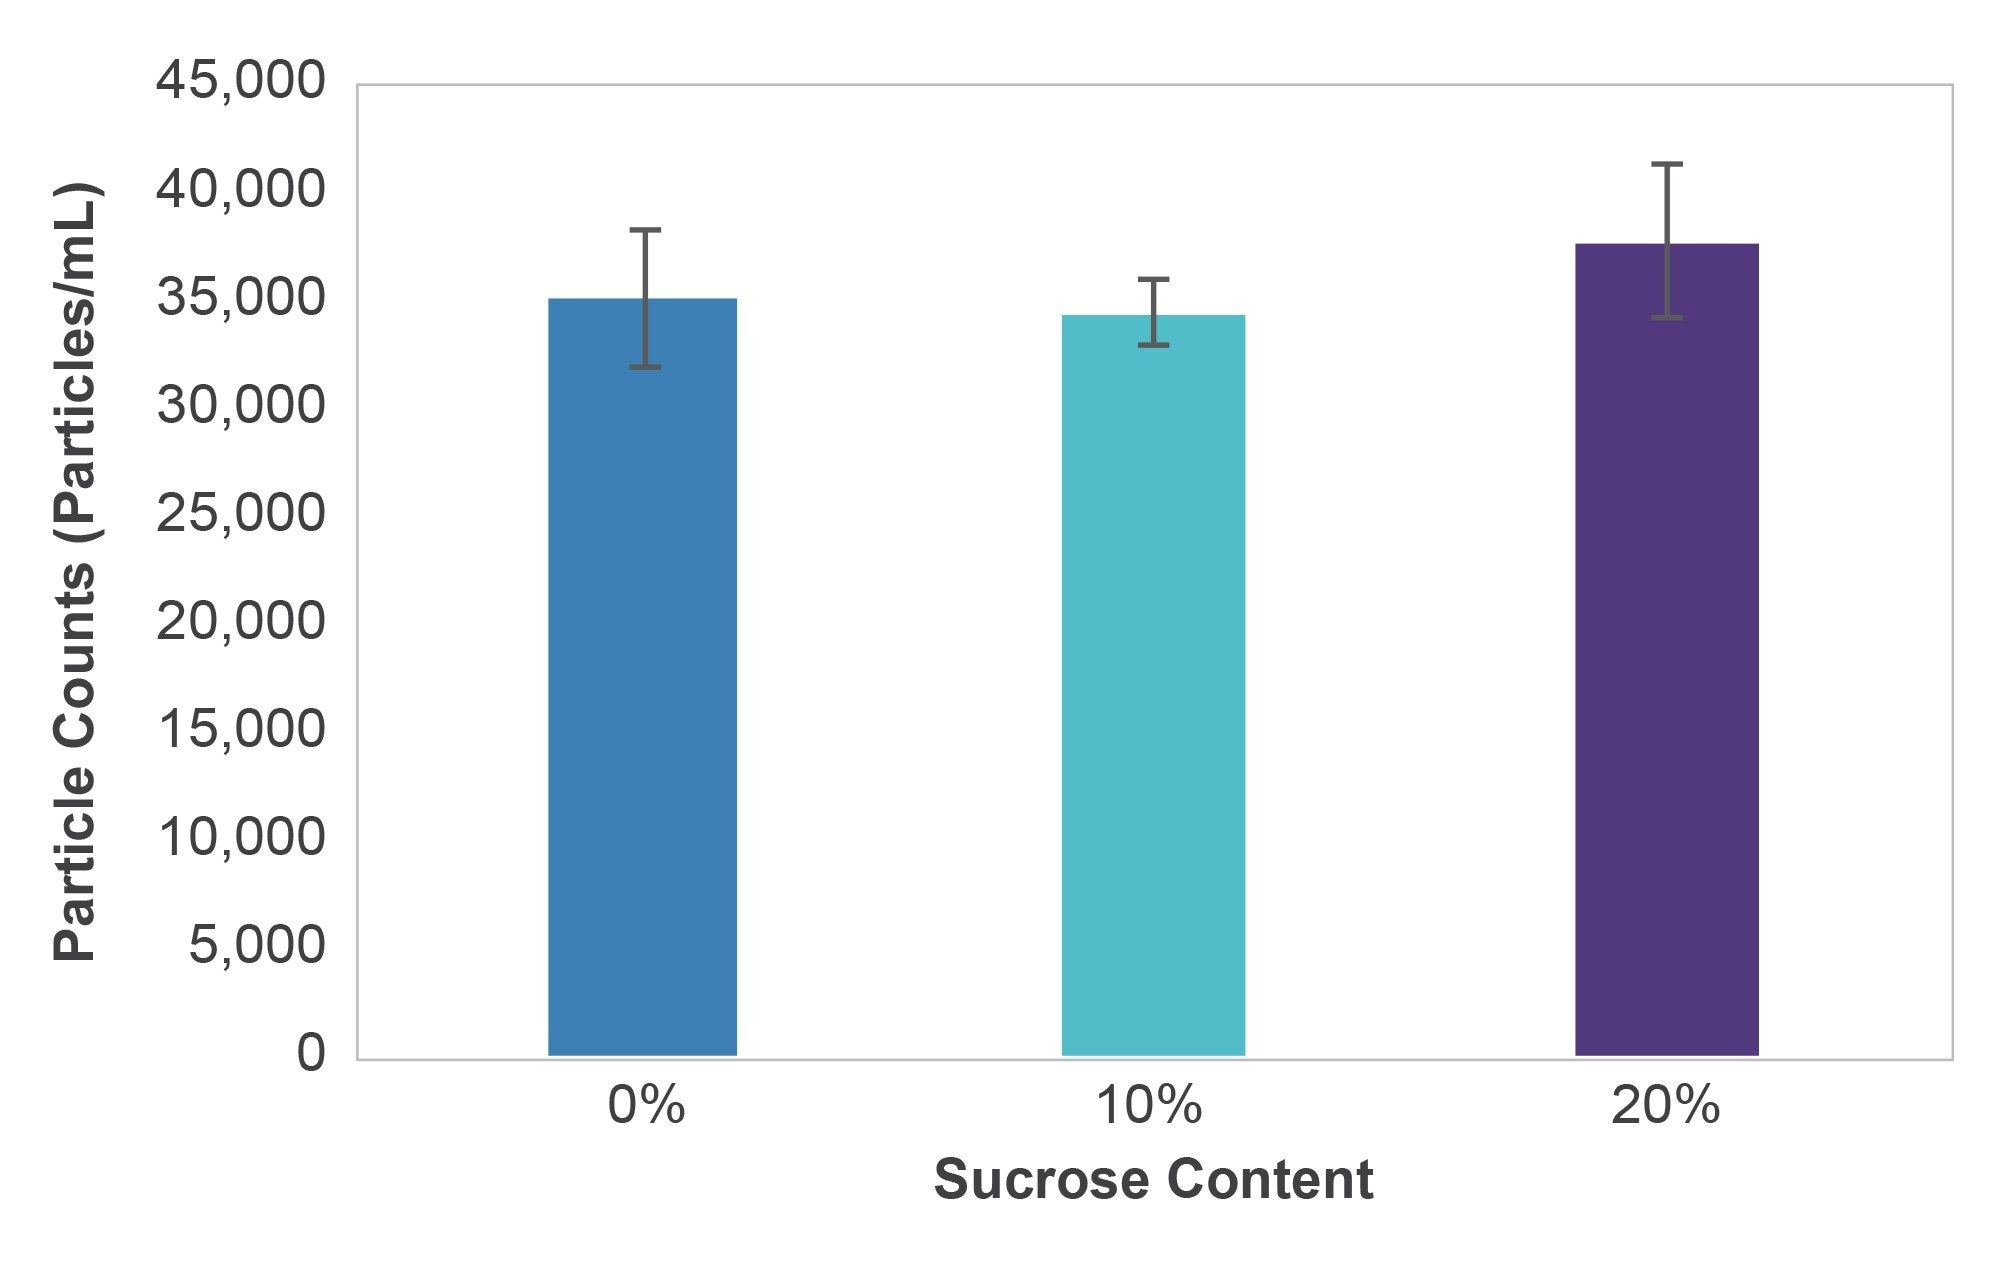
The use of IgG, a low refractive index particle, demonstrated that changing the refractive index of the solution had no affect the particles counted by the HORIZON® system.
Conclusion
When studying the impact of protein aggregate refractive index, IgG protein aggregates analyzed on both the HORIZON® instrument and flow imager systems produced equivalent particle count trends. However, the HORIZON® system was more sensitive (measured more overall counts) and had overall lower variability with average CVs of 14.4% compared to the flow imager which produced average CVs of 20.1%. The differences in variability and counts were most pronounced at lower concentrations and size range respectively. Given that most particles in a therapeutic drug formulation are small, the inability of flow imagers to accurately count the smallest of protein aggregates has a dramatic impact on the total number of particles measured. This can mean an undercounting by as much as 3–10X depending on the protein and formulation conditions.
High variability at low concentrations in flow imagers can pose a hurdle for early stage analysis were sample is scarce. In low volume analysis (<250 µL), the possibility of measuring fewer particles increases, therefore it is imperative to have high sensitivity measurements when already challenged by low sampling statistics.
In the excipient effect study, sucrose did not have an impact on the overall particle counts when measured using the HORIZON® system. This contrasts with previous studies comparing excipient effects on three flow imagers.10 In each case, the particle counts decreased up to 30% or more using standard sucrose formulation concentrations of 0–20%. The difference between the data generated by BMI and FI can be attributed to the fact that the HORIZON® instrument is not affected by particle or solution refractive index.
Flow imagers are deeply vulnerable to the impact of refractive index when measuring protein aggregates due to their translucency and the negative impact of surfactants. Due to this basic optical phenomenon, flow imagers can dramatically undersize and undercount particles. Finding the right tool for the job will have a critical impact on data accuracy and sensitivity. Powered with BMI, the HORIZON® system provides high refractive index contrast analysis to enable accurate, robust, and sensitive subvisible particle counting from 2 µm–4 mm in as little as 25 µL of sample and 96 samples in under 2 hours.
References
- Rosenberg AS. Effects of protein aggregates: An immunologic perspective. AAPS J. 2006 Aug 4;8(3):E501–7.
- Filipe V, Jiskoot W, Basmeleh AH, Halim A, Schellekens H, Brinks V. Immunogenicity of different stressed IgG monoclonal antibody formulations in immune tolerant transgenic mice. mAbs. 2012 Dec;4(6):740–52.
- Ratanji KD, Derrick JP, Dearman RJ, Kimber I. Immunogenicity of therapeutic proteins: Influence of aggregation. J Immunotoxicol. 2014 Apr;11(2):99–109.
- Schellekens H. The immunogenicity of therapeutic proteins. Discov Med. 2010 Jun;9(49):560–4.
- Food and Drug Administration. Immunogenicity Assessment for Therapeutic Protein Products. FDA: Rockville, MD (http://www.fda.gov/downloads/Drugs/GuidanceComplianceRegulatoryInformation/Guidances/UCM338856.pdf). 2013.
- Amin S, Barnett GV, Pathak JA, Roberts CJ, Sarangapani PS. Protein aggregation, particle formation, characterization & rheology. Curr Opin Colloid Interface Sci. 2014 Oct;19(5):438–49.
- Pedersen JS, Persson M. Unmasking translucent protein particles by improved micro-flow imagingTM algorithms. J Pharm Sci. 2014 Jan;103(1):107–14.
- Zölls S, Gregoritza M, Tantipolphan R, Wiggenhorn M, Winter G, Friess W, Hawe A. How Subvisible Particles Become Invisible—Relevance of the Refractive Index for Protein Particle Analysis. J Pharm Sci. 2013 May 1;102(5):1434–46.
- Ripple DC, Hu Z. Correcting the Relative Bias of Light Obscurat ion and Flow Imaging Particle Counters. Pharm Res. 2016 Mar;33(3):653–72.
- Zölls S, Weinbuch D, Wiggenhorn M, Winter G, Friess W, Jiskoot W, Hawe A. Flow imaging microscopy for protein particle analysis--a comparative evaluation of four different analytical instruments. AAPS J. 2013 Oct;15(4):1200–11.
- Kiese S, Papppenberger A, Friess W, Mahler H-C. Shaken, not stirred: mechanical stress testing of an IgG1 antibody. J Pharm Sci. 2008 Oct;97(10):4347–66.
- Mahler H-C, Müller R, Friess W, Delille A, Matheus S. Induction and analysis of aggregates in a liquid IgG1-antibody formulation. Eur J Pharm Biopharm. 2005 Apr;59(3):407–17.
- Bee JS, Schwartz DK, Trabelsi S, Freund E, Stevenson JL, Carpenter JF, Randolph TW. Production of particles of therapeutic proteins at the air–water interface during compression/dilation cycles. Soft Matter. 2012 Sep 26;8(40):10329–35.
720009098, November 2025