Identify and Characterize Particles in the Visible Size Range with Aura
Waters Corporation, United States
Published on November 06, 2025
Introduction
Characterizing large visible contaminants is essential for patient safety and mandated by both USP 788, 790, and 1046. Drug formulations for parenteral injection are required to meet certain standards for subvisible particles (>100 µm) and must be completely free of visible particles (>1 µm–100 µm).1 Therefore, subvisible and visible particle analysis is necessary throughout the drug development process to ensure that products do not produce unwanted adverse side-effects or reductions in efficacy.2 However, traditional detection methods for subvisible and visible particles like dynamic flow imaging (FI) and light obscuration (LO) are plagued by a number of limitations that hamper analysis, including:
- Particle fragmentation, also known as clipping, observed during particle detection with flow imaging techniques.3
- A low refractive index contrast encountered when measuring biologic particles in liquid media that makes it difficult to distinguish translucent particles from background.4
- A small depth of focus in a wide fluidic channel area that exacerbates particle fragmentation and dramatically reduces sampling efficiency. This makes accurate large particle detection nearly impossible.
- Clogging that occurs when visible particles flow through the fluidic chambers of flow-based systems like FI or LO.
- Visible particle inspection performed by manual operators that is highly error prone.5
Aura™ Systems are powered by backgrounded membrane imaging (BMI), a USP 788 Method 2 compliant digital imaging method that conducts both subvisible and visible particle analysis. Calibrated using a microscopy reference slide, Aura provides accurate and linear data for particles up to 5.6 mm in equivalent circular diameter on 96-well small volume plates and 14 mm on 24-well large volume plates, well into the visible range.
In this application note, we demonstrate the capability of Aura instruments and Particle Vue Software to characterize visible particle aggregates stemming from various biologic drug formulation processes. A comparison of both visible and subvisible NIST ethylene tetrafluoro ethylene (ETFE), large adeno-associated virus (AAV) aggregates, large cellular aggregates from CAR-T cell therapies, and large fibrous contaminants in cell therapies are used as models to illustrate how Aura can analyze a range of samples while providing accurate size characterizations. In addition, side illumination membrane images (SIMI) and fluorescent membrane microscopy images (FMM) provide further information about the visible particle samples and their nature.
Results and Discussion
Detection of Biologics and Standards Using Aura
NIST Visible ETFE
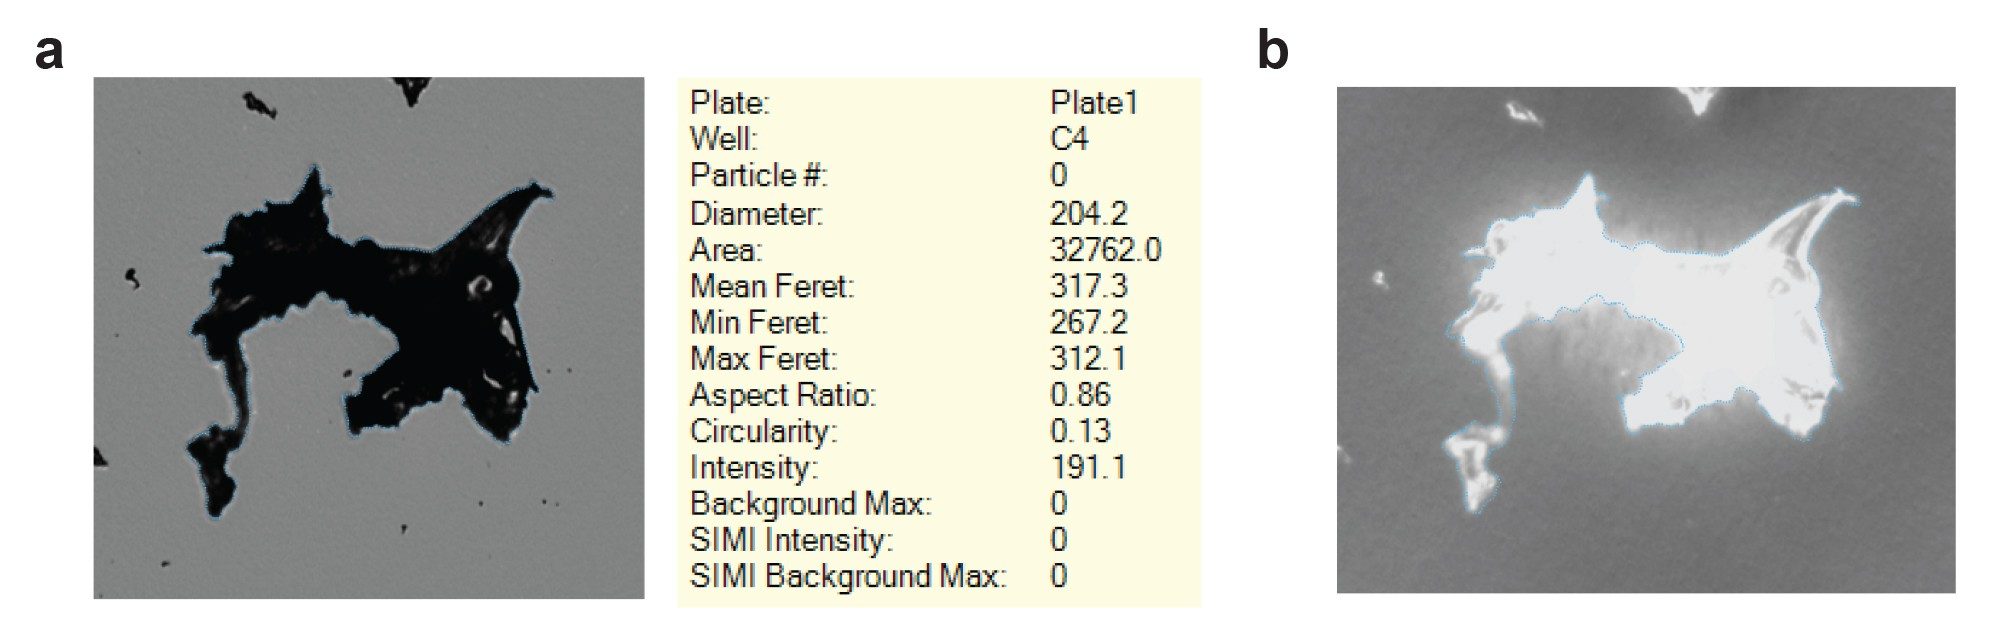
Ethylene tetrafluoroethylene (ETFE) is a is a chemically inert polymer from the National Institute of Standards and Technology (NIST, catalog no. RM8634) designed to help standardize systems that measure subvisible particles. A larger, visible ETFE particle (provided by Dean Ripple and Srivalli Telikepalli, NIST) is designed to standardize the characterization of visible particles across particle measurement systems. Aura Systems accurately sizes visible ETFE particles in a high-throughput 96-well system using our proprietary particle detection algorithms and Particle Vue Software. Visible ETFE particles measured more than 200 µm in equivalent circular diameter (ECD) and >300 µm in maximum Feret diameter (Figure 1a). Particles of this size often clog the 300 µm tall channel of flow imagers, negatively influencing operator usability. In addition, this visible ETFE particle generates a strong SIMI image. SIMI provides side illumination and is used in conjunction with brightfield to expose any objects protruding out of plane, indicating that the visible ETFE particle has a lot of depth in the axis plane (Figure 1b).
Cell Therapy Visible Particles
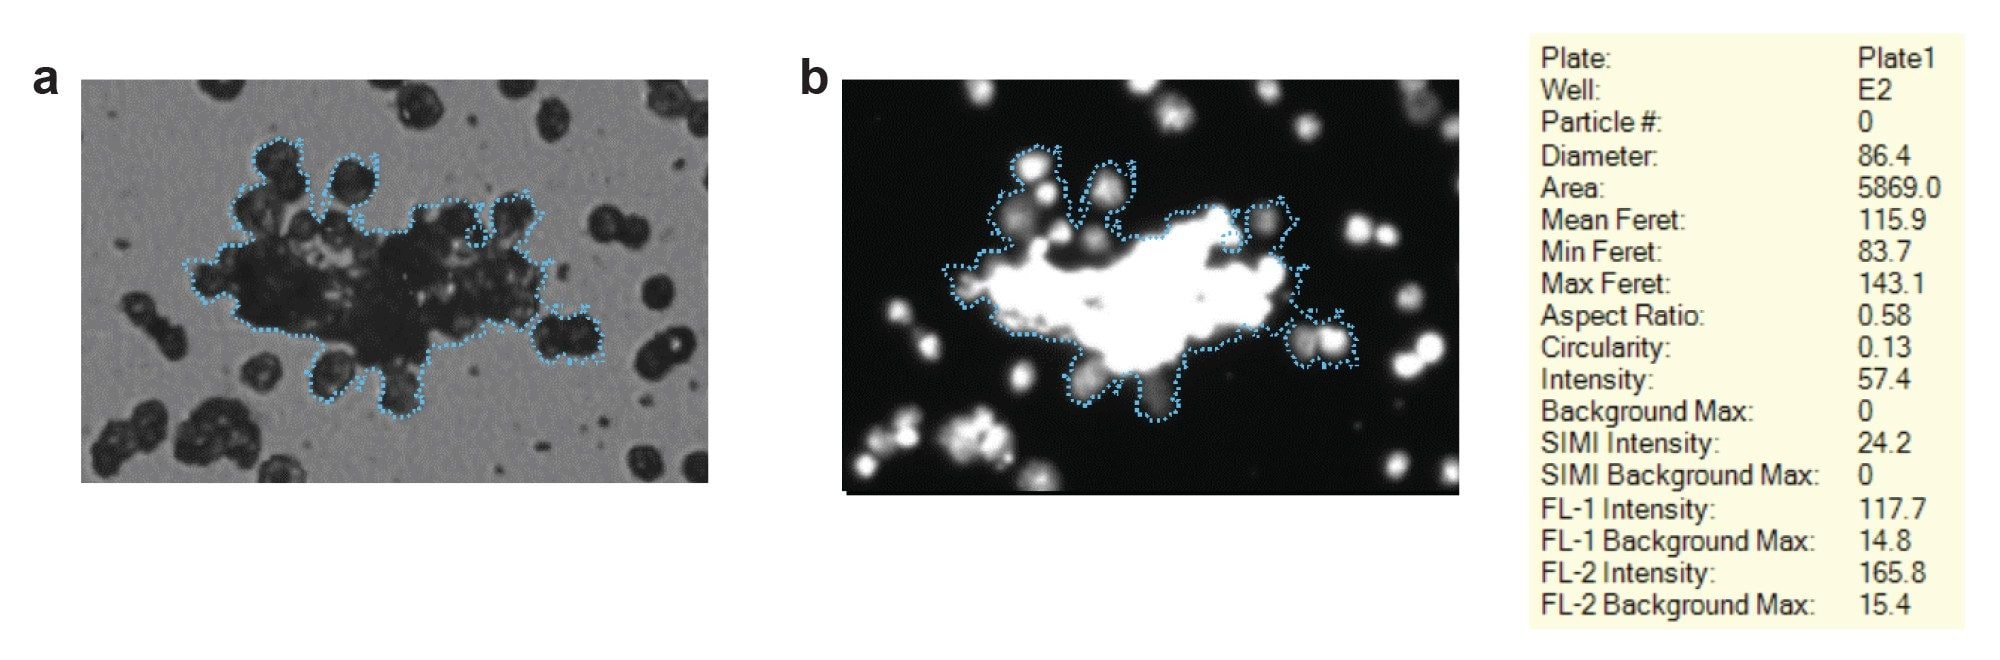
Identification of large cell clusters is required when developing cell therapies for the same immunogenic potential described prior. Methods traditionally used to monitor visible particles in cell therapies, like flow cytometers and other imaging flow-based systems, face challenges because they can experience significant clogging when there is significant cellular aggregation. Particle Vue Software on Aura is capable of accurately sizing visible sizecellular aggregates (Figure 2a) as well as identifying and categorizing them as cellular aggregates by using nucleic acid (Hoechst) fluorescent staining using FMM (Figure 2b). Aura can easily detect a large agglomeration of T Cells towards the center of a visible cellular aggregate particle who has a maximum Feret diameter exceeding 140 µm, as well as smaller cell aggregates in its vicinity. Aside from zero risk of clogging with Aura instruments, when paired with Particle Vue Software, cellular aggregation is clearly identified with no clipping or image fragmentation.
One of the challenges in conducting subvisible and visible particle analysis in cell therapies is that the cells are on the same size scale order as other subvisible contaminants. This can lead to misidentified particles, especially in a complex aggregate. In this example, a brightfield image of a large contaminant fiber present in a T Cell therapy sample that exceeds 340 µm in maximum Feret (Figure 3).
Traditional methods would identify the fiber but would miss individual cell singlets trapped inside the visible fibrous object. Aura provides this additional, high-level information using nucleic acid staining (Hoechst) based FMM to detect individual cell singlets trapped inside the fiber and confirms that the fiber is not a visible size cell aggregate all by itself.
Adeno-Associated Viruses
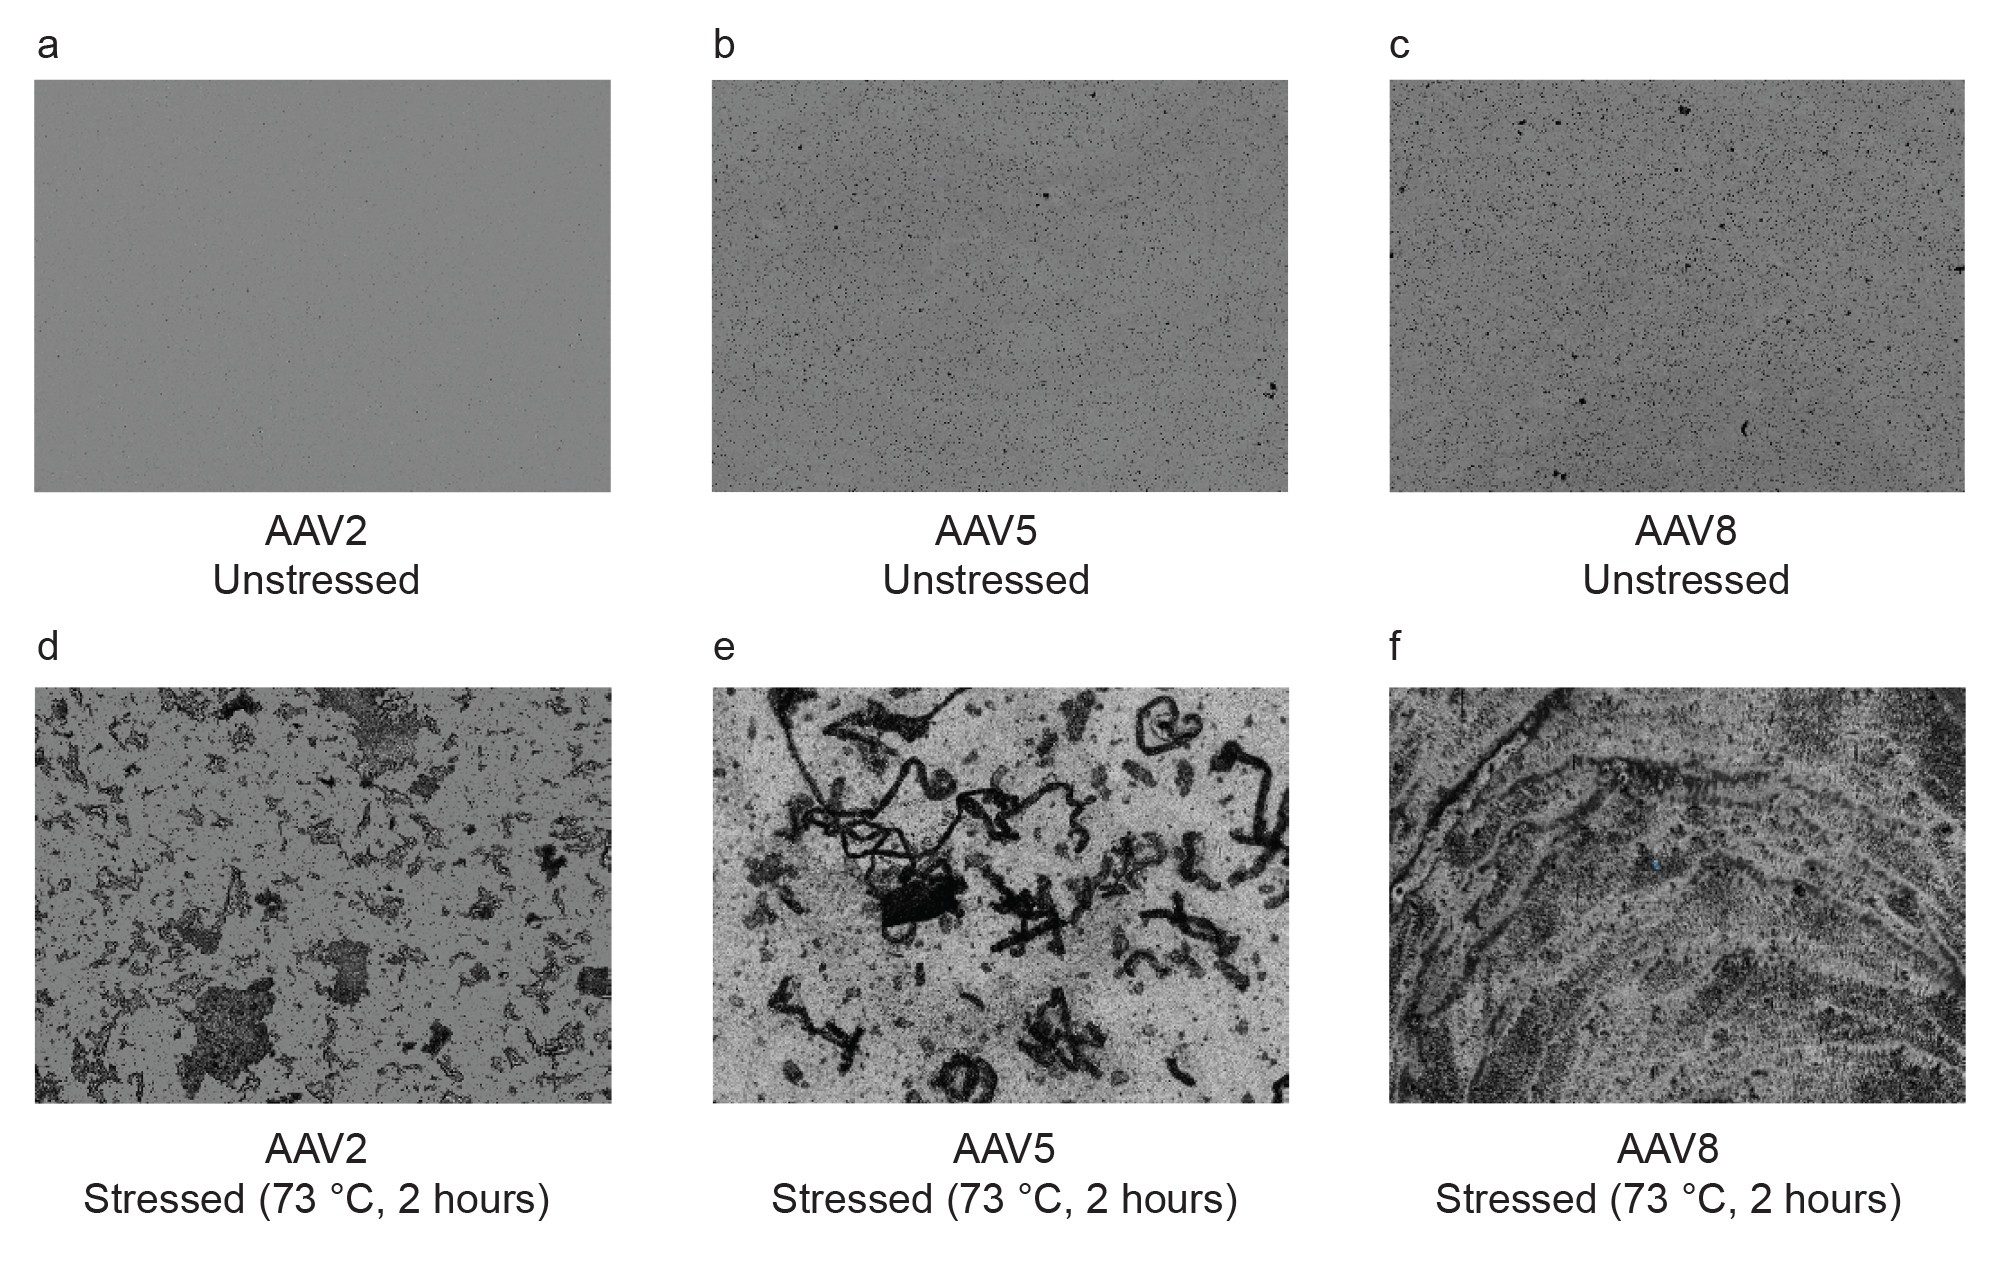
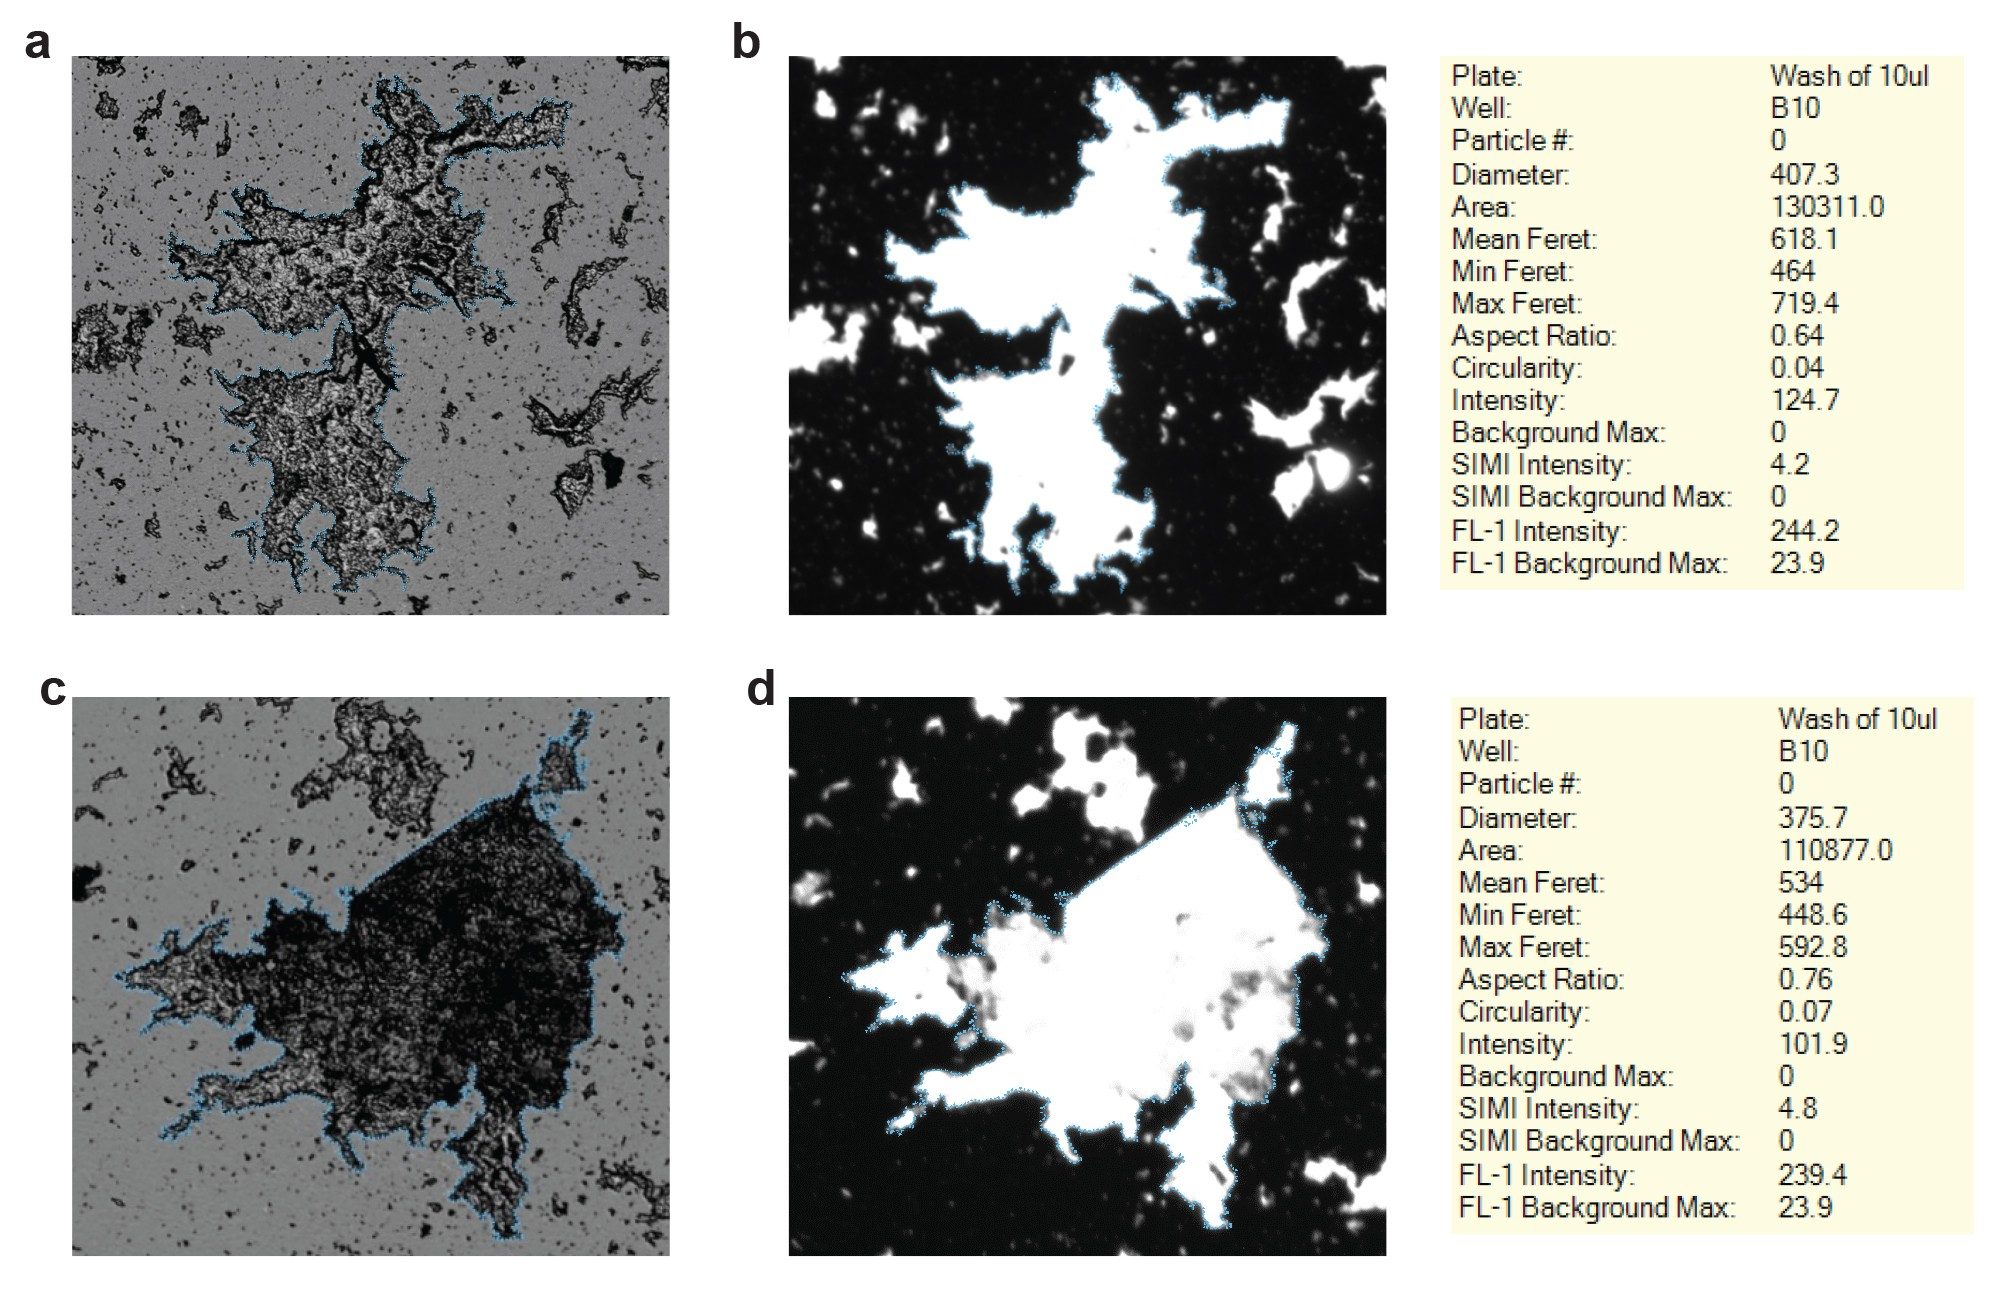
Aggregates in adeno-associated viruses (AAV) parenteral formulations can also cause increases in patient immune response and cause drastic reductions in transduction efficacy.6 This undesired immune response can also decrease the half-life of the therapeutic gene or peptide once expressed in the patient.7 Various transportation and storage stressors can cause AAV aggregation, and unstable AAV aggregation producing visible range particulates. In Figure 4, we display two examples of visible AAV aggregates in the brightfield (BF) channel (Figure 4a) and Thioflavin-T protein fluorescence (Figure 4b) channel. The AAV particle maximum projection reached >700 µm, a size that would easily clogging any fluidic based particle detection system. In addition, we can definitively ID the visible particles as large AAV aggregates since the protein fluorescence channel confirms that the large particle consists of aggregated protein capsid particles. Figures 4c and 4d show brightfield and protein fluorescence images respectively of another visible AAV particle.
Conclusion
Aura particle analysis systems and Particle Vue Software can analyze particles well into the visible size range, solving a long-standing analytical problem in biologic, cell, and gene therapy characterization. BMI enables accurate sizing and morphological determination of large aggregates and Aura’s FMM, present in both the Aura and Aura CL Systems, allows for specific particle identification to understand the nature and origin of the visible aggregates. Accurately size, characterize, and identify particles from small to large for all biological samples using Aura to ensure proper assessment of both visible and sub visible particles.
References
- Rech J, Fradkin A, Krueger A, Kraft C, Paskiet D, (2020). Evaluation of Particle Techniques for the Characterization of Subvisible Particles From Elastomeric Closure Components. J Pharm Sci, 109(5):1725–1735.
- Carpenter JF, Randolph TW, Jiskoot WI, Crommelin DJ, Middaugh CR, Winter G, Fan YX, Kirshner S, Verthelyi D, Kozlowski S, Clouse KA, (2009). Overlooking subvisible particles in therapeutic protein products: gaps that may compromise product quality. Journal of pharmaceutical sciences. J Pharm Sci, 98(4):1201–5.
- Zölls S, Weinbuch D, Wiggenhorn M, Winter G, Friess W, Jiskoot W, Hawe A, (2013). Flow imaging microscopy for protein particle analysis—A comparative evaluation of four different analytical instruments. AAPS J, 15(4):1200–11.
- Zölls S, Gregoritza M, Tantipolphan R, Wiggenhorn M, Winter G, Friess W, Hawe A, (2013). How subvisible particles become invisible—Relevance of the refractive index for protein particle analysis. J Pharm Sci,102(5):1434–46.
- Wickson Bryan. (2019). Particulate Matter: USP Requirements and Particle Identification. Parenteral Drug Association Presentation.
- Srivastava A, Mallela KM, Deorkar N, Brophy G, (2021). Manufacturing challenges and rational formulation development for AAV viral vectors. J Pharm Sci, 110(7):2609–2624.
- Mingozzi F, High KA, (2013). Immune responses to AAV vectors: overcoming barriers to successful gene therapy. Blood, 122(1):23–36.
Acknowledgment
We would like to thank Dean Ripple and Srivalli Telikepalli at the National Institute of Standards and Technology for providing the visible ETFE particles.
Featured Products
720009112, November 2025