
Targeted and Non-Targeted Screening of Persistent Organic Pollutants (POPs) in Groundwater and Trade Effluent Wastewater Using the Xevo™ G3 QTof Mass Spectrometer
Chris Henry
Waters Corporation, Wilmslow, UK
Published on August 20, 2026

Abstract
Using data independent analysis (DIA) acquisition mode on the Xevo G3 QTof Mass Spectrometer, two wastewater samples (WW1/WW2) and one groundwater sample (GW) were analyzed for per- and polyfluoroalkyl substances (PFAS) content. Targeted screening was carried out against PFAS libraries within waters_connect™ Software based on accurate mass, fragment information, and retention time. Further downstream untargeted analysis was carried out using the pattern analysis application to detect suspected PFAS species missing from the library, allowing putative identification based on characteristic features of PFAS. The importance of this work lies in enabling comprehensive environmental surveillance of persistent and emerging contaminants. By combining targeted analysis of known PFAS with non-targeted discovery workflows, labs can move beyond regulatory monitoring to identify previously unknown pollutants, providing a more complete assessment of groundwater and wastewater contamination while supporting future environmental protection and regulatory compliance.
Benefits
- Analysis of environmental water sample contaminants using targeted and untargeted workflows by direct injection
- DIA enables the identification of PFAS compounds lacking commercially available standards
- Routine sub 2 ppm mass accuracy identification and quantitation of PFAS
- Flexible ready-made workflows within UNIFI™ Software for easy data screening and visualization
- Pattern analysis application enabling pattern-based discovery of PFAS and any homologous compound class
Introduction
Persistent organic pollutants (POPs) are causing global concern due to their sustained presence in the environment, ability to travel long distances, and capacity to bioaccumulate in the fatty tissues of humans and wildlife.1 Attempts to mitigate the negative impact of traditional POPs, such as polychlorinated biphenyls (PCBs) used in sealants and paint, and DDT (dichlorodiphenyltrichloroethane, a synthetic insecticide),2 resulted in the widespread introduction of PFAS as ‘safer’ alternatives. These compounds are now known to be toxic, persistent, and mobile.3 Concerns have accelerated the need to screen ‘raw’ water sources that may be used for drinking water to ensure POPs levels are safe.
A major challenge to the targeted monitoring of PFAS is that out of the ~10,000 known and commercially relevant species, high-purity, quantitative reference standards are available for only about 6%.4 QToF mass spectrometry utilizing DIA enables the acquisition of both high and low energy data to provide precursor ion and fragment ion information on all species detected.5 This technology provides scientists with a valuable tool enabling the unbiased acquisition of all detectable molecules. DIA creates a comprehensive, retrospective digital archive of complex environmental matrices, allowing researchers to mine for emerging compounds, transformation products, and novel isomers.
This application note describes the direct injection and comprehensive screening of two trade wastewater samples (WW1/WW2) and a GW sample collected in the United Kingdom using the Waters Xevo G3 QTof Mass Spectrometer, coupled with ultra-performance liquid chromatography (UPLC™). An initial targeted workflow was based on a PFAS screening library using waters_connect Software. Any library hits were assayed against a calibration curve of PFAS standards and the mean (n = 3) result reported. Further to this initial screening, discovery workflow was carried out on the ‘WW2 sample’ exploiting innate properties of PFAS compounds using pattern analysis application on waters_connect Software to identify other pollutants in the samples not included in the initial screening library.
Experimental
Sample Preparation
A ten-point calibration curve (0.001-50 ng/mL) was prepared using the 30 PFAS standard PFAC30PAR (Wellington Laboratories Inc., Ontario, Canada) in 50:25:25 MeOH:water:acetonitrile with 0.1% v/v formic acid, and transferred into 12 x 32 mm polypropylene vials (p/n: 186005230).
Two samples of wastewater (WW1, WW2) and one sample of GW sourced in the UK were prepared for analysis by aliquoting 2 mL of each into a separate Eppendorf® and spun for 5 minutes at 10,000 rpm. An aliquot of the supernatant was diluted 1:1 with 50:50 MeOH: water with 0.1%v/v formic acid. 50 µL of standards and the diluted samples were analyzed using an ACQUITY™ UPLC I-Class System (with PFAS Kit) coupled to a Xevo G3 QTof Mass Spectrometer.
Initial targeted screening against a PFAS library containing retention time, accurate masses and known fragments was carried out. Identified compounds were then quantified against the standard curve.
Further to this work, untargeted analysis was performed on the WW2 sample using the pattern analysis application within the waters_connect Software. Features on interest were passed with the following attributes.
1. Mass defect between 0.9 and 0.1
2. [m/z]/Cn greater than 30
3. Response threshold >500
4. Other known attributes such as neutral losses (HF, CF2, SO3 or C2F4SO3) or common fragments (SO3, FSO3) were also considered.6
LC Conditions
|
LC system: |
Waters ACQUITY Premier UPLC I-Class System equipped with PFAS solution installation kit (p/n: 176005360) |
|
Vials: |
Polypropylene Autosampler Vial (p/n: 186005219) with pre-slit cap (p/n: 186000305) |
|
Column: |
ACQUITY Premier CSH™ C18 1.7 µm 2.1 x 100 mm Column (p/n: 186009461) |
|
Column temperature: |
35 °C |
|
Sample temperature: |
10 °C |
|
Injection volume: |
50 µL |
|
Flow rate: |
0.3 mL/min |
|
Mobile phase A1: |
2 mM Ammonium acetate : methanol 95:5 |
|
Mobile phase B1: |
2 mM Ammonium acetate in methanol |
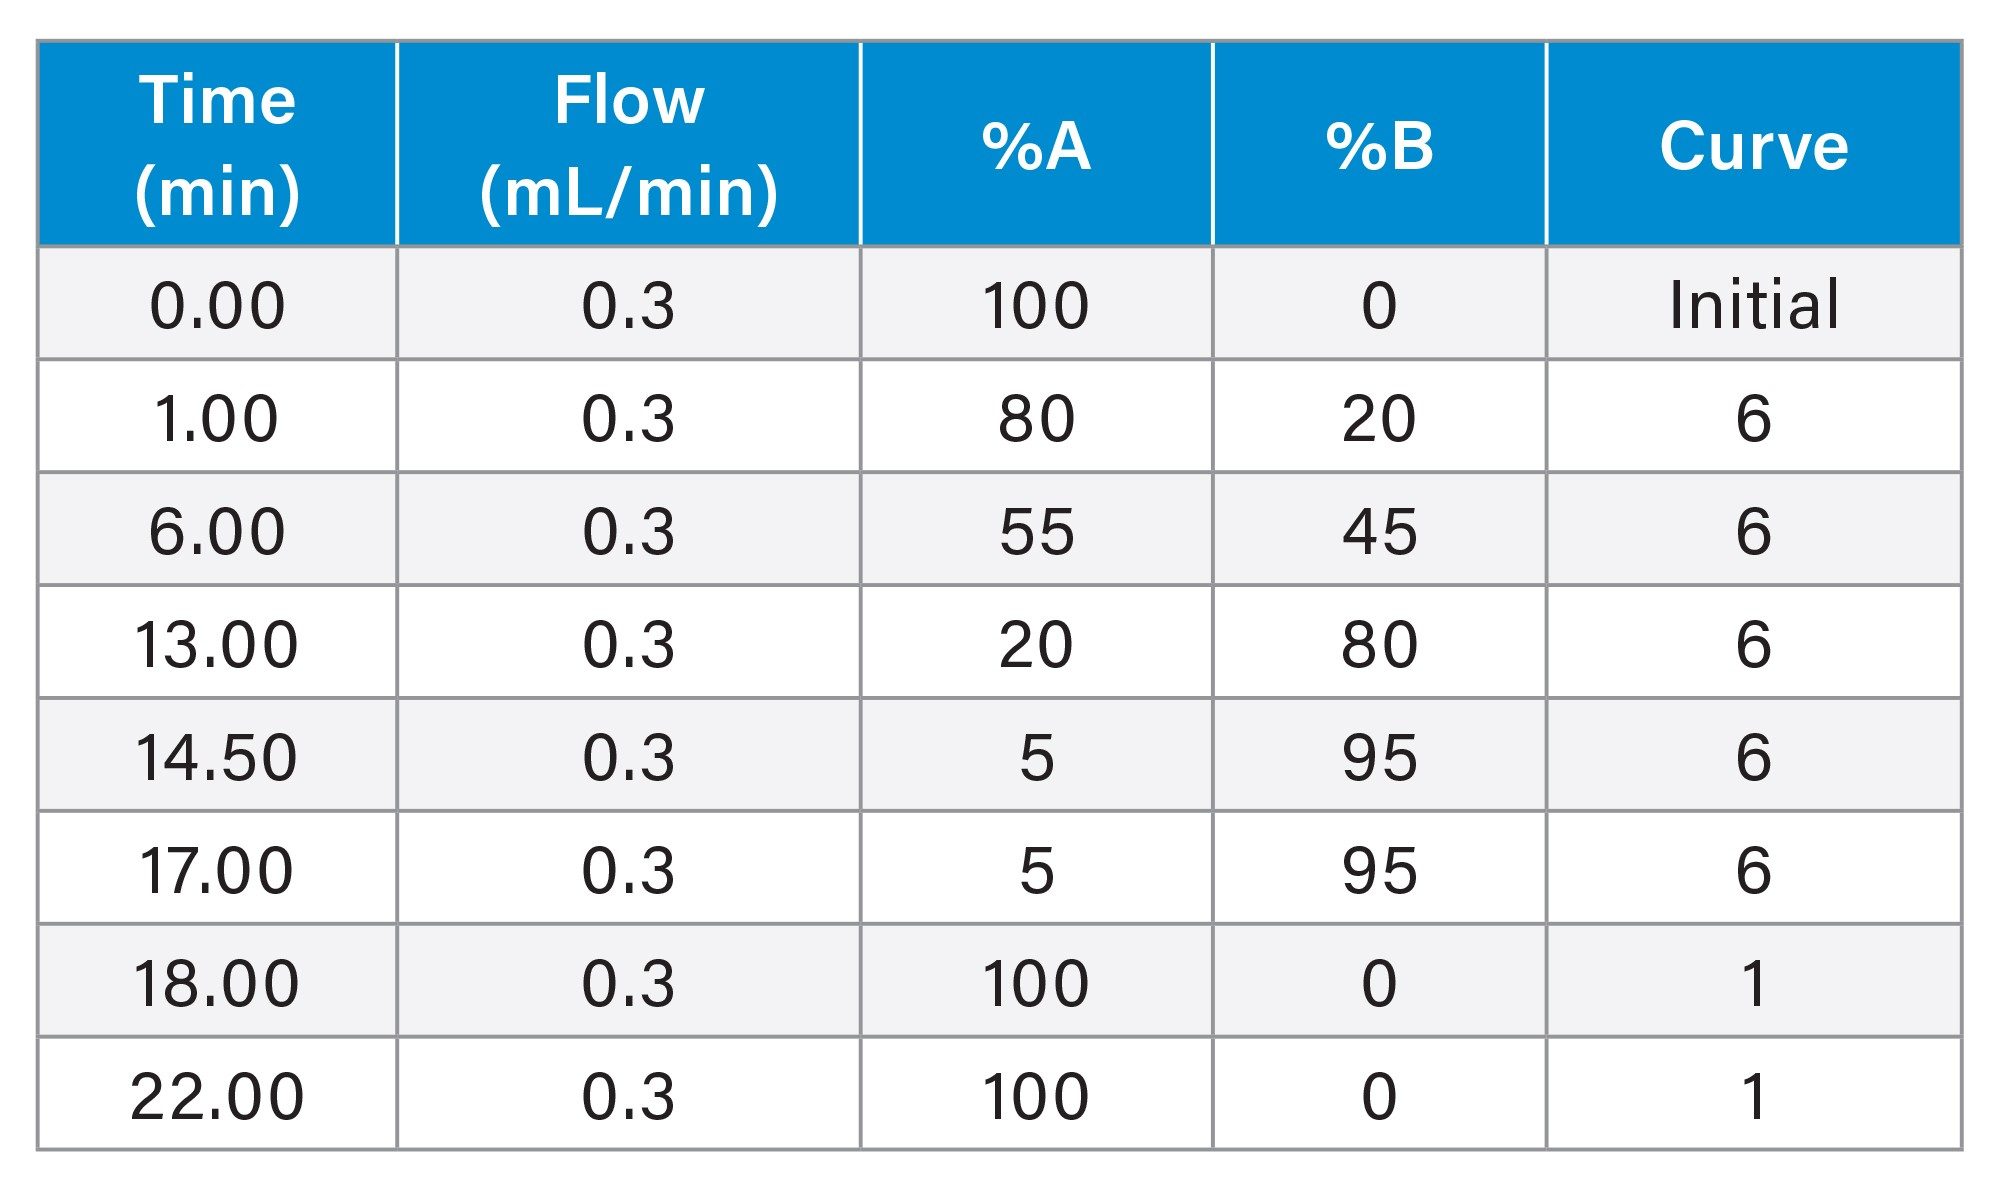
Gradient Table
MS Conditions
|
MS system: |
Waters Xevo G3 QTof Mass Spectrometer |
|
Mode: |
Sensitivity |
|
Mass range: |
50 - 1200 m/z |
|
Polarity: |
Negative |
|
Scan time(s): |
0.25 |
|
Cone voltage: |
30 V |
|
Source temperature: |
100 °C |
|
Desolvation temperature: |
250 °C |
|
Capillary voltage: |
0.5 kV |
|
MSE Low energy (fixed): |
4 V |
|
MSE High energy ramp: |
20-70 V |
Additional Tune Page Settings
|
StepWave™ RF (V): |
100 |
|
Body gradient (V): |
5 |
Data Management
|
waters_connect |
Version: 4.1.0 |
|
UNIFI |
Version: 3.15.1.1238 |
|
Pattern Analysis |
Version: 1.2.0 |
Results and Discussion
Targeted Screening Using UNIFI Software Libraries
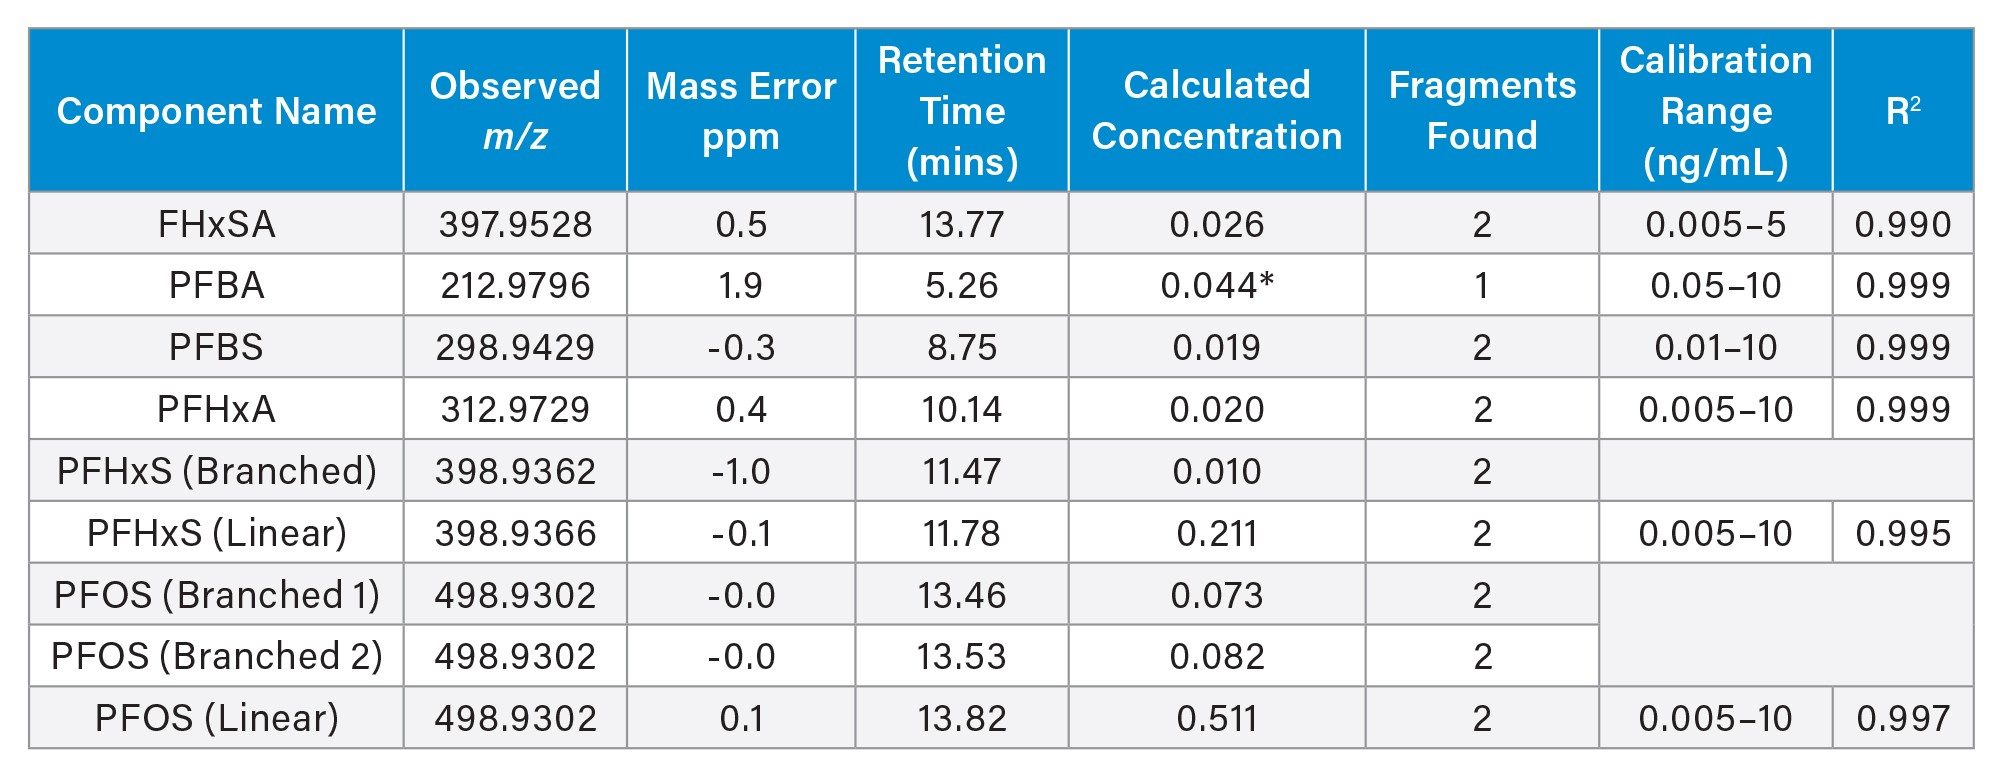
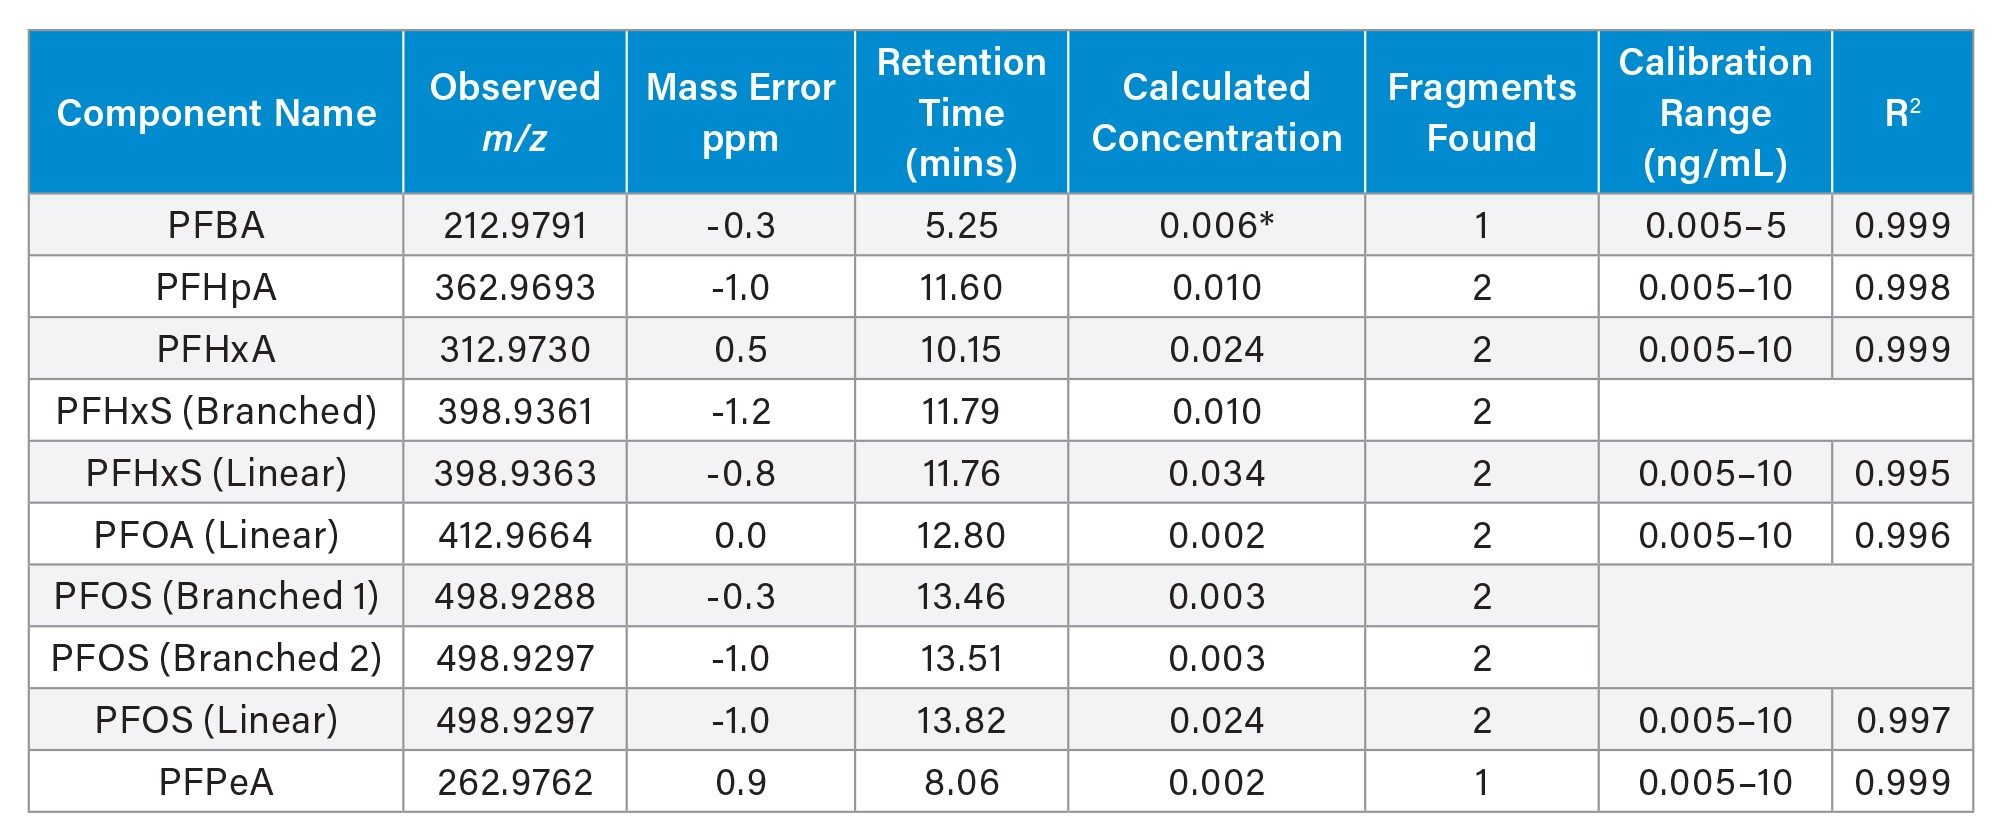
Targeted screening of the data using waters_connect Software against a panel of 149 analytes, from this panel, nine compounds were identified and quantified in WW1, 12 in WW2 and 10 in GW. Identified targets were quantified (n = 3) against the standard curve. Branched isomers were assayed against the corresponding linear species (Figures 1 and Tables 1-3).
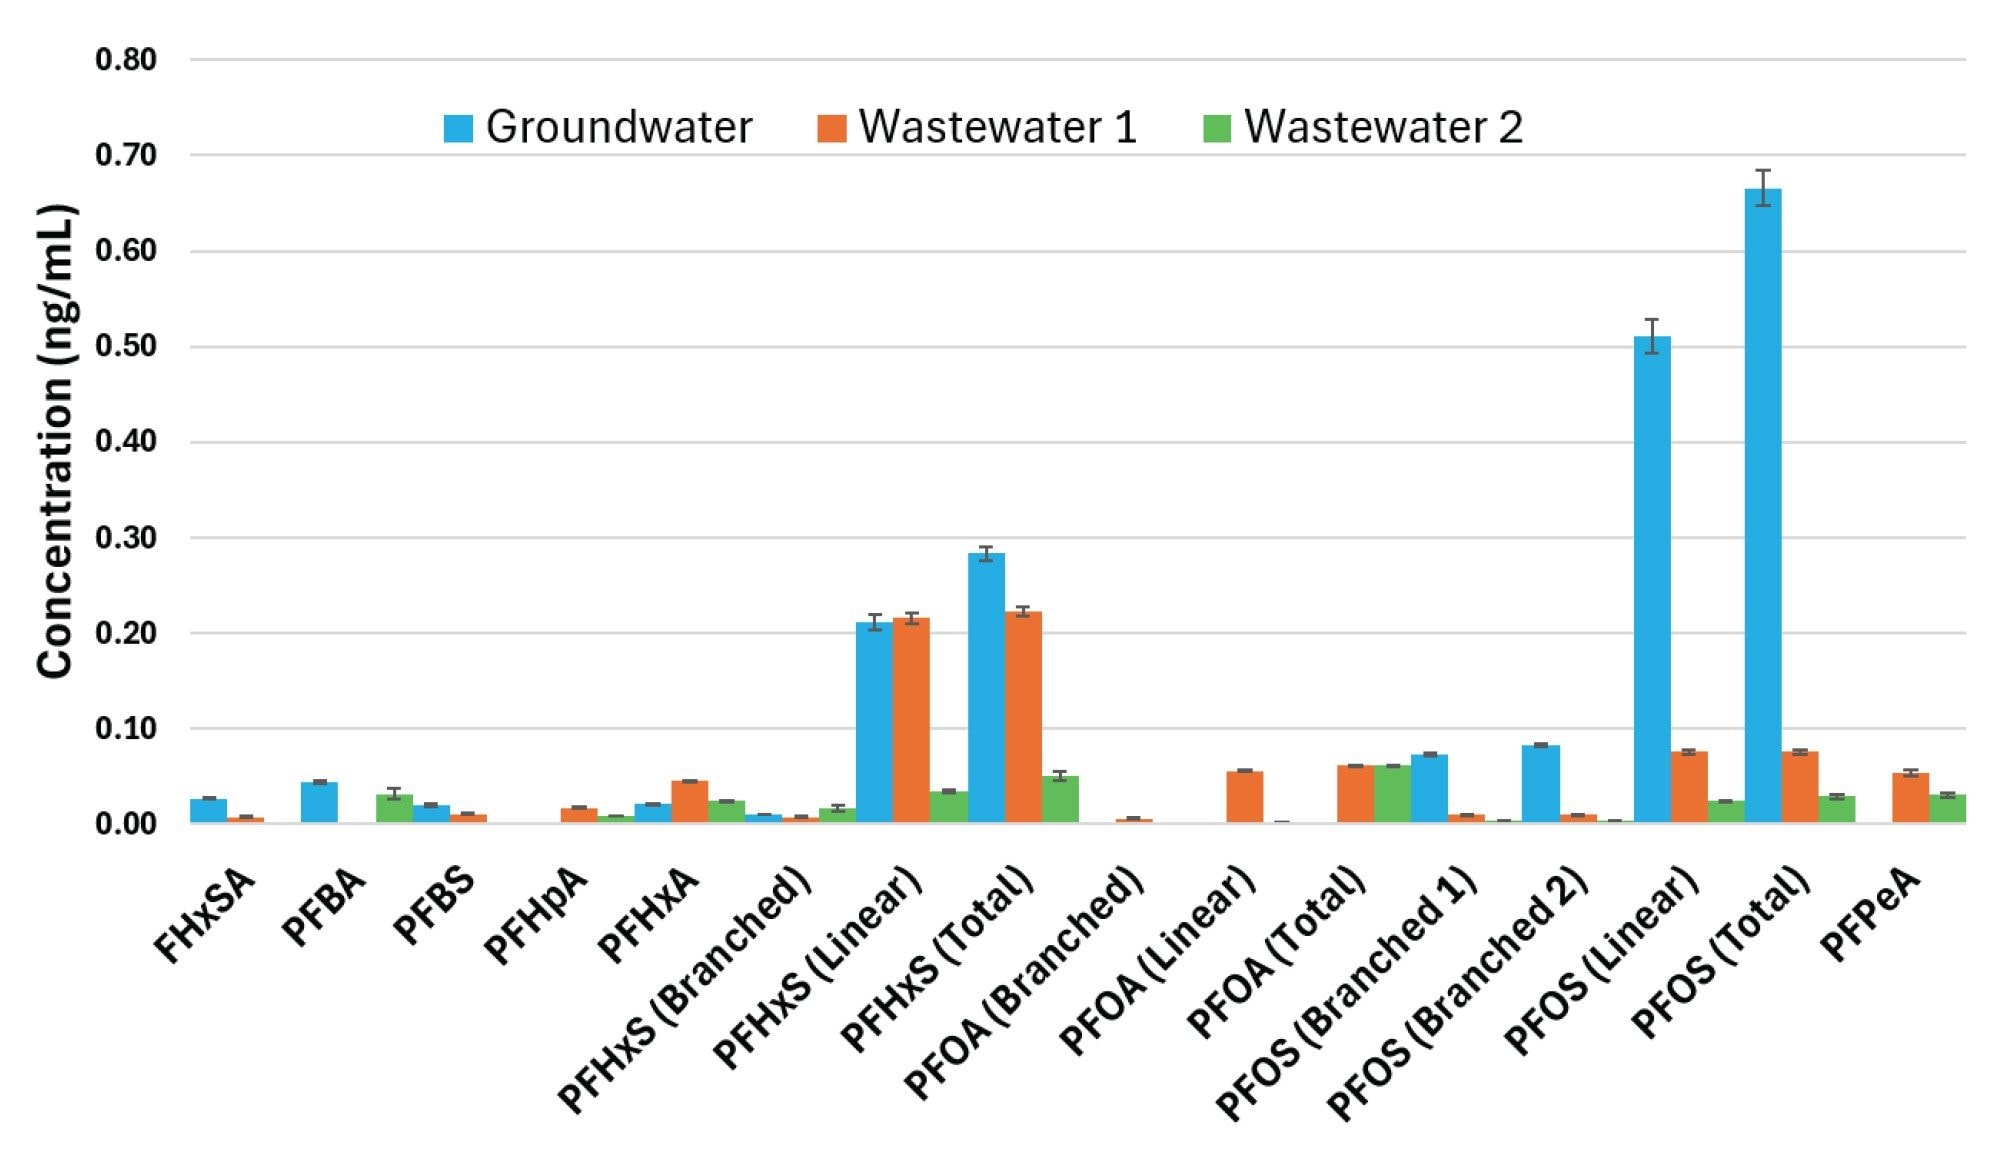
Table 1. Groundwater
*Below calculated LOQ
Tables 1-3. Summarized results for all samples analyzed.
Table 2. Wastewater 1
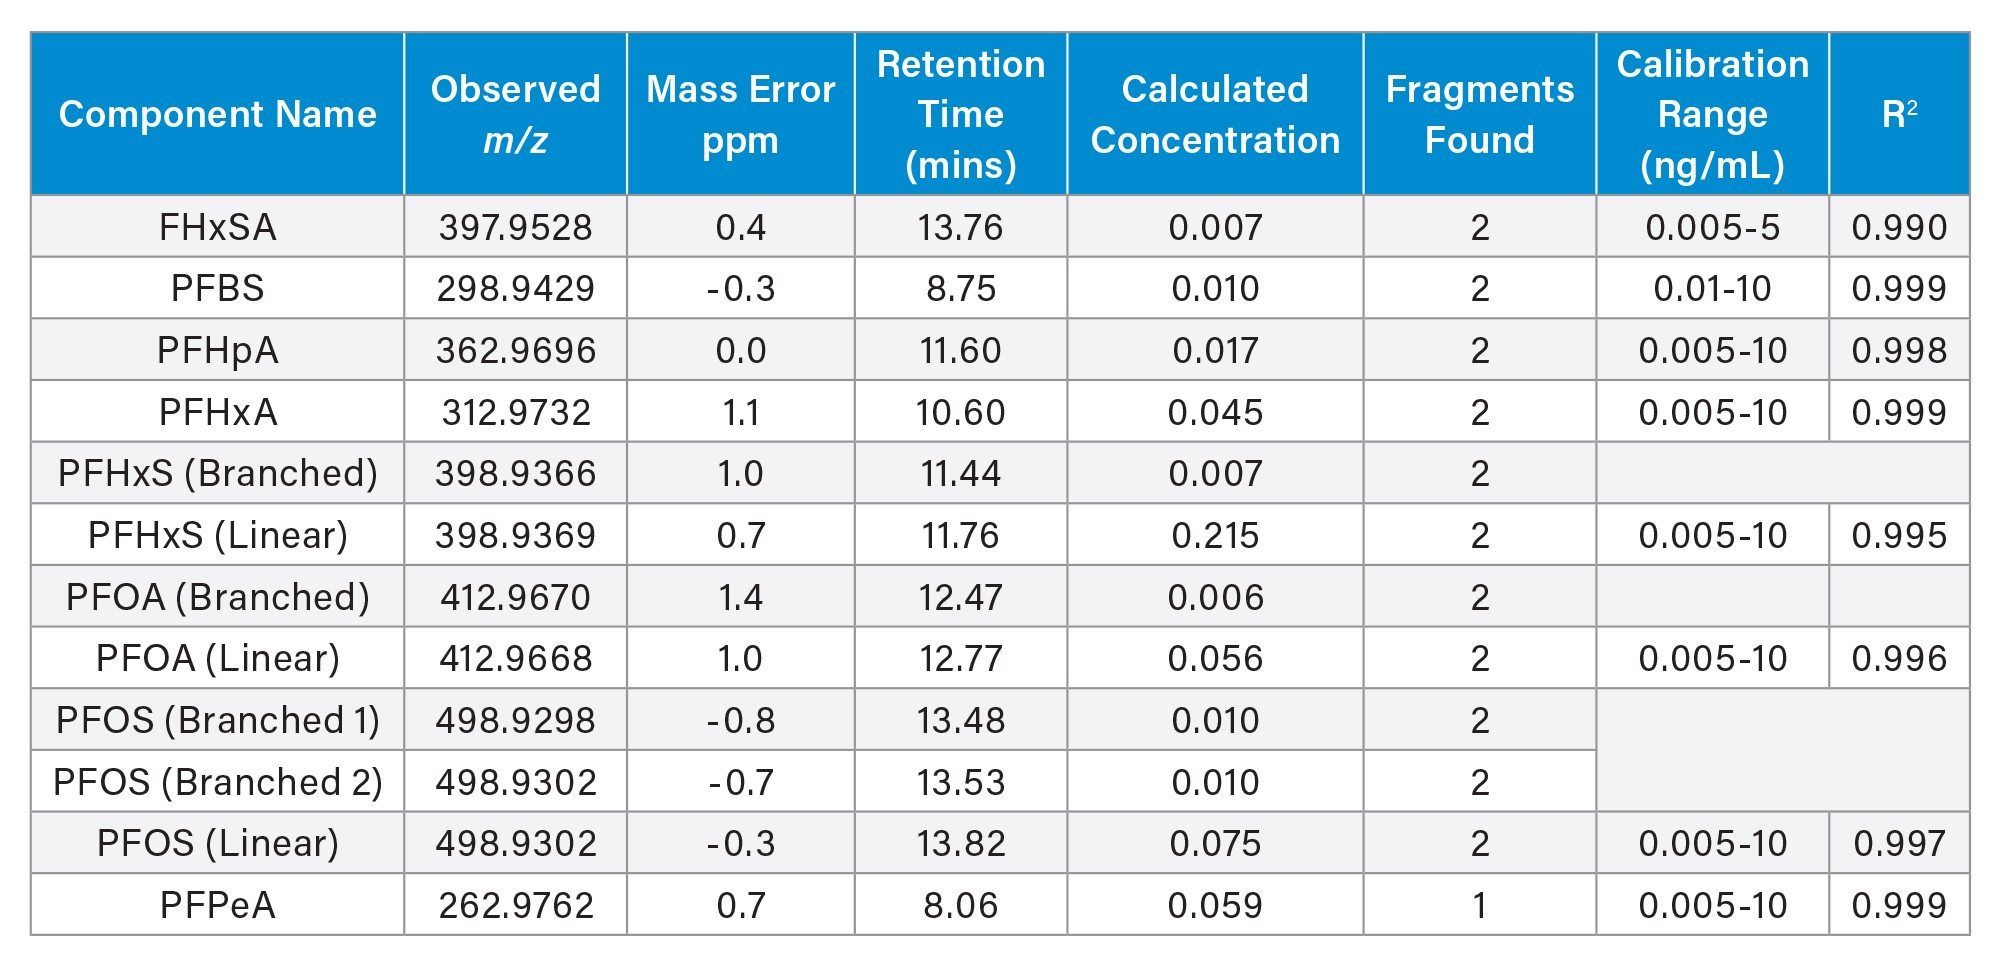
Table 3. Wastewater 2
Additional Untargeted Screening Using Pattern Analysis Application
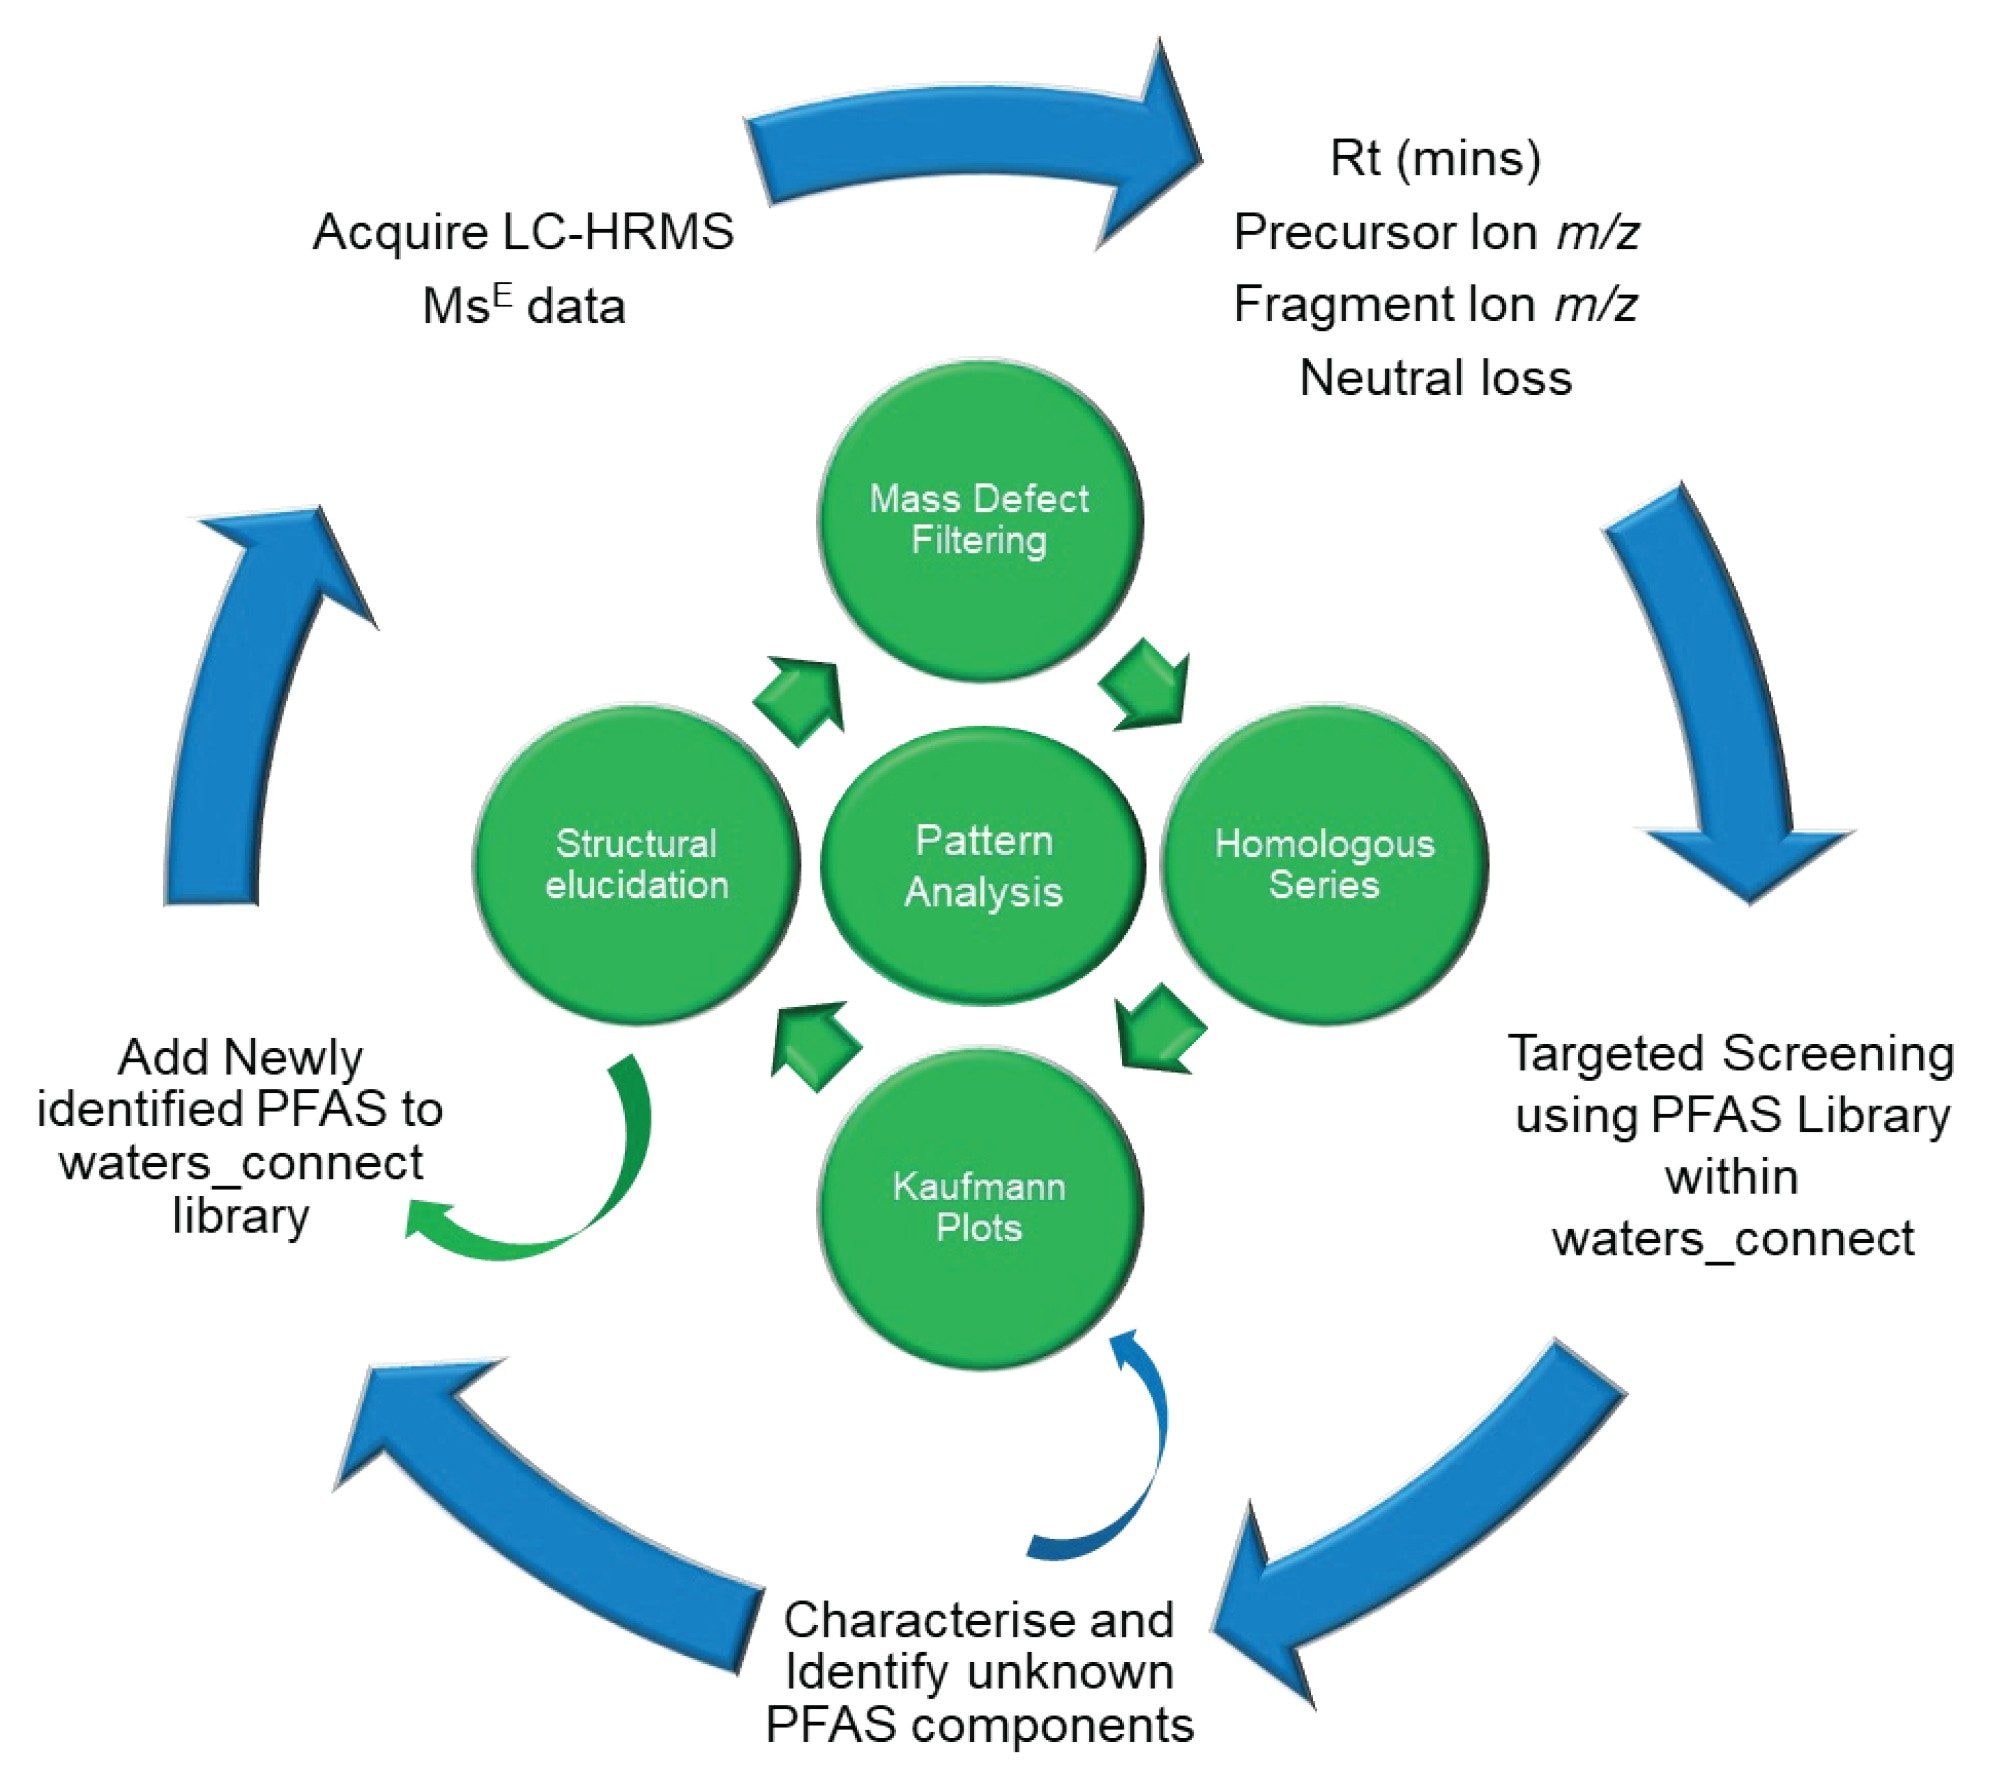
The pattern analysis application derives additional downstream outcomes from the primary data, where criteria are set to perform additional data processing of the “unknowns” data imported from waters_connect Software. Kaufmann proposed “kaufmann plots” as a single step non-targeted strategy to detect PFAS using a plot of (m/C versus md/C), where mass (m), carbon number (C), mass defect (md) with a two-dimensional graph (m/C versus md/C) to suspected PFAS. Kendrick mass defect is increasingly used in environmental sciences to differentiate natural organic matter from groups of environmental contaminants and can facilitate selection of potential features to be retained for PFAS suspect screening. Here, the kendrick mass defect are normalized to the CF2 repeat unit. As a result, features from the same class of compounds will be distinguished on the KMD plot as they form a straight line, aiding the differentiation between natural compounds and anthropogenic PFAS compounds.7 (Figure 2).
WW2 was selected as an example of the untargeted screening using pattern analysis application. Using the screening parameters detailed above, a total of 298 components were present in the sample above a response threshold of 500. Using the pattern analysis application filtering criteria, including mass defect filtering, five compounds were highlighted. All targets satisfy the mass defect criteria while assignments 1 and 5 do not satisfy the ‘m/z : CE’ criteria. This is due to no detected C13 ion measurement for these compounds making a carbon estimate calculation impossible. These targets were assigned as PFAS-C2H3O2 nominally labeled here “1-5” by increasing retention time (Figure 3). A common fragment was detected for peak 4 only, likely due to it being the highest intensity peak of the five detected and therefore more likely to have a fragment of sufficient intensity to be detected.
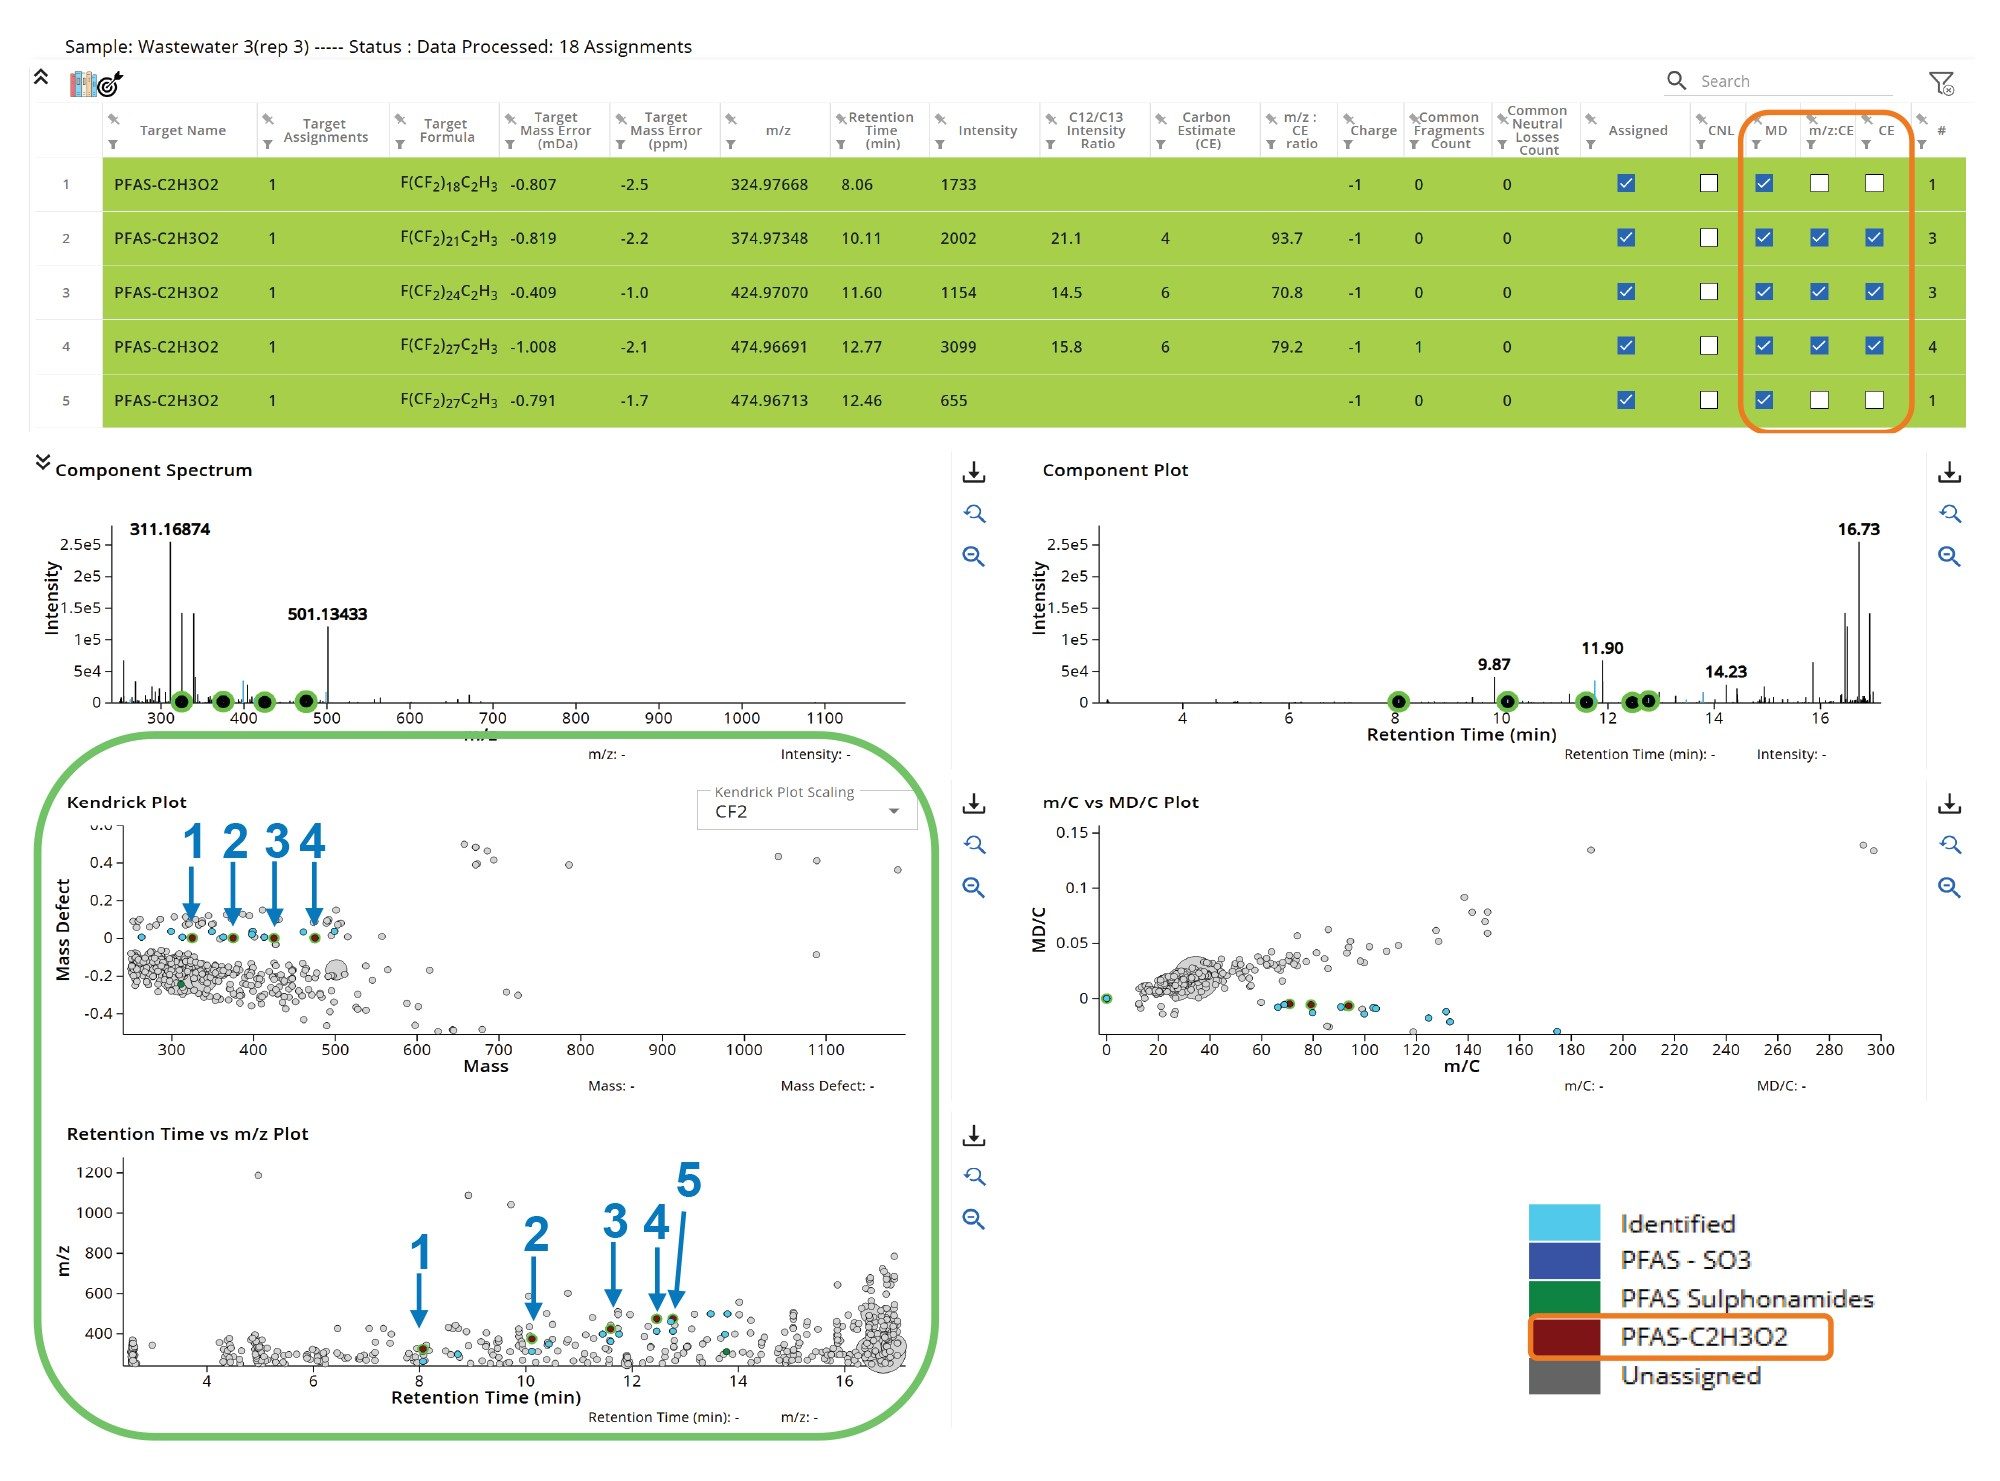
While five clear targets were present on the retention time plot, only four were apparent on the Kendrick plot scaled for mass defect setting. Components 4 and 5 had similar accurate mass measurements and closely eluted, i.e., 12.46 and 12.77 minutes, respectively. Filtering out the results for the compounds of interest reveals peaks 4 and 5 clearly distinguished in the Kendrick plot, inferring that both are isomers with the earlier eluting peak 4 a branched isomer of the later eluting linear species (Figure 4). Branched PFAS are common isomers and they are low abundance impurities that are less retained on a reversed-phase column, thus eluting earlier than their linear counterpart. The branched species has a more compact structure and can also exhibit a higher dipole slightly increasing its polarity and therefore more readily eluted in reversed-phase chromatography. 8,9
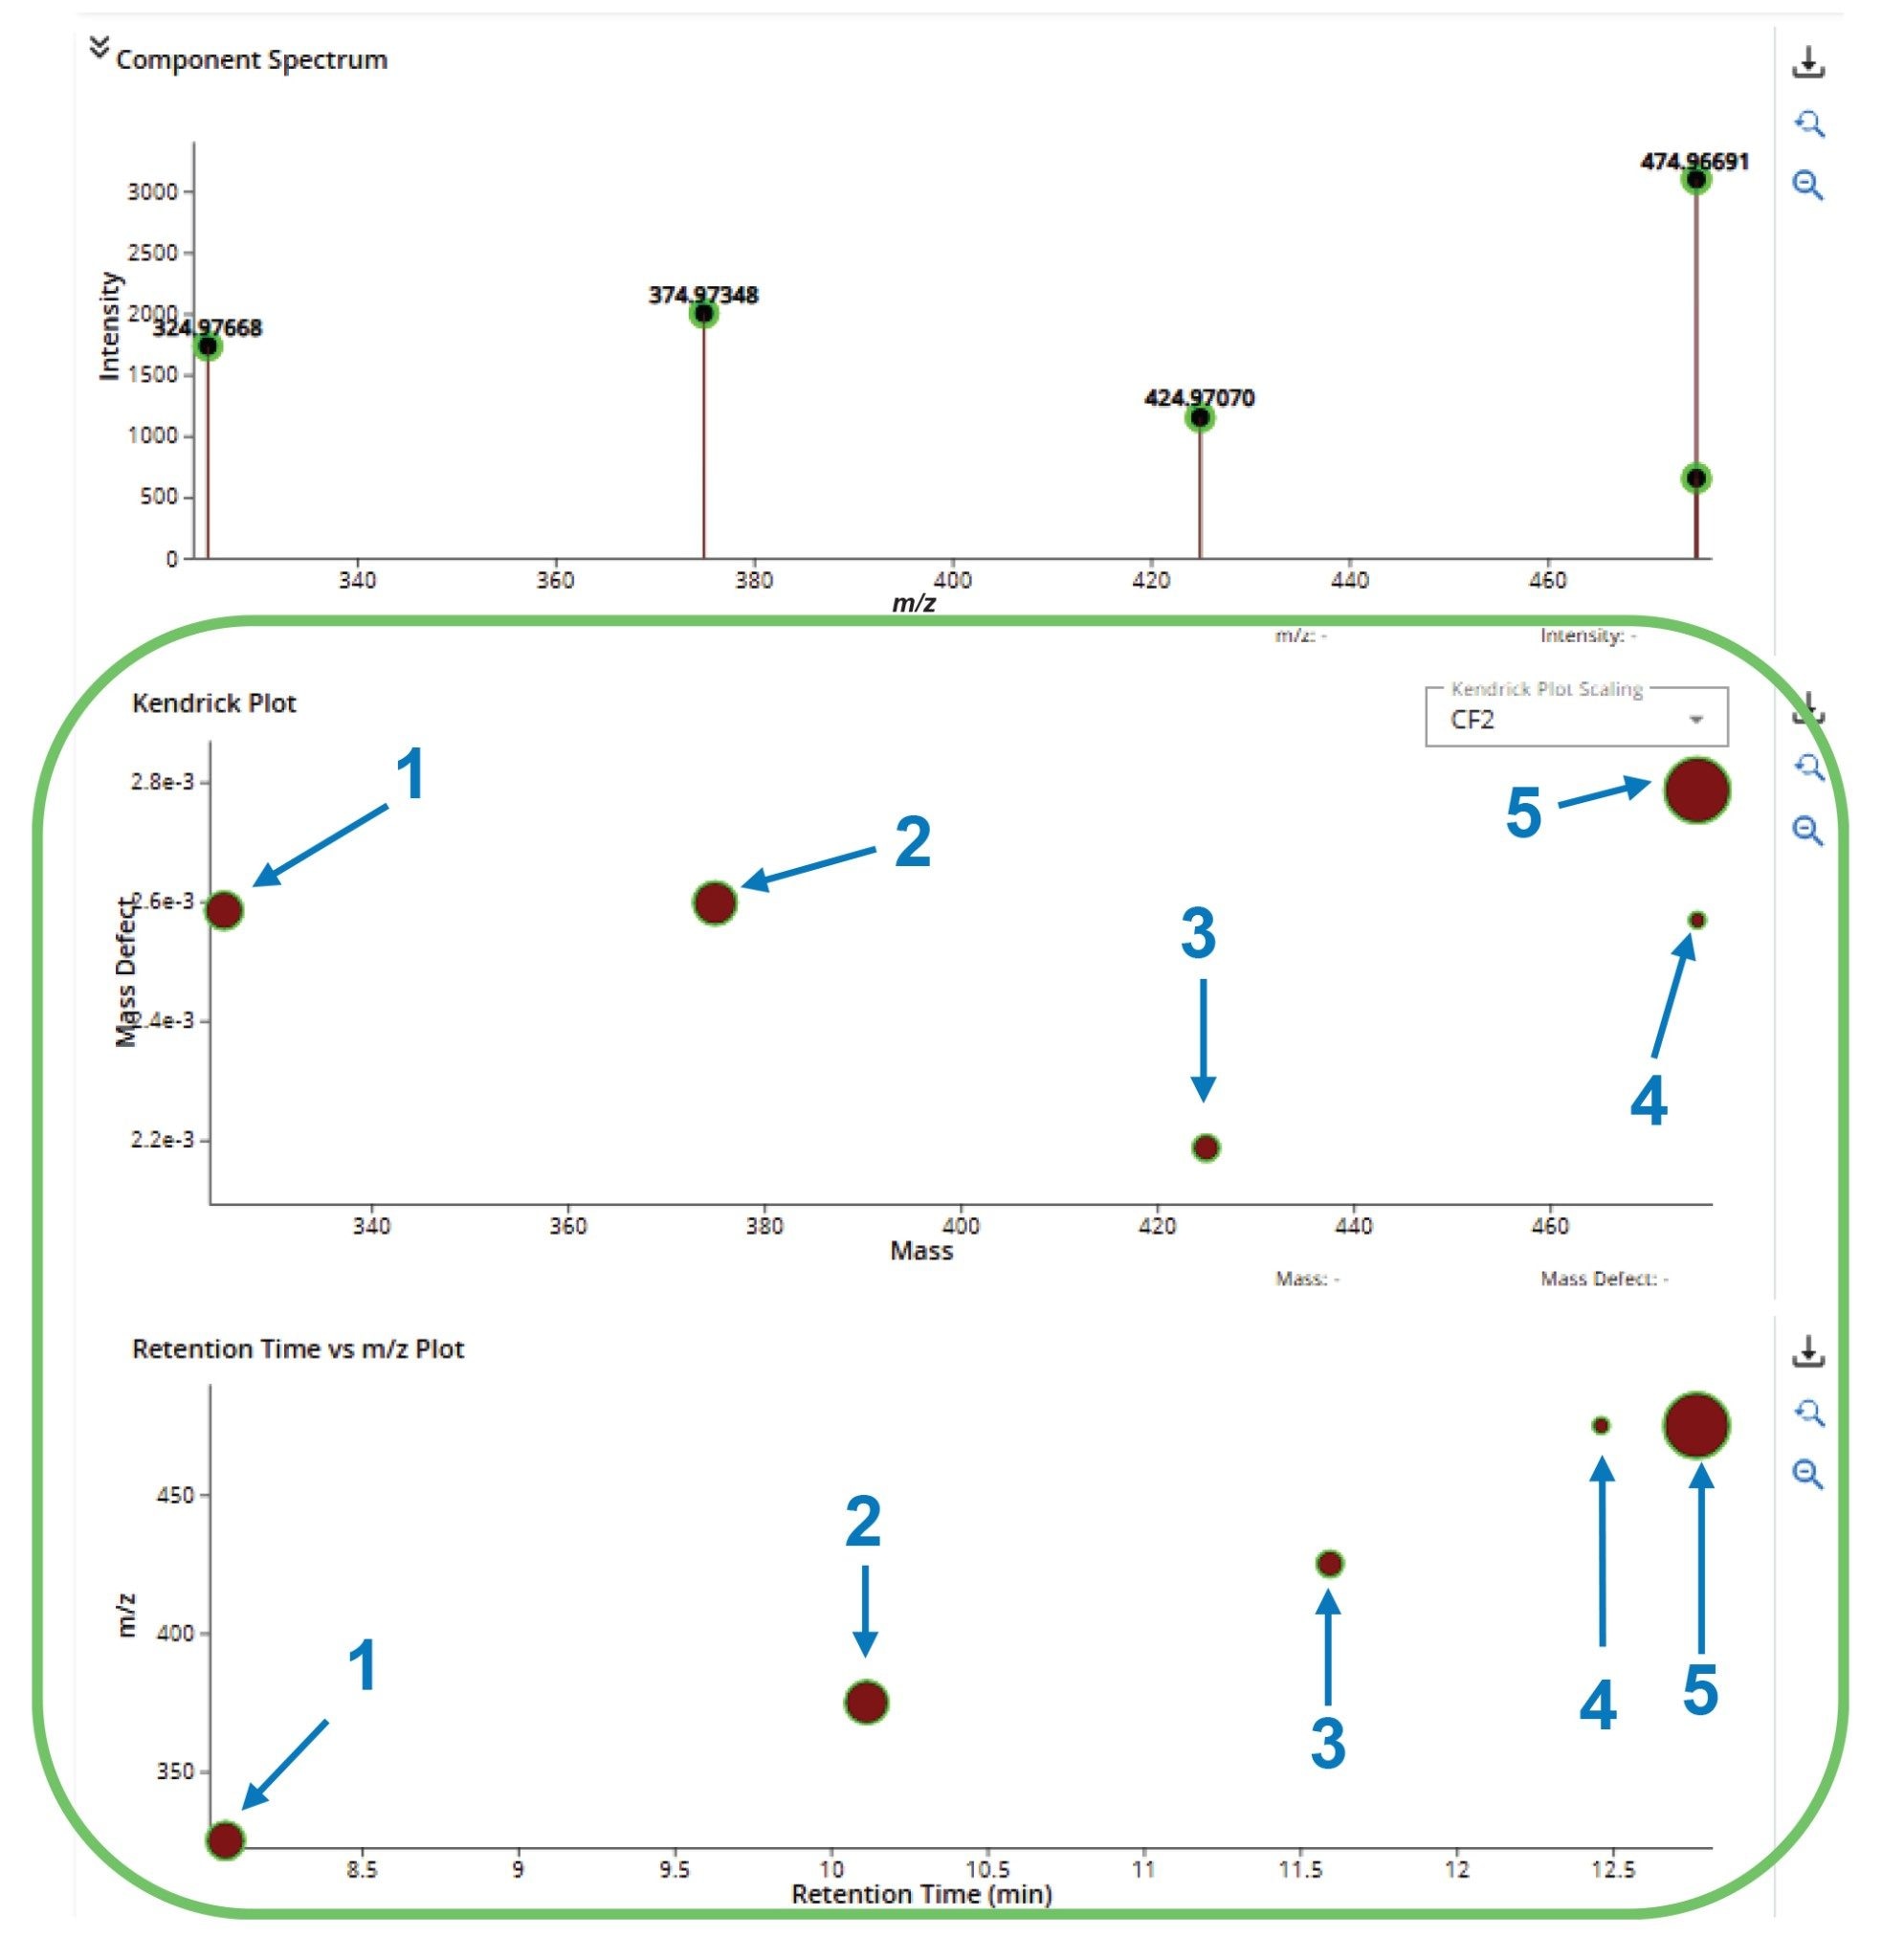
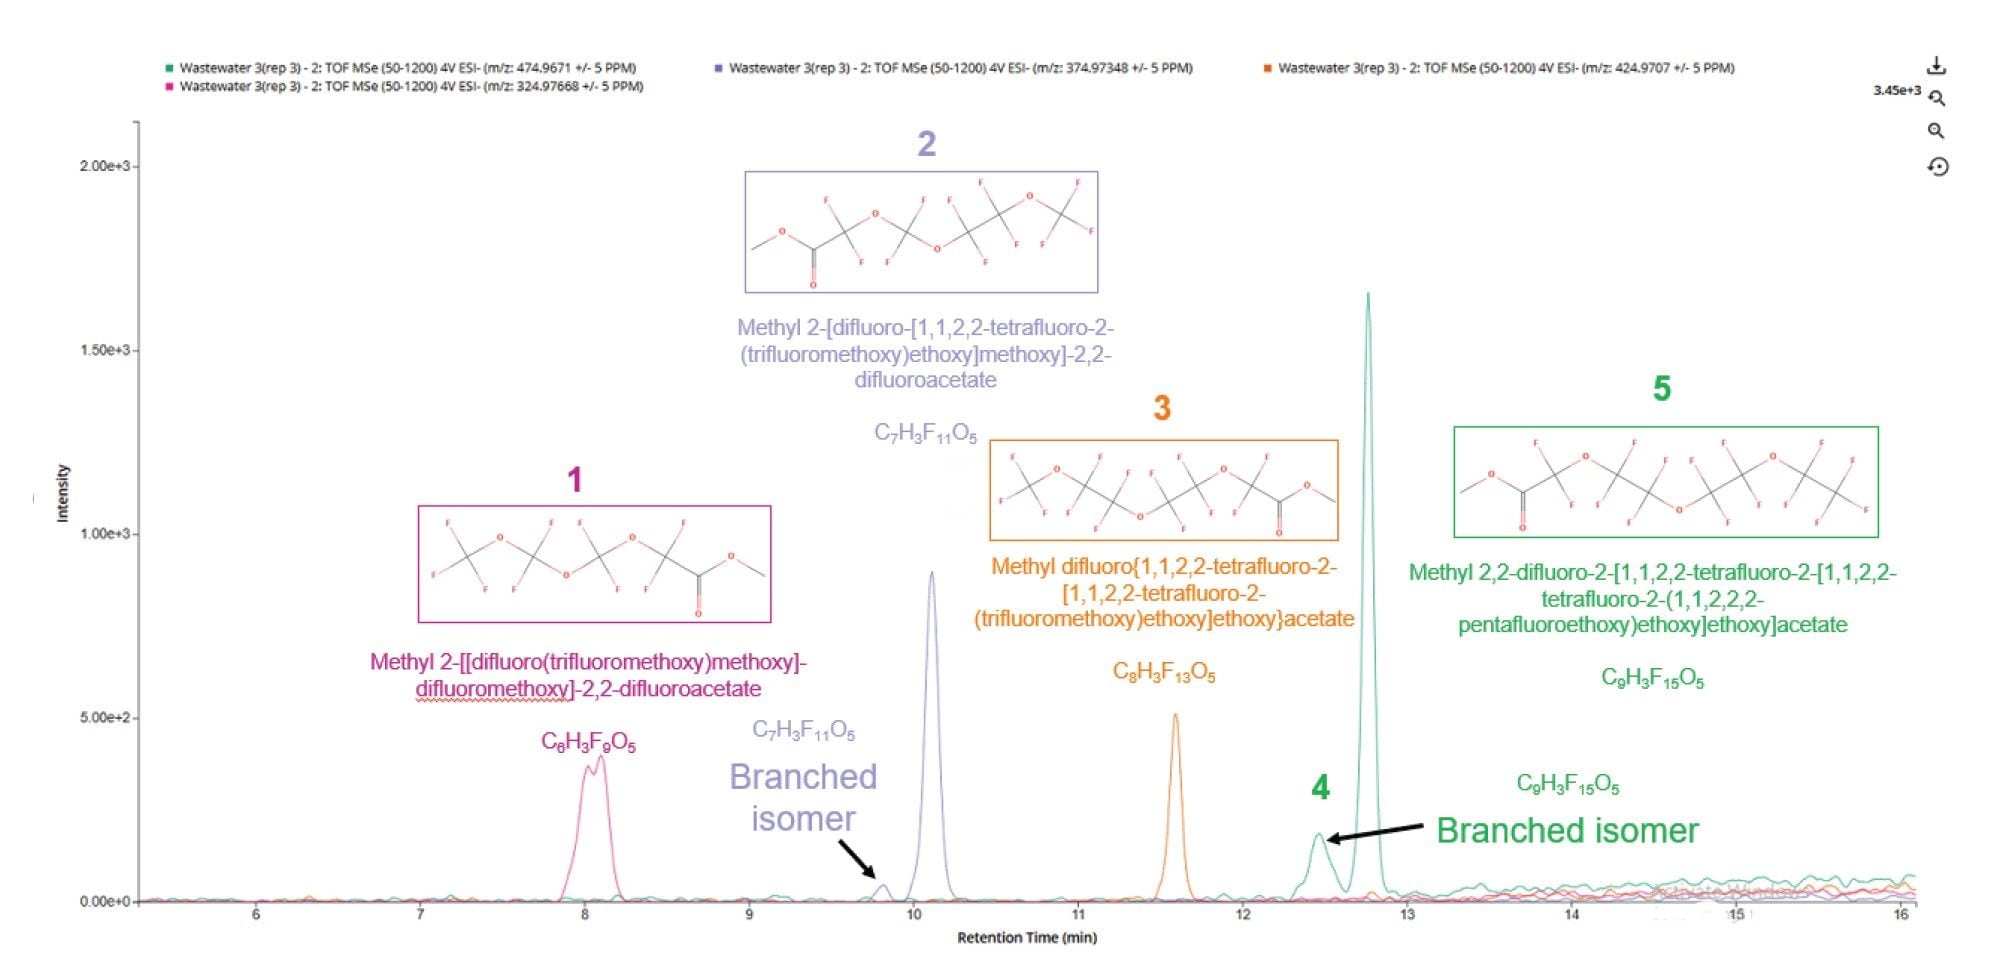
Figure 5 depicts the extracted ion chromatograms (XIC’s) for each compound of interest. XIC’s for peaks 2 and 4 further support the presence of branched isomer present. The branched form of peak 2 has not been detected by the Pattern Analysis software as it is lower than the 500-threshold filter set. In addition,. peak 5 has a clear peak preceding it which could feasibly correspond to a branched isomer.
In an attempt to annotate these components, the EPA database was queried; however, the database search did not return any relevant matches for the detected targets. Therefore, the formulas returned by Pattern Analysis app were searched using PubChem. PubChem search pointed out a compelling potential homologous series of unsaturated difluoroacetate PFAS. i.e., (1) C6H3F9O5, (2) C7H3F11O5, (3) C8H3F13O5 and C9H3F15O5 (linear and branched), enabling the putative assignment of Methyl 2-[[difluoro(trifluoromethoxy)methoxy]-difluoromethoxy]-2,2-difluoroacetate, Methyl 2-[difluoro-[1,1,2,2-tetrafluoro-2-(trifluoromethoxy)ethoxy]methoxy]-2,2-difluoroacetate and Methyldifluoro{1,1,2,2-tetrafluoro-2-[1,1,2,2-tetrafluoro-2-(trifluoromethoxy)ethoxy]ethoxy}acetate, compounds 1-5 respectively.
Confirmation of these putative assignments would require matching against a known standard matching retention time, fragment pattern and m/z ratio and is not covered in this work.
Conclusion
Using targeted library-based workflows, known PFAS have been identified and quantified in all samples tested. Using DIA, precursor and fragment ions were collected in one analysis for confident, rapid characterization. Water samples were analyzed by direct injection, reducing the bias of sample preparation methods. The instrument performance with sub 2 ppm mass accuracy measurements increase the confidence of identification.
Complementary untargeted screening using the pattern analysis application provided a further layer of analytical scrutiny, enabling the putative identification of five members of a homologous PFAS series with mass errors ranging between -1.0 and -2.5 ppm. The relatively high ppm error of -2.5 (peak 1) can be attributed to the low intensity of this compound which leads inevitably to poor ion statistics, i.e., as the signal approaches the baseline detection limit the standard error in ppm naturally widens.10
This was achieved purely on the physical properties of perfluorinated analytes with the software designed to clearly distinguish between those species already detected using UNIFI Software.
By combining quantitative performance with comprehensive screening capabilities, the Xevo G3 QTof Mass Spectrometer provides environmental testing laboratories with a future-proof solution for monitoring POPs, supporting regulatory compliance, environmental risk assessment, and contaminant discovery in water and wastewater matrices.
References
- Ferreira, A. Persistent Organic Pollutants in Humans and Wildlife: Emerging Issues for Environmental and Public Health. August 2013. Revista UNIANDRADE 14(2):103-119 DOI:10.18024/1519-5694/revuniandrade.v14n2 p103-119.
- Montano, L.; et al. Polychlorinated Biphenyls (PCBs) in the Environment: Occupational and Exposure Events, Effects on Human Health and Fertility. Toxics. 2022 Jul 1;10(7):365. doi: 10.3390/toxics10070365. PMID: 35878270; PMCID: PMC9323099.
- Islam, A.; et al. Per- and polyfluoroalkyl substances (PFAS) contamination in agriculture and its potential conflict with circular economy, Environmental Pollution, Volume 385, 2025,127036, ISSN 0269-7491,https://doi.org/10.1016/j.envpol.2025.127036.
- Matheson, A. The Column: PFAS Researchers Call for Access to PFAS Reference Standards from Manufacturers. LCGC, June 2025,Volume 21, Issue2. https://www.chromatographyonline.com/view/the-column-pfas-researchers-call-for-access-to-pfas-reference-standards-from-manufacturers#.
- Zhang, F.; Ge, W.; Huang, L. A Comparative Analysis of Data Analysis Tools for Data-Independent Acquisition Mass Spectrometry Molecular & Cellular Proteomics, 2023; 22. doi: 10.1016/j.mcpro.2023.100623.
- Zweigle, J.; Bugsel, B.; Zwiener, C. Find PFAS: Non-Target Screening for PFAS─Comprehensive Data Mining for MS2 Fragment Mass Differences. Anal Chem. 2022 Aug 2;94(30):10788-10796. doi: 10.1021/acs.analchem.2c01521. Epub 2022 Jul 22. PMID: 35866933; PMCID: PMC9354793.
- McCullagh, S.; Adams, S.; Gowshawk, J. Combining Pattern Analysis and Cyclic Ion Mobility Mass Spectrometry to Research Per-and Poly Fluoroalkyl Substances (PFAS) Exposure in E-waste Handlers. (April 2025), Waters Application Note 720008784.
- Schulz, K.; Silva, M.R.; Klaper, R.; et al. Distribution and effects of branched versus linear isomers of PFOA, PFOS, and PFHxS: A review of recent literature, Science of The Total Environment, Volume 733, 2020, 139186, ISSN 0048-9697, https://doi.org/10.1016/j.scitotenv.2020.139186. (https://www.sciencedirect.com/science/article/pii/S0048969720327030).
- Dodds, J.N.; Hopkins, Z.R.; Knappe, D.R.U.; Baker, E.S. Rapid Characterization of Per- and Polyfluoroalkyl Substances (PFAS) by Ion Mobility Spectrometry-Mass Spectrometry (IMS-MS). Anal Chem. 2020 Mar 17;92(6):4427-4435. doi:10.1021/acs.analchem.9b05364. Epub 2020 Feb 24. PMID: 32011866; PMCID: PMC7173758.
- The Mass Spectrometry Primer: Mass Accuracy and Resolution. https://www.waters.com/nextgen/global/education/primers/the-mass-spectrometry-primer/mass-accuracy-and-resolution.html.
720009527, August 2026


