
RPLC/HILIC Orthogonal Impurity Profiling of Glucagon-like Peptide-1 (GLP-1) Analogs Using LC-UV/MS Workflows
Duanduan Han, Robert E. Birdsall, Nikhil Bhiwankar
Waters Corporation, United States
Published on September 28, 2026

Abstract
The rapid expansion of GLP-1 analogs has increased the need for analytical strategies that provide robust impurity characterization while remaining practical for implementation across development and quality workflows. As peptide therapeutics become increasingly complex, reversed-phase liquid chromatography (RPLC) remains a foundational separation technique due to its robustness and widespread adoption. However, RPLC can exhibit limited selectivity for impurity classes that differ only subtly in hydrophobicity from the native peptide, resulting in co-elution and incomplete impurity characterization. In this study, a streamlined column screening workflow that leverages the orthogonal selectivities of RPLC and hydrophilic interaction liquid chromatography (HILIC) to enhance impurity detection is demonstrated. HILIC separations exploit differences in polarity and hydrophilicity, providing complementary resolution of deamidation variants and other closely related impurities that are challenging to separate by RPLC alone. These results highlight the value of integrating orthogonal chromatographic selectivity into analytical strategies to improve impurity characterization, strengthen method understanding, and support the development of robust methods that can be efficiently translated across analytical activities throughout the therapeutic lifecycle.
Benefits
- Orthogonal chromatographic selectivity enables more comprehensive impurity monitoring and increases analytical confidence
- HILIC complements RPLC, enabling improved detection and resolution of impurities that may co-elute or are challenging to separate in traditional RPLC methods
- HILIC utilizes MS-compatible mobile phase and can be easily integrated into existing RPLC-UV/MS workflow
Introduction
GLP-1 analogs have rapidly transformed the landscape of type 2 diabetes and obesity treatment, driving unprecedented growth in the peptide therapeutic market. Development of administration routes, explorations of new clinical indications, and multi-agonist drug candidates increase manufacturing demands and places greater emphasis on analytical strategies that can ensure product safety, efficacy, and regulatory compliance with high confidence. To enhance pharmacokinetic performance, GLP-1 analogs are frequently engineered through amino acid substitution, fatty acid conjugation, and other structural modifications that improve resistance to in vivo enzymatic degradation and reduce physiological clearance rate.1 While these molecular innovations improve therapeutic efficacy, they also increase structural complexity and potential for product-related impurities including amino acid sequence variance and spontaneous, non-enzymatic post-translational modifications.
While RPLC remains the gold standard for peptide identification and impurity profiling as a highly effective method, it relies primarily on hydrophobic interactions and can exhibit limited selectivity for impurity species with subtle hydrophobic difference from the native peptide. As a result, critical impurities may co-elute or require lengthy method optimization and extended analysis times to achieve adequate resolution.
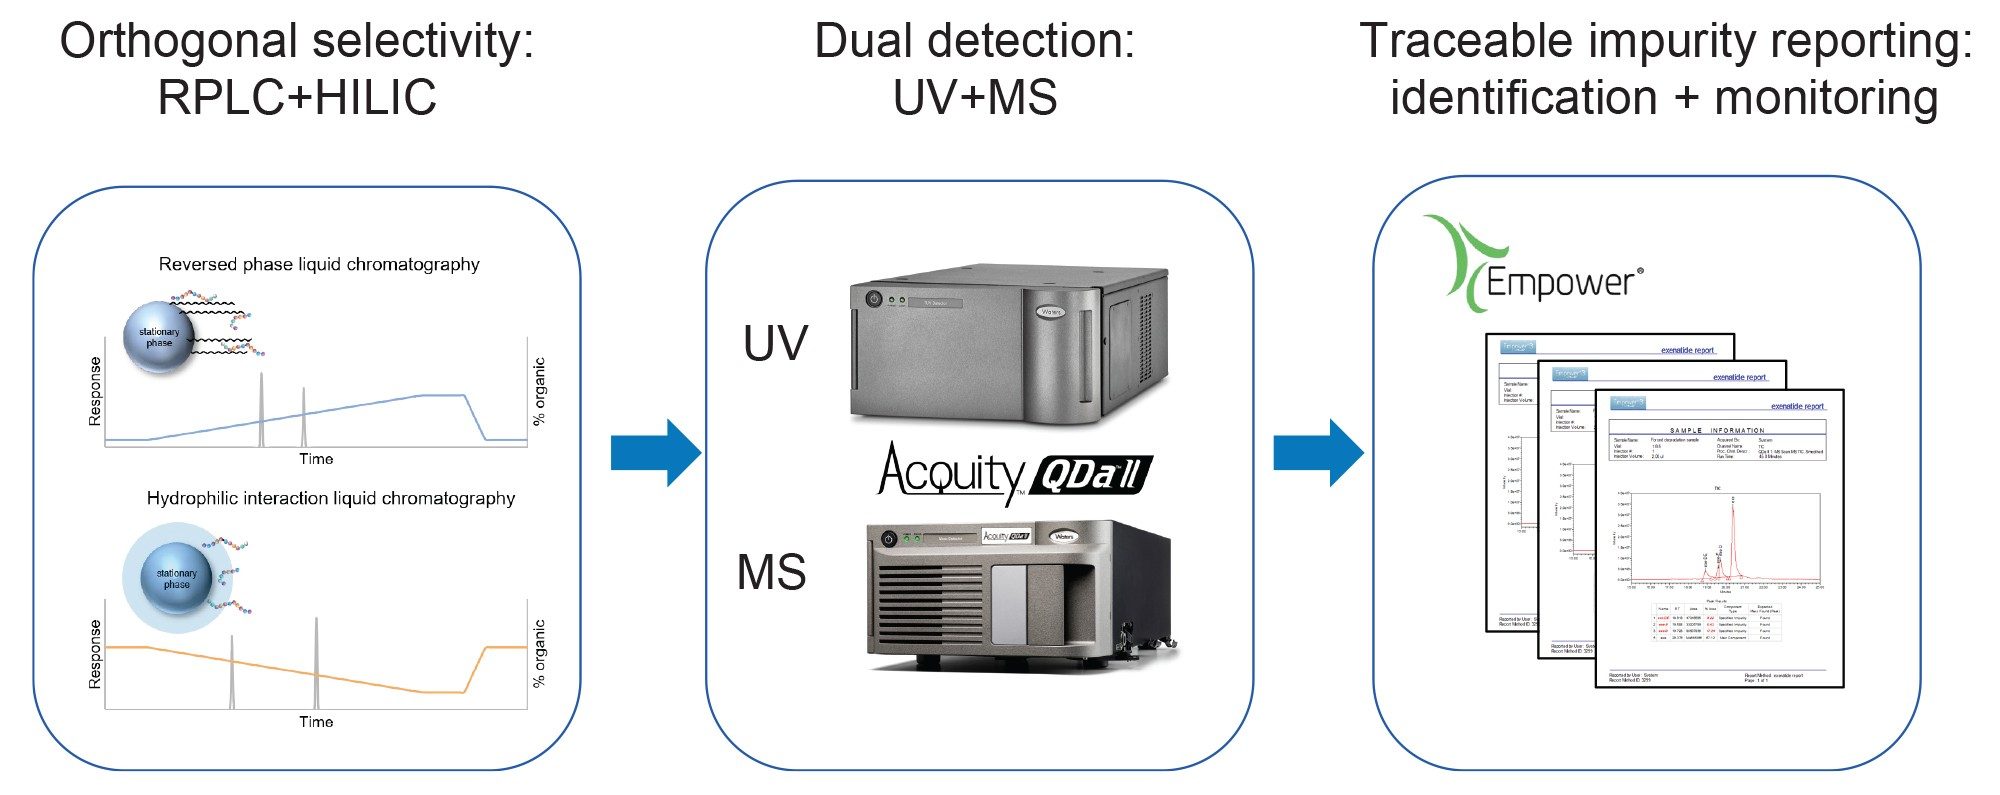
These limitations highlight the need for complementary analytical approaches that enhance impurity detection while supporting method development, transfer, and routine quality activities. HILIC offers orthogonal selectivity by separating analytes based on differences in polarity and hydrophilicity, making it a powerful complement to traditional RPLC workflows. An LC-UV/MS workflow is described for routine peptide impurity profiling integrating both RPLC and HILIC (Figure 1). Mass information strengthens peak identification through mass spectral matching. Empower™ Chromatography Data System (CDS) provides automated data processing, increasing confidence in impurity assessment and decision-making.
Experimental
Research-grade exenatide and deamidation species were purchased directly from vendors or custom-made. Exenatide and deamidation species stock solution was prepared at 1 mg/mL using acetate buffer at pH 4.5 and diluted to 0.25 mg/mL with diluent suitable for different separation modes. Forced degradation studies were performed in 0.1 M Tris-HCl buffer (pH 8) at 37 °C.
LC Conditions
|
LC system: |
ACQUITY™ Premier System with Quaternary Solvent Manager (QSM) |
|
Detection: |
TUV Detector, λ = 280 nm ACQUITY QDa™ II Mass Detector |
|
Chromatography software: |
Empower 3.8.1 |
ACQUITY QDa II Mass Detector Settings
|
Ionization mode: |
ESI+ |
|
Acquisition mode: |
Full scan |
|
Acquisition range: |
450–1500 m/z |
|
Scan rate: |
5 Hz |
|
Capillary voltage: |
0.8 kV |
|
Cone voltage: |
15 V |
|
Probe temperature: |
600 °C |
HILIC Separation: BEHTM HILIC Stationary Phase
|
Column: |
ACQUITY Premier BEH HILIC Column, 130 Å, 1.7 µm, 2.1 mm x 100 mm (p/n: 186010378) |
|
Column temperature: |
40 °C |
|
Sample: |
0.25 mg/mL in 50:50 ACN: pH 4.5 acetate buffer |
|
Sample temperature: |
10 °C |
|
Injection volume: |
2 µL |
|
Flow rate: |
0.3 mL/min |
|
Mobile phase: |
A: 50 mM ammonium formate, pH 2.8 adjusted with formic acid, in water B: 10 mM ammonium formate in 10:90 water:ACN |
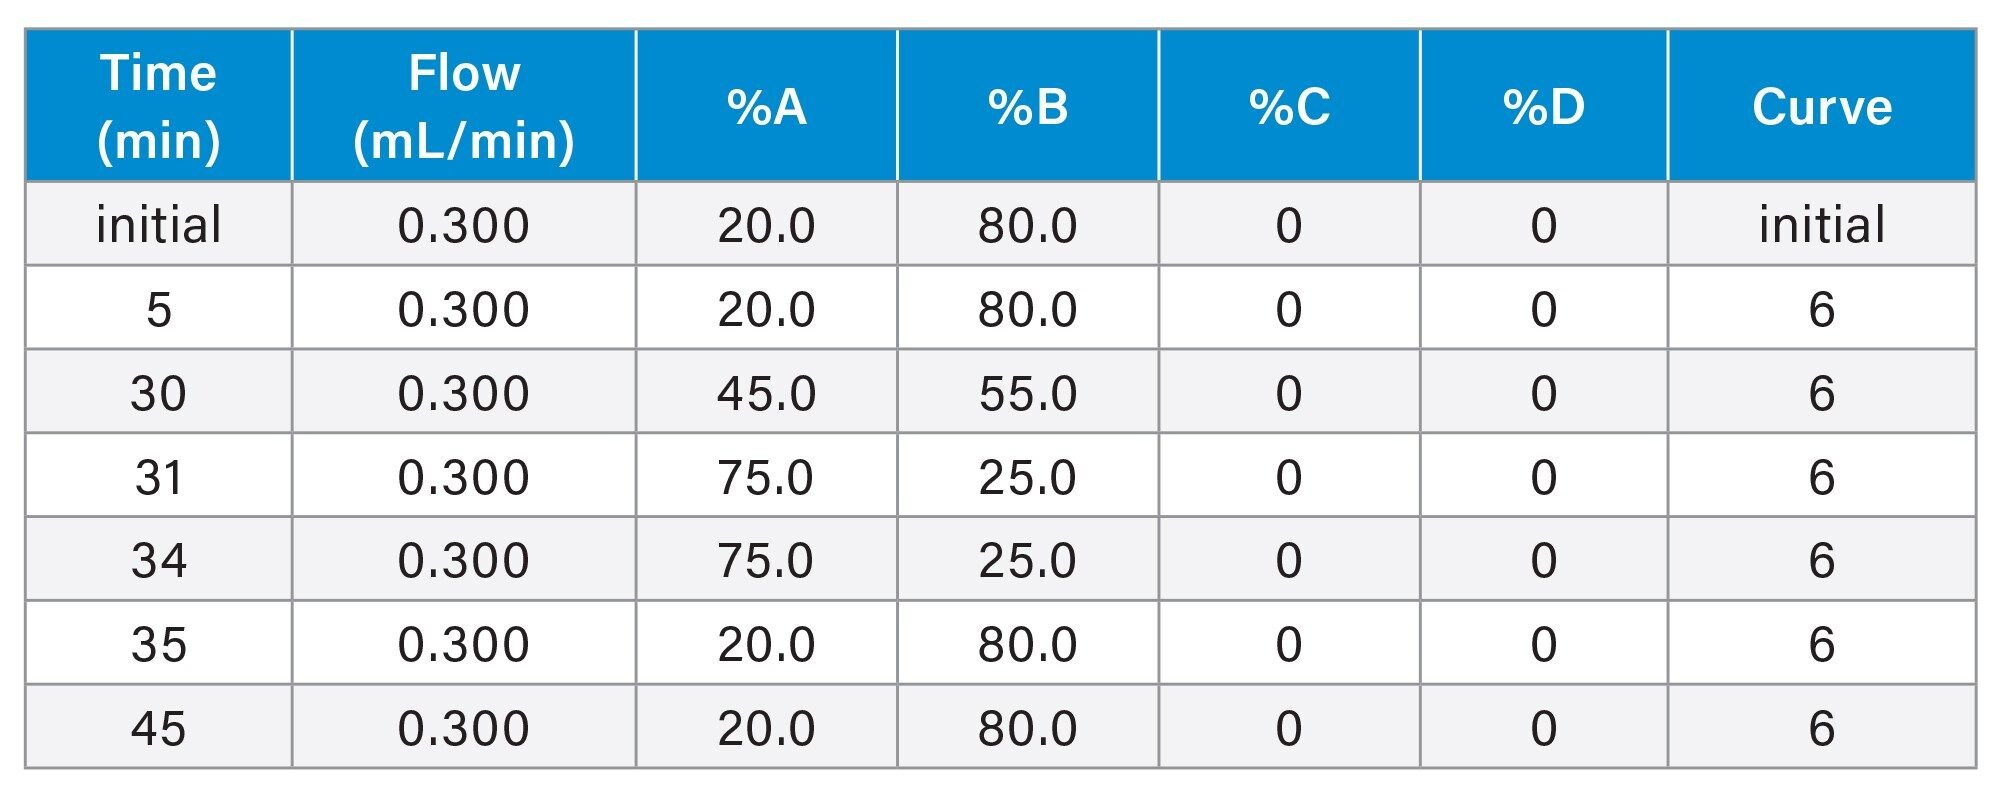
Gradient Table 1
HILIC Separation: BEH Amide Stationary Phase
|
Column: |
ACQUITY Premier BEH Amide Column, 130 Å, 1.7 µm, 2.1 mm x 150 mm (p/n: 186009506) |
|
Column temperature: |
40 °C |
|
Sample: |
0.25 mg/mL in 50:50 ACN: pH 4.5 acetate buffer |
|
Sample temperature: |
10 °C |
|
Injection volume: |
2 µL |
|
Flow rate: |
0.20 mL/min |
|
Mobile phase: |
A: 10 mM ammonium formate, in water, pH 3.1 adjusted with formic acid B: 10 mM ammonium formate in 10:90 water:ACN |
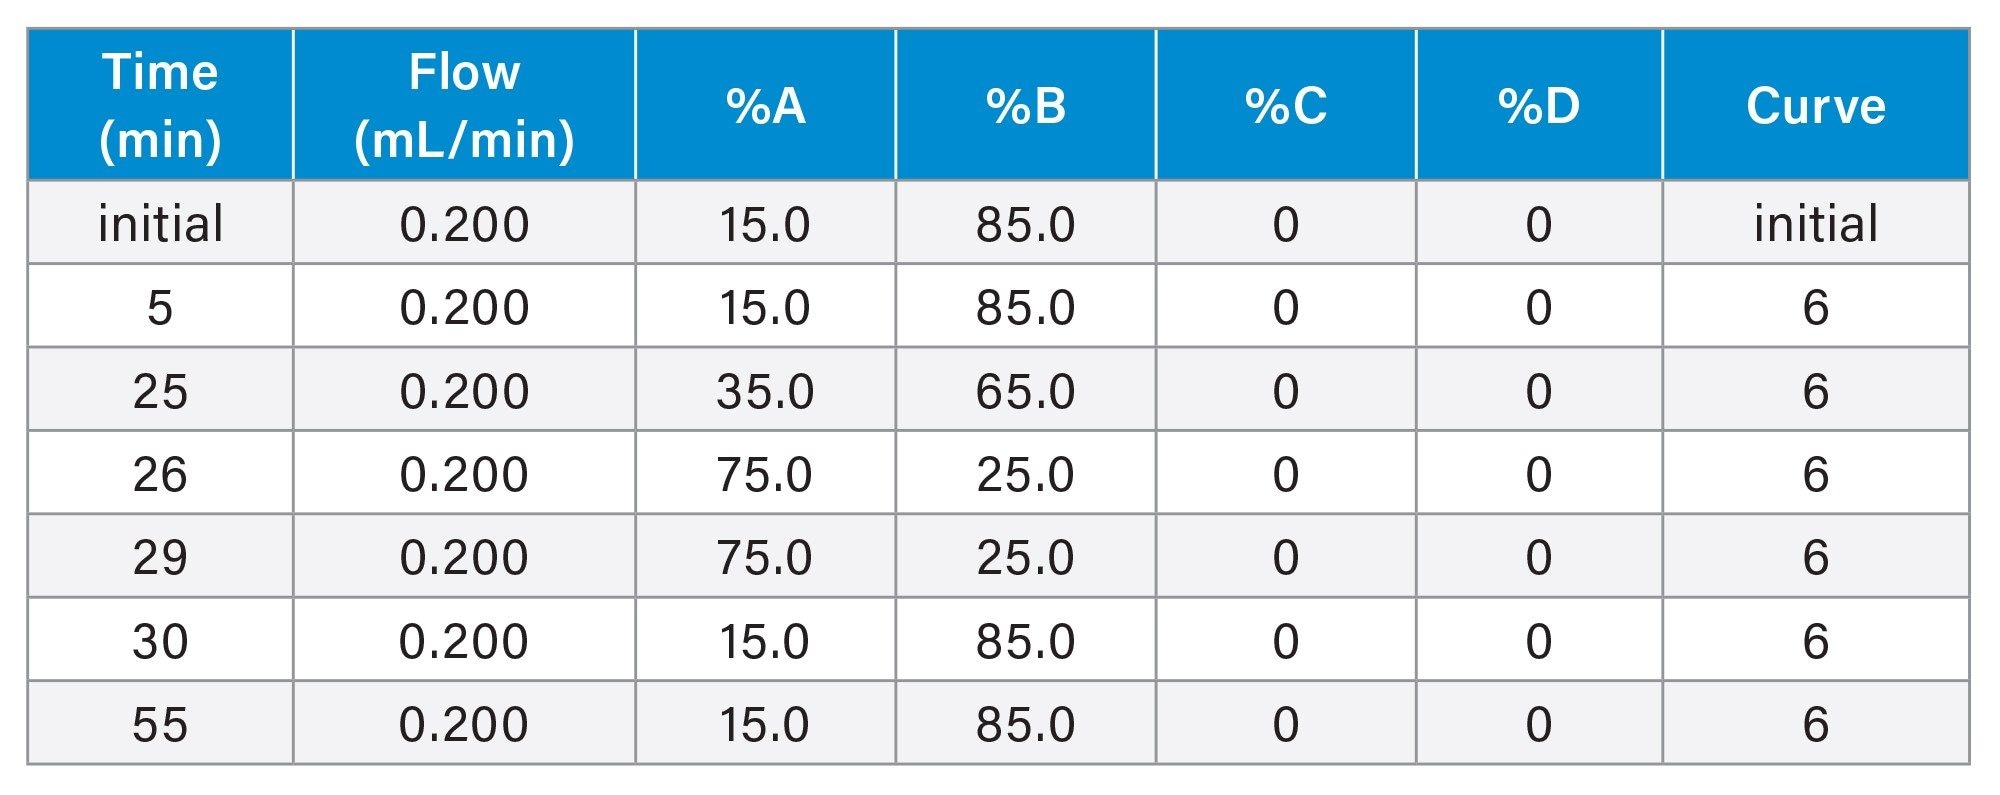
Gradient Table 2
RPLC Separation
|
Column: |
ACQUITY Premier Peptide CSH™ C18 Column, 130 Å, 1.7 µm, 2.1 x 100 mm (p/n: 186009488) |
|
Column temperature: |
60 °C |
|
Sample: |
0.25 mg/mL in pH 4.5 acetate buffer |
|
Sample temperarure: |
10 °C |
|
Injection volume: |
2 µL |
|
Flow rate: |
0.20 mL/min |
|
Mobile phase: |
A: 0.1% formic acid (v/v) in water B: 0.1% formic acid (v/v) in ACN |
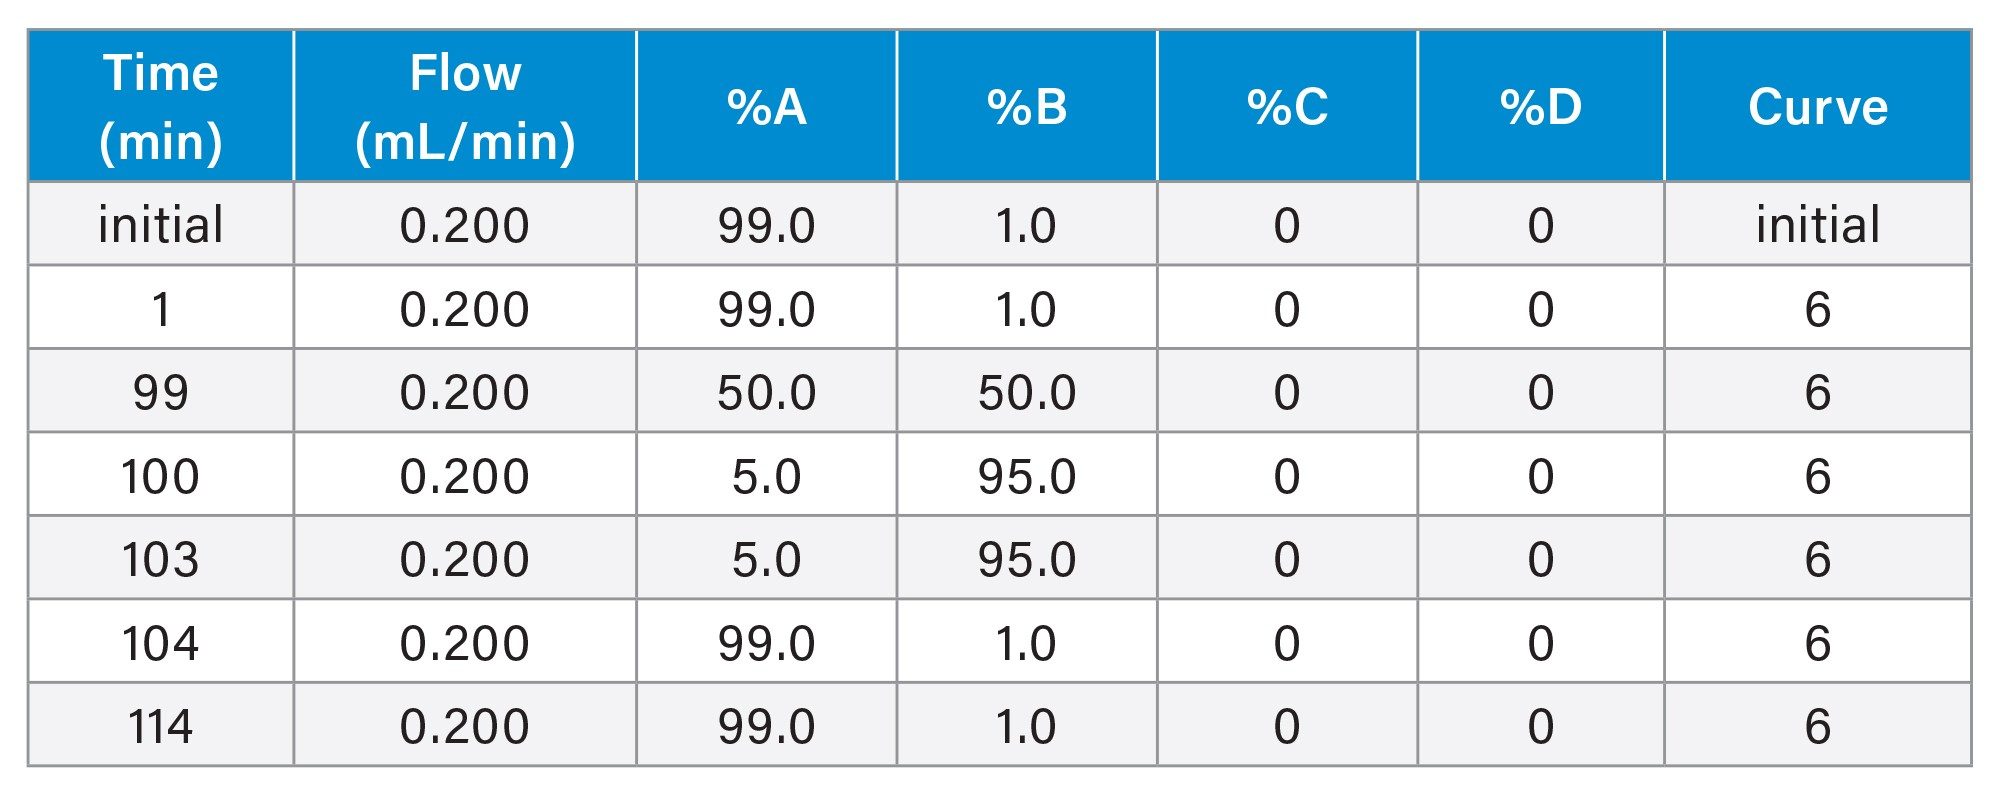
Gradient Table 3
Results and Discussion
Orthogonal Impurity Profiling
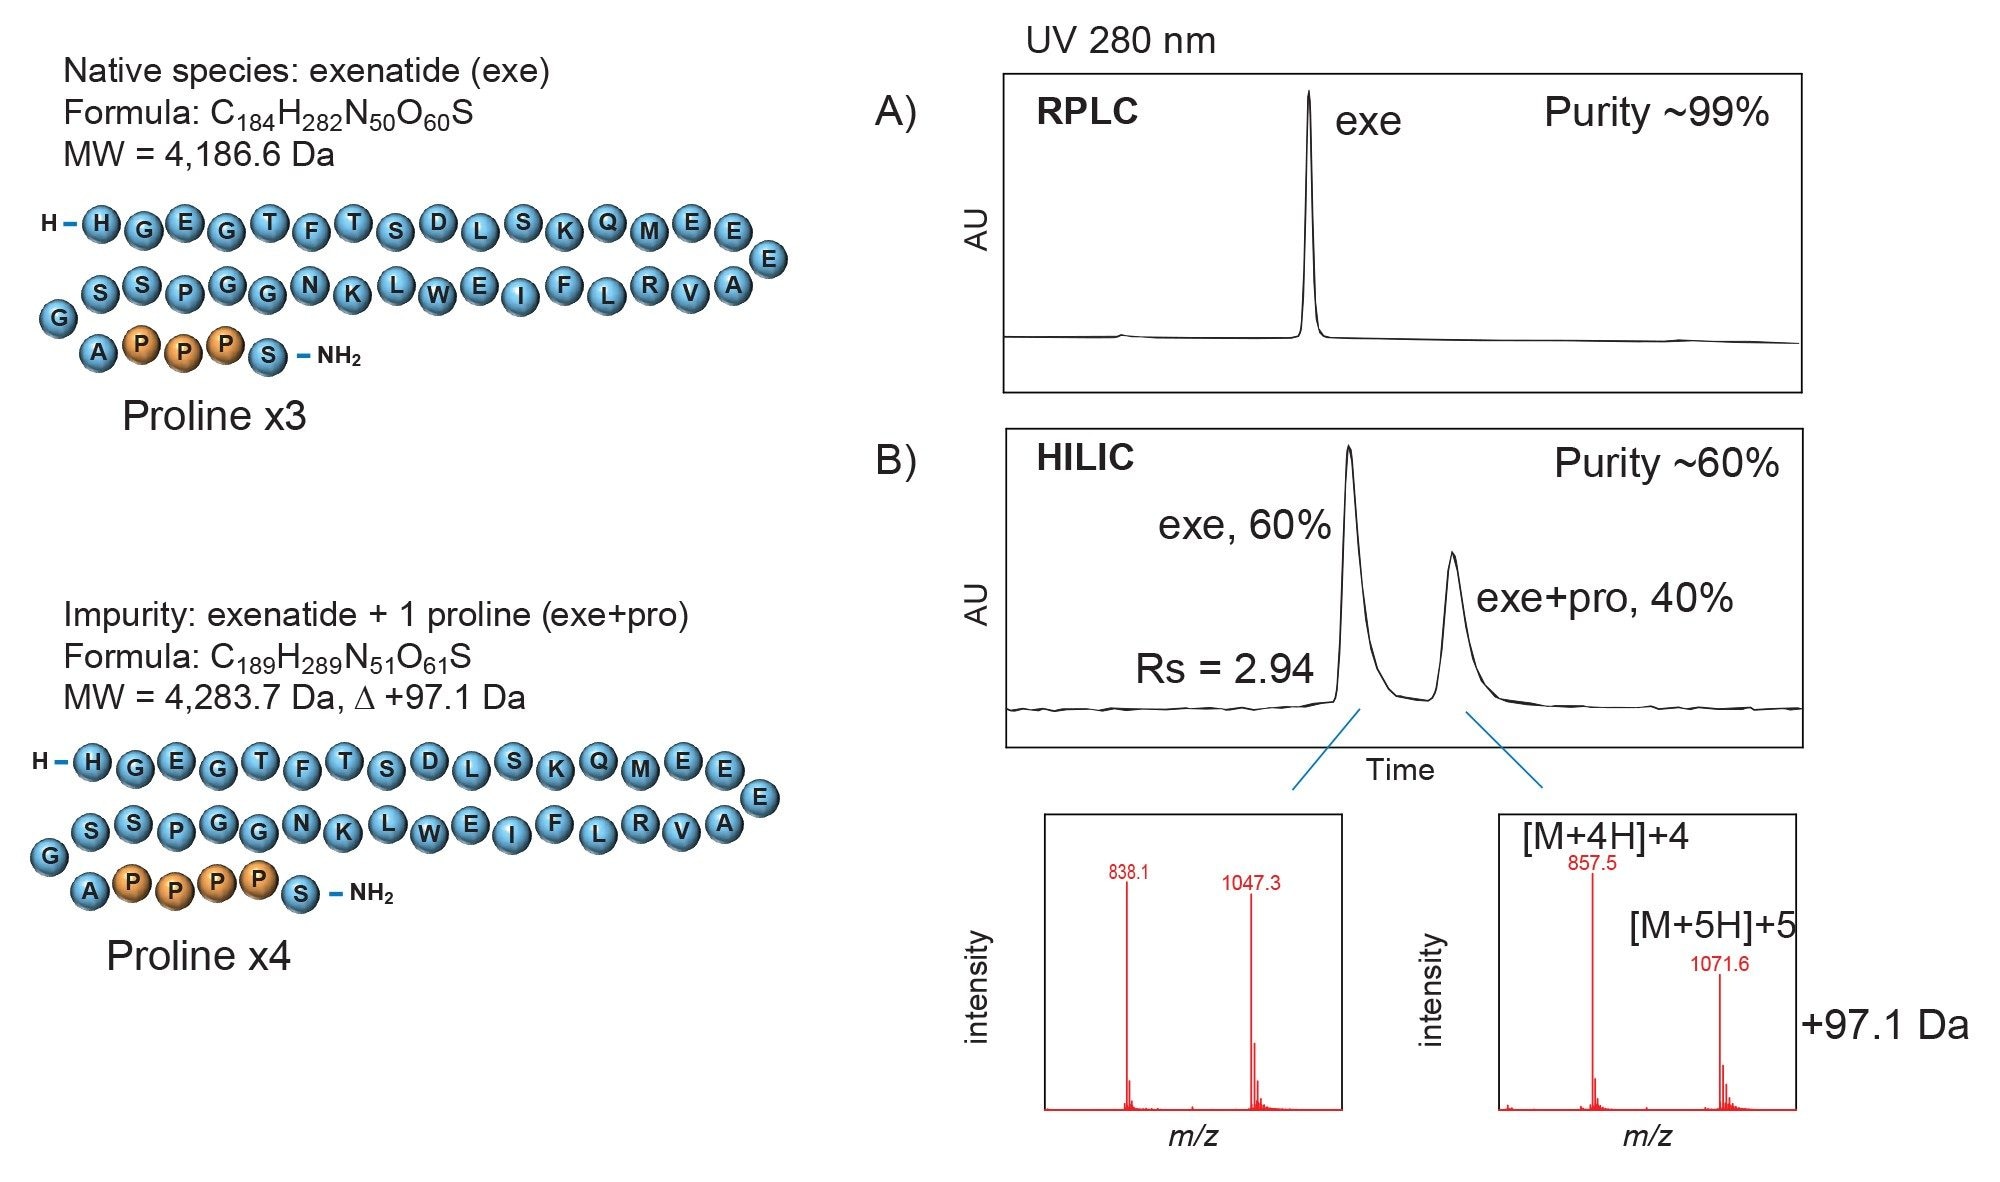
As part of routine raw material screening procedure, exenatide raw material was analyzed using an RPLC/UV-MS method. UV data confirmed 99% purity, which was consistent with the certificate of analysis. However, mass spectra revealed a significant co-eluting impurity (+97.1 Da) that accounts for 40% of total ion intensity not evident from UV assessment alone (Figure 2A). Sequence analysis identified this species as a proline insertion variant.2 This impurity presented significant challenges to resolve under reverse phase conditions. Extensive optimization efforts, including lower column temperatures and shallower gradient slopes, failed to achieve baseline separation without substantially increasing analysis time and compromising method robustness.
In contrast, HILIC readily achieved baseline resolution (Rs = 2.94) under a fast gradient (1% organic phase/minute) (Figure 2B). The proline insertion impurity exhibits greater retention than the native species, indicating increased hydrophilicity. This observation suggests analyte and stationary phase interaction under HILIC separation provides sufficient selectivity for baseline resolution.
This example demonstrates the value of incorporating techniques that offer orthogonal selectivity into routine raw material screening. By providing chromatographic selectivity that differs fundamentally from RPLC, HILIC can resolve impurities that may otherwise be overlooked during method development and routine analysis. Furthermore, HILIC separation can be achieved using volatile mobile phase additives (ammonium formate in this example), which provides compatibility with MS analysis and can readily be transferred to downstream workflows.
Resolution of Clinically Relevant Impurities
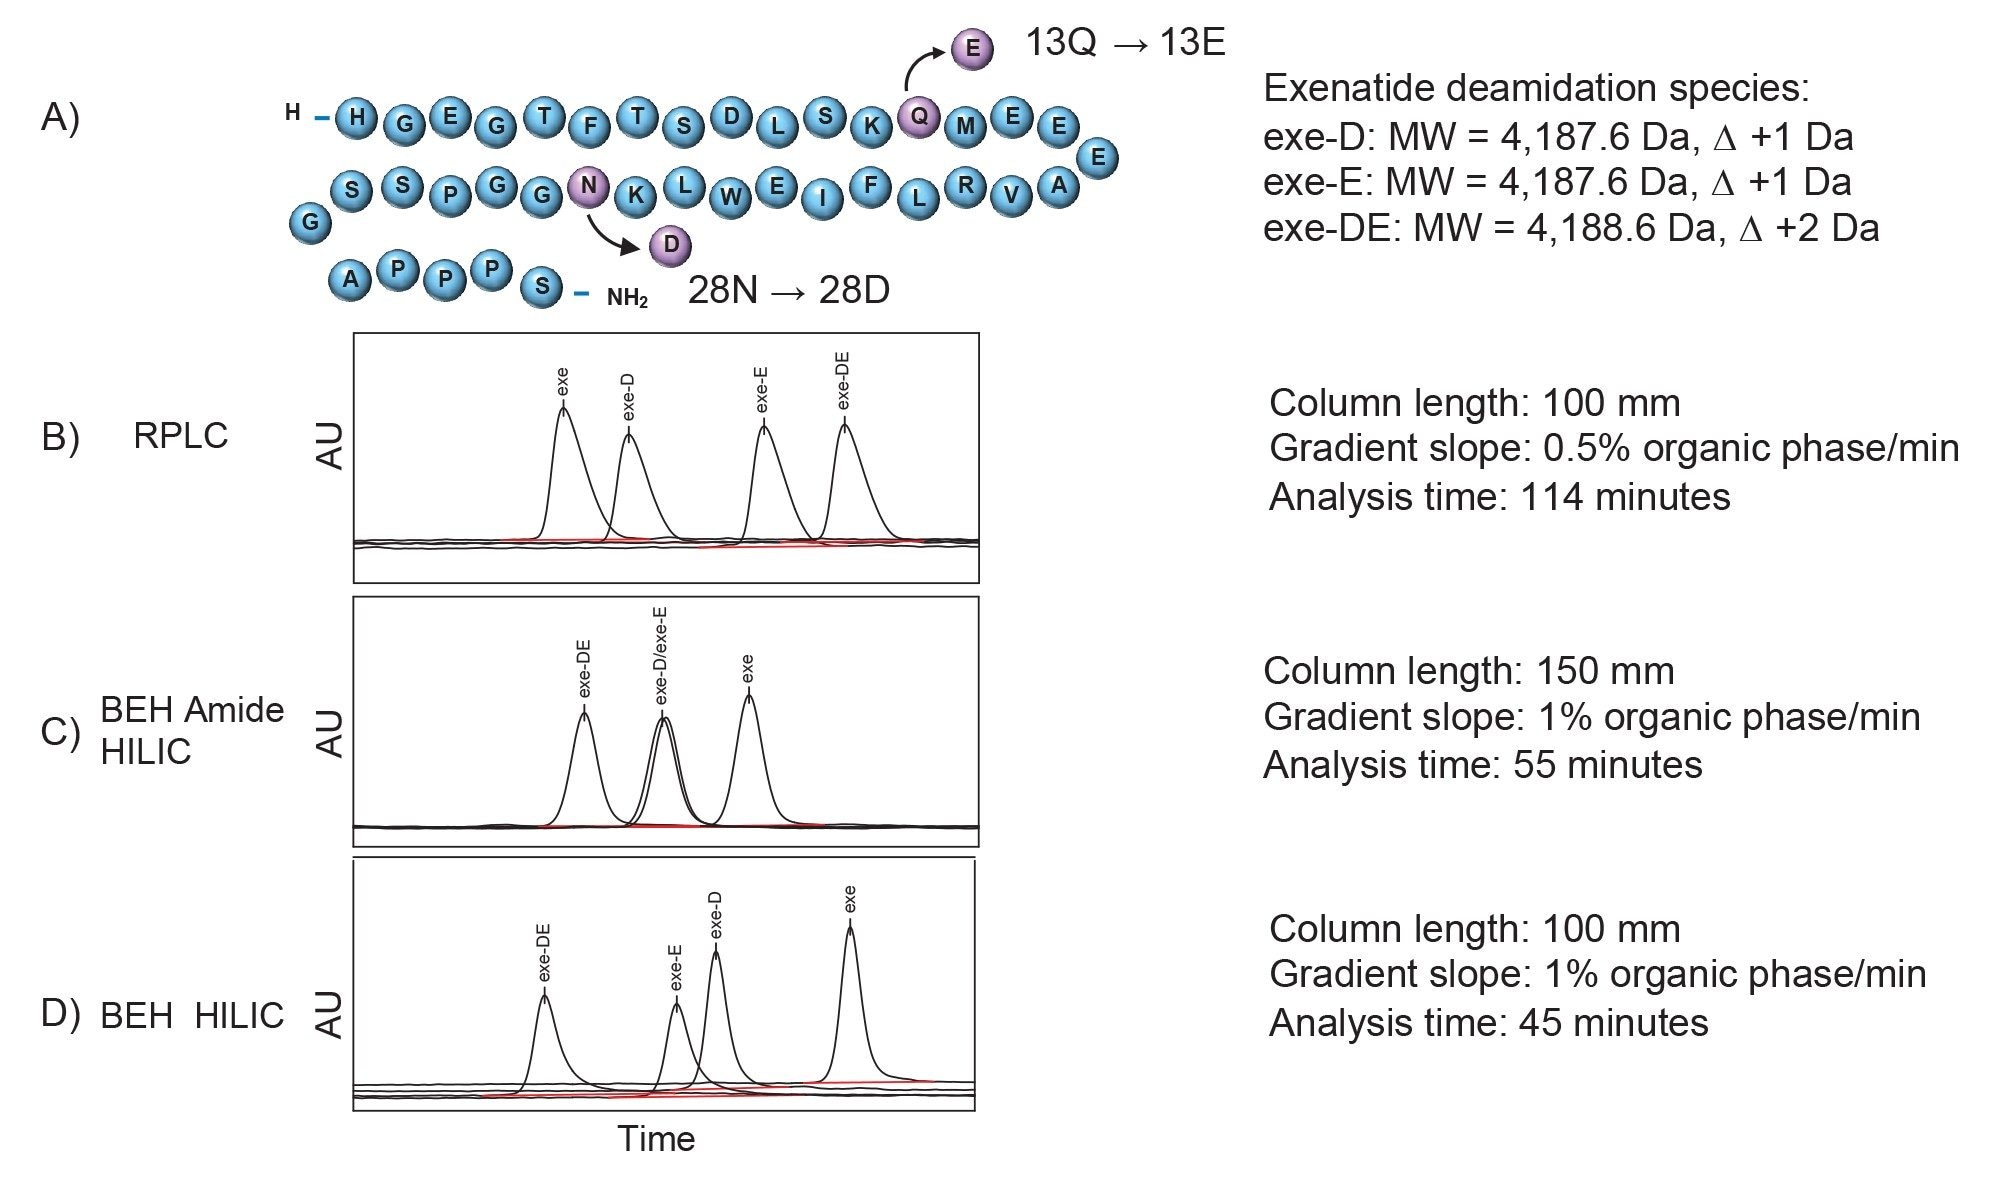
Deamidation is a well-recognized critical quality attribute (CQA) in protein and peptide therapeutics, arising from the conversion of asparagine or glutamine residues to their acidic counterparts. This modification introduces additional negative charge and can alter local molecular conformation, potentially affecting biological activity, stability, and receptor interactions. Exenatide contains a single asparagine residue at position 28 within a region important for GLP-1 receptor binding, making deamidation a potentially impactful modification that may alter receptor recognition and pharmacological potency. Beyond its biological relevance, deamidation also presents a significant analytical challenge. The associated mass shift (+0.984 Da) is difficult to distinguish from the native species using nominal-mass detection, while minimal changes in hydrophobicity can limit chromatographic resolution. To evaluate chromatographic selectivity for these clinically relevant impurities, three deamidation standards were synthesized (Figure 3A): exe-D, containing aspartic acid at position 28; exe-E, containing glutamic acid at position 13; and exe-DE, containing both deamidation events.
These standards and the native exenatide were analyzed individually (0.5 µg mass load for each analyte) under RPLC and HILIC conditions using BEH amide HILIC column and BEH HILIC column (Figures 3B, 3C, 3D). Overall, exe-DE, which contains two additional acidic residues, was readily separated from the native exenatide under all chromatographic conditions. The more challenging separation involved exe-D and exe-E, which carry identical net charge and differ only by a single methylene group, rendering exe-E slightly more hydrophobic. Under RPLC conditions, a shallow, long gradient (0.5% organic phase/min, 114 minutes) achieved partial resolution of exe-D and exe-E with peak fronting which may indicate overloading (Figure 3B). The BEH Amide HILIC column separation produced less separation with exe-D and exe-E co-eluted even at extended column length of 150 mm (Figure 3C). In contrast, BEH HILIC column achieved partial resolution of the two single deamidation variants using a steeper gradient of 1% organic phase/min (Figure 3D) reducing analysis time by 50% (45 minutes) while doubling throughput compared to RPLC with the same 100 mm column length. These results demonstrate that HILIC provides complementary selectivity to RPLC for resolving closely related deamidation variants while increasing analysis efficiency.
Optimization of HILIC Separation
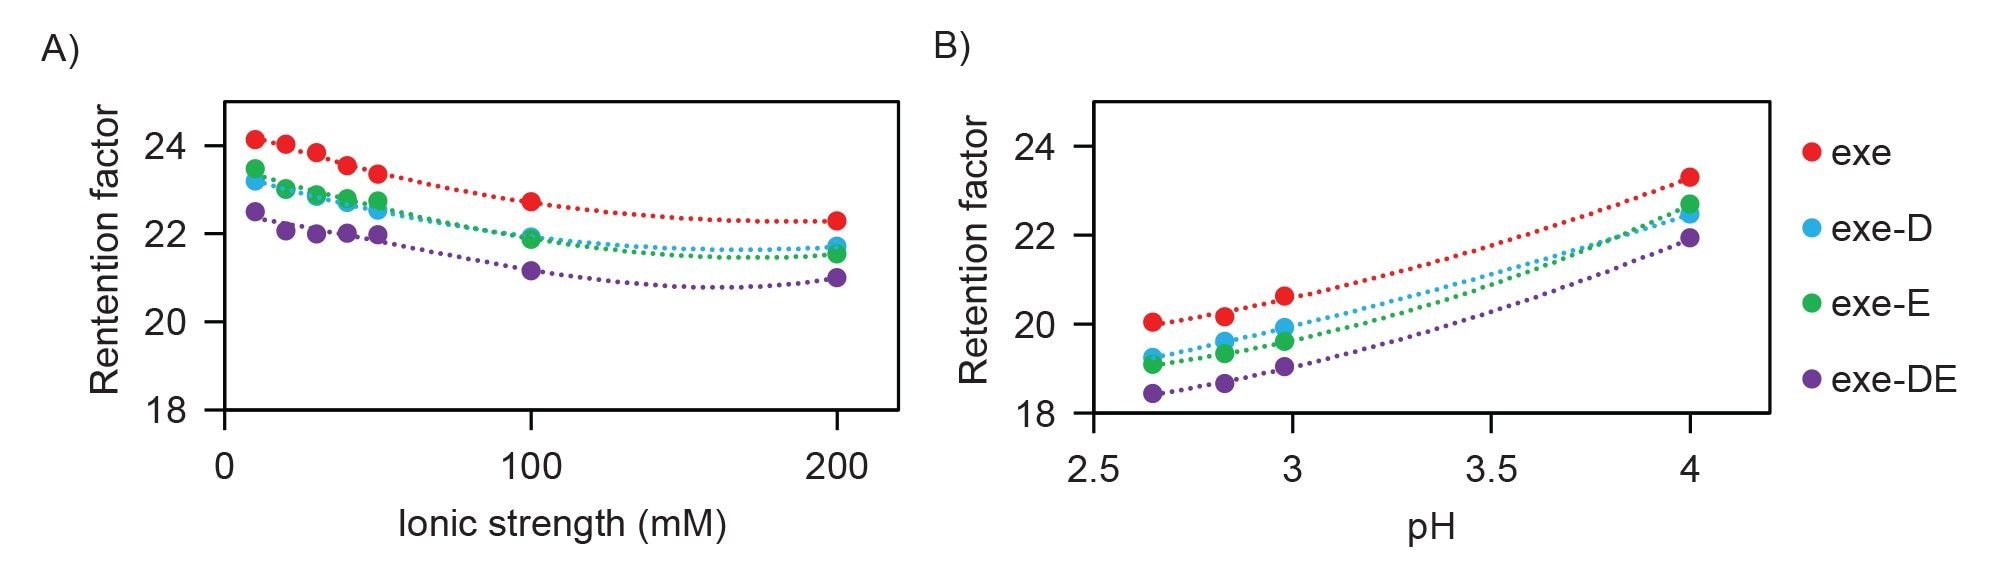
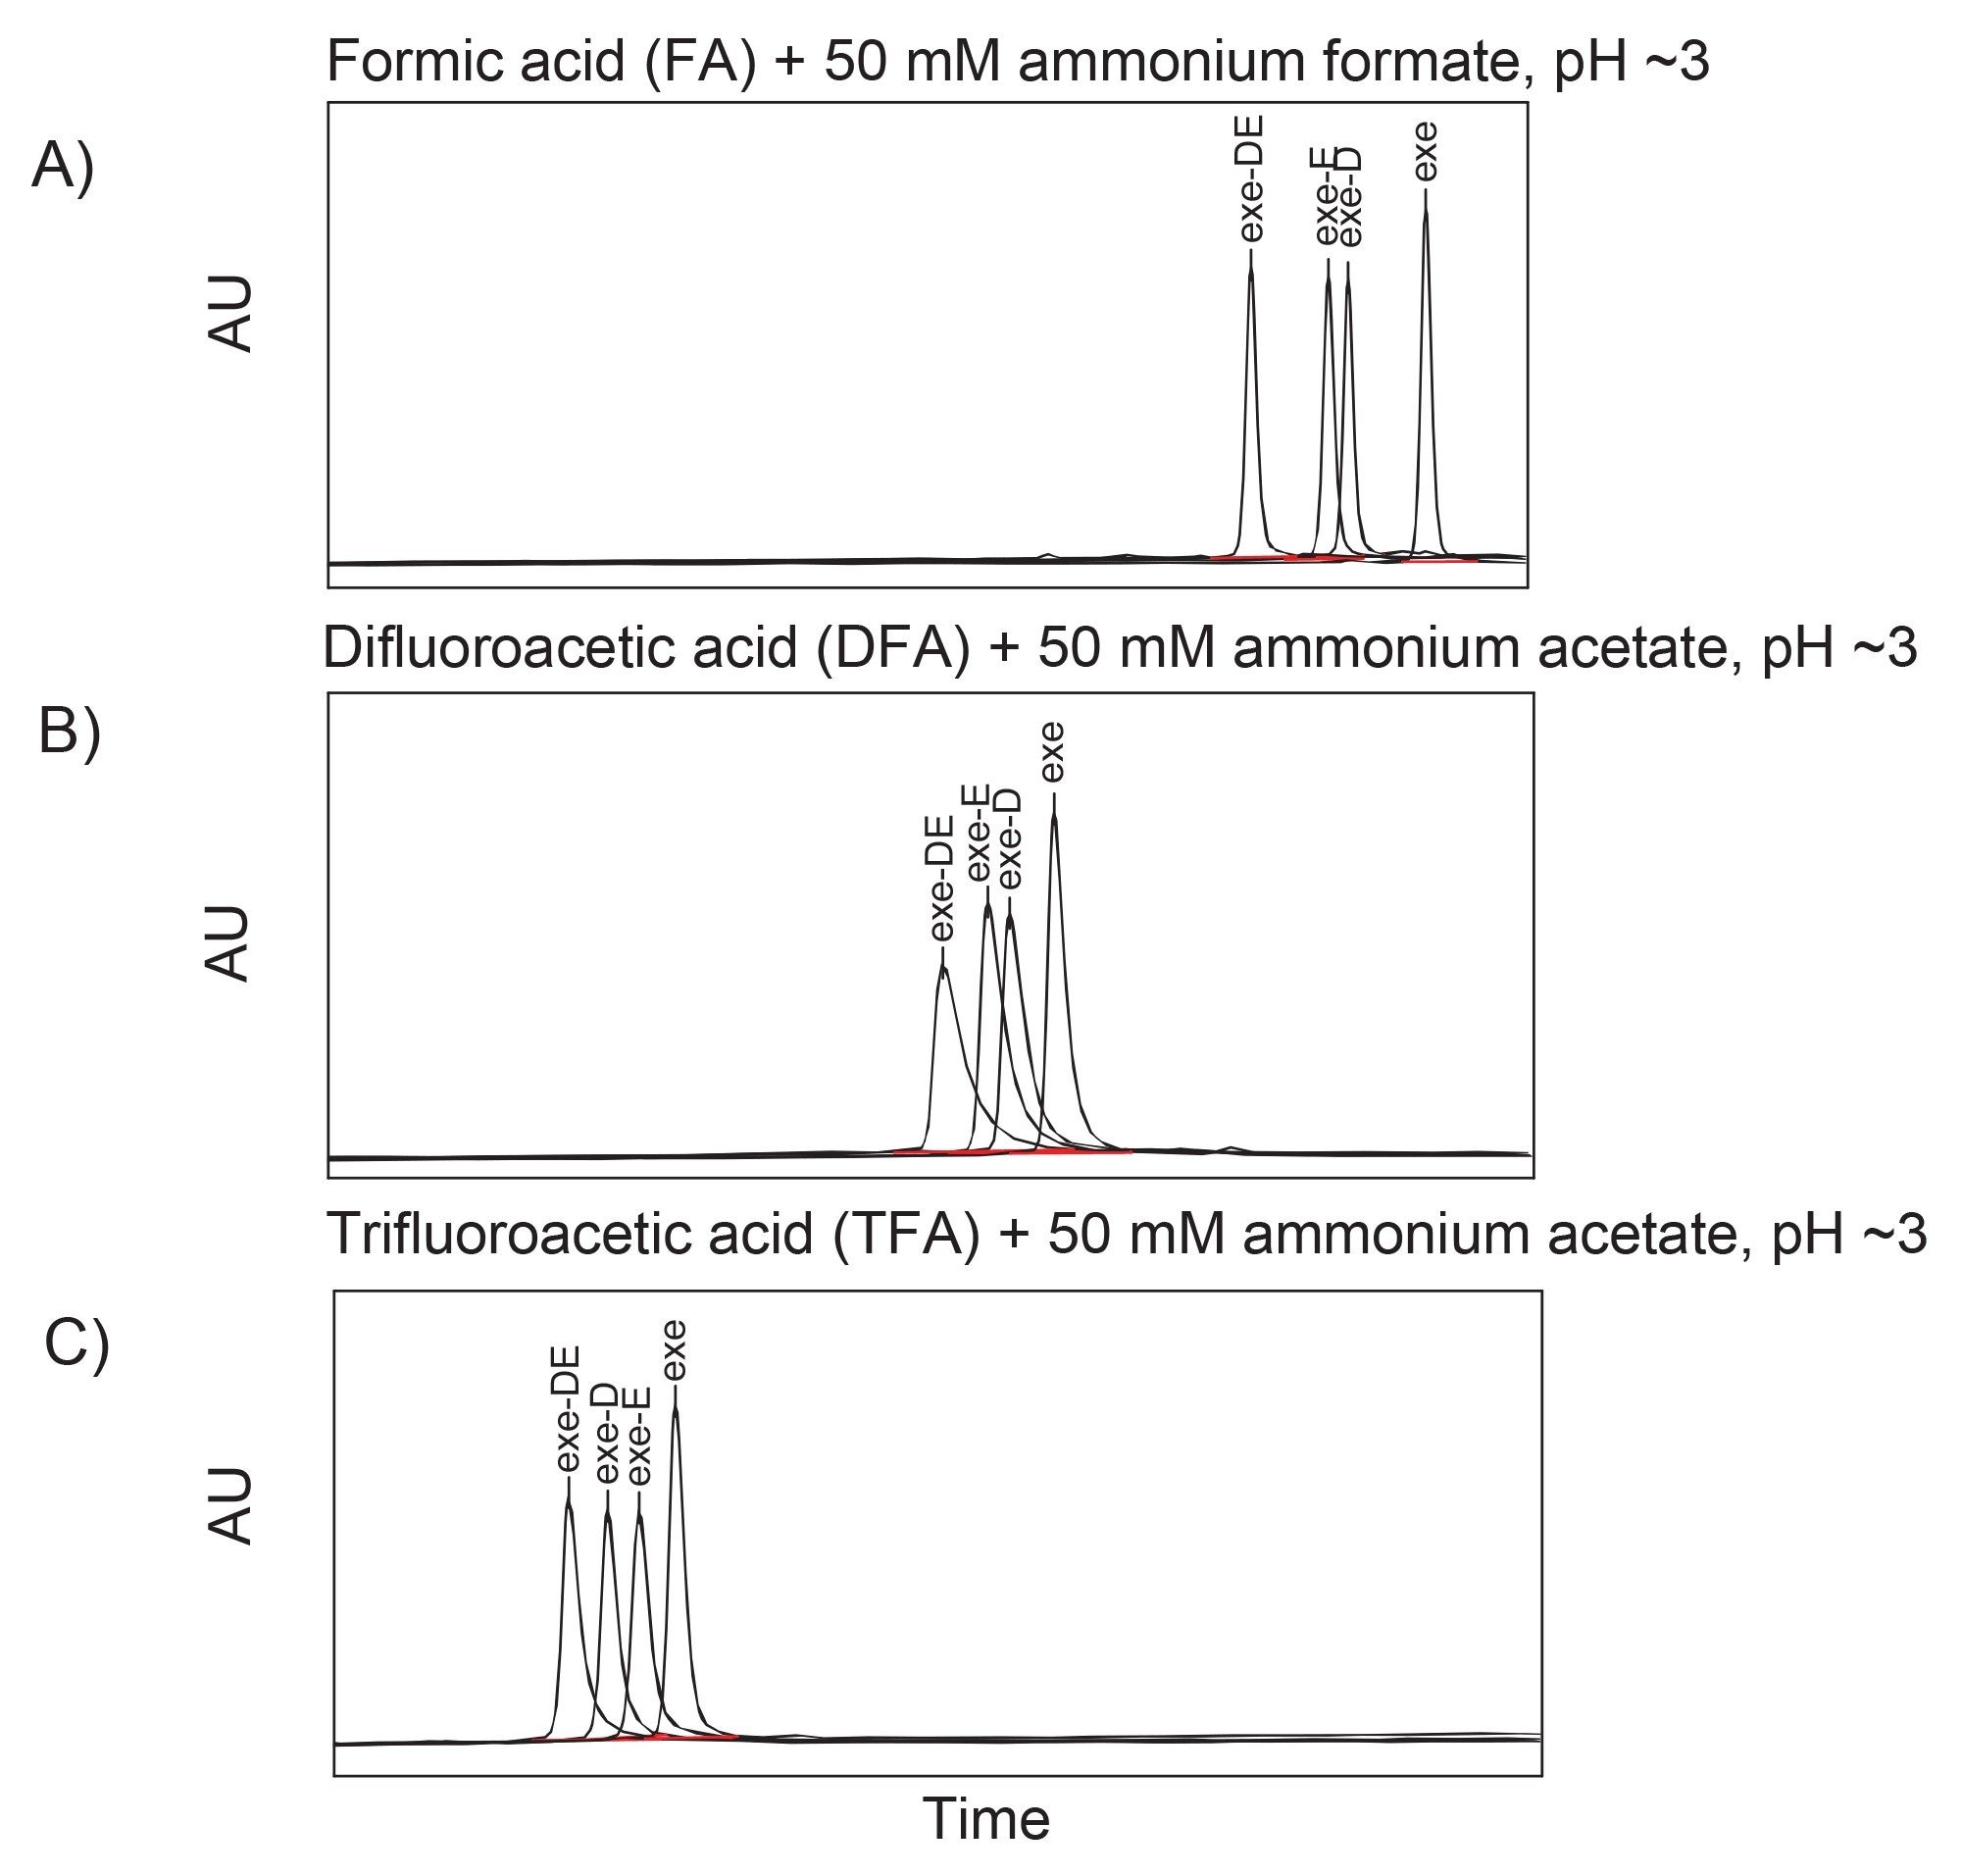
The BEH HILIC method was optimized by evaluating ionic strength, pH, and acid additives. Increasing ionic strength reduced retention, consistent with competitive ionic interactions at the stationary phase surface (Figure 4A). Similarly, decreasing pH reduced retention through increased protonation and weaker electrostatic interactions (Figure 4B). Acid additive selection also influenced chromatographic performance (Figure 5). As ion-pairing strength increased from formic acid (FA) to difluoroacetic acid (DFA) to trifluoroacetic acid (TFA), overall retention decreased. Among the conditions evaluated, FA provided the most favorable chromatographic performance, yielding the narrowest peaks, minimal tailing, and the greatest selectivity between deamidation variants.
The ion pairing reagent further influenced selectivity. Across all conditions, analytes with more charges eluted earlier, with exe-DE eluting first while the native exenatide elutes last. However, the elution order of exe-D and exe-E depended on the acid additive. Under FA and DFA conditions, the more hydrophobic exe-E eluted earlier, where TFA reversed the elution order. These observations underscore the fundamentally different retention mechanisms operating in HILIC and RPLC and demonstrate the tunable selectivity of HILIC for resolving structurally similar impurities.
Monitoring Impurities and Stability-Indicating Degradants
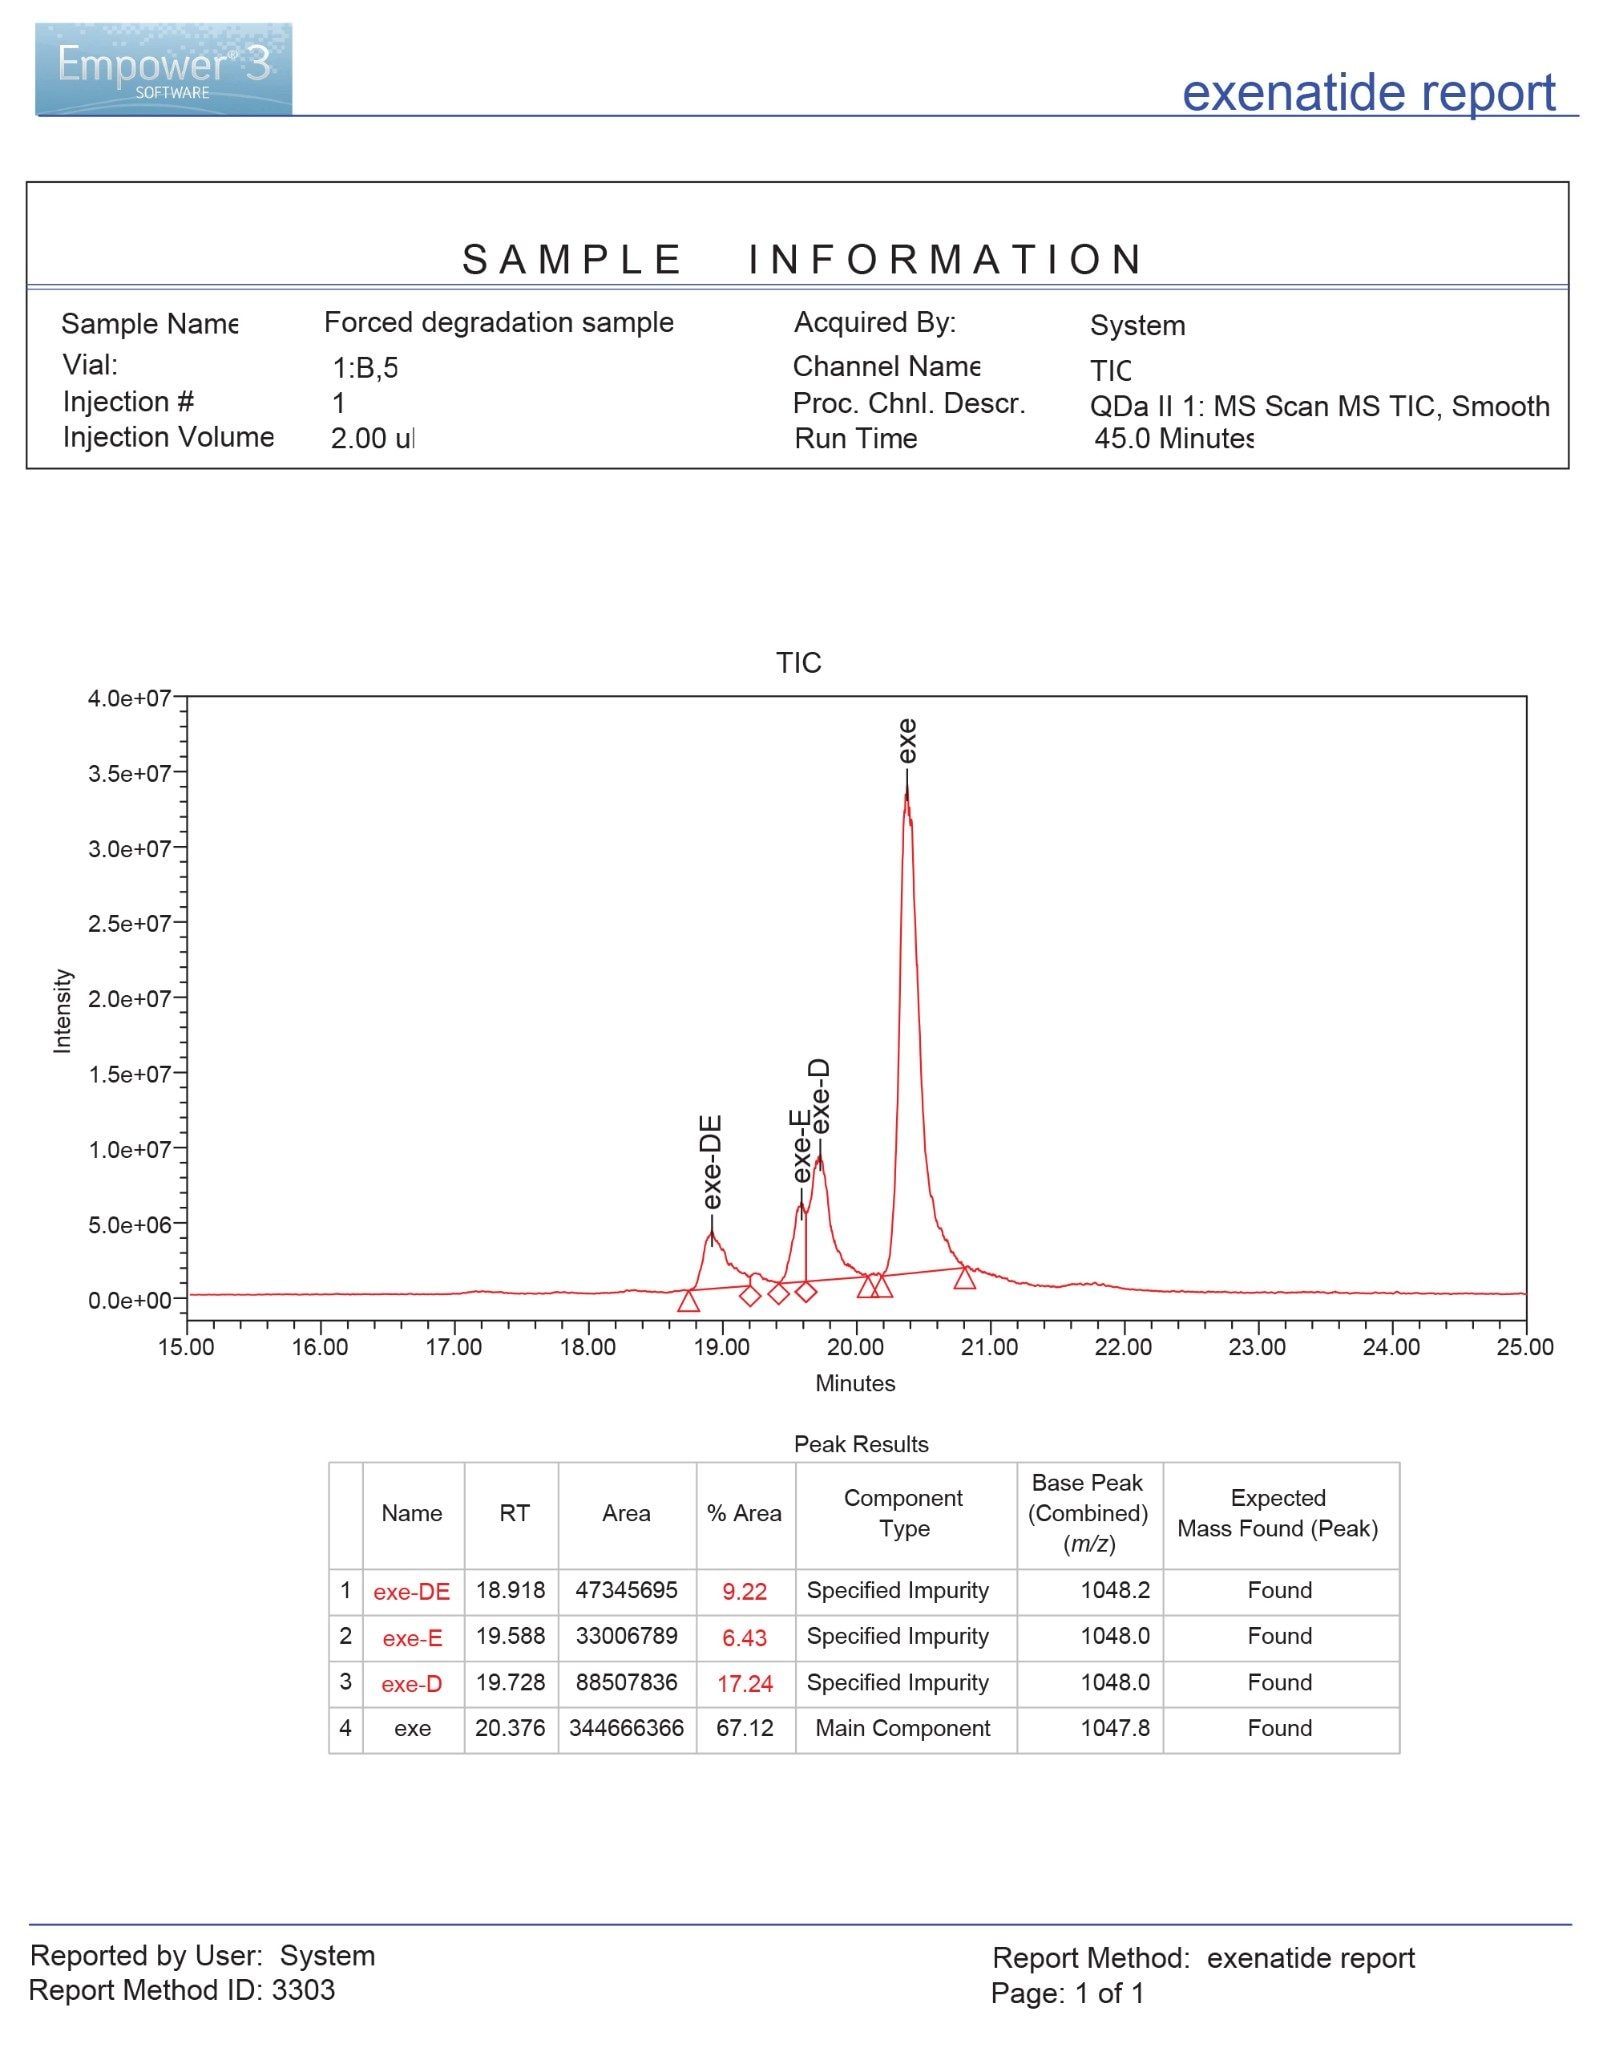
To demonstrate suitability for impurity monitoring, the optimized BEH HILIC method was evaluated using a spike-in mixture containing three deamidation standards. Figure 6 shows the total ion chromatograph (TIC) and associated peak results. The deamidation standards were defined as specified impurities with known mass spectra and retention time. These criteria enabled confident peak identification through automated comparison of mass spectra. The %area exceeded the impurity reporting threshold of 0.05%, so the components were flagged for easy interpretation.
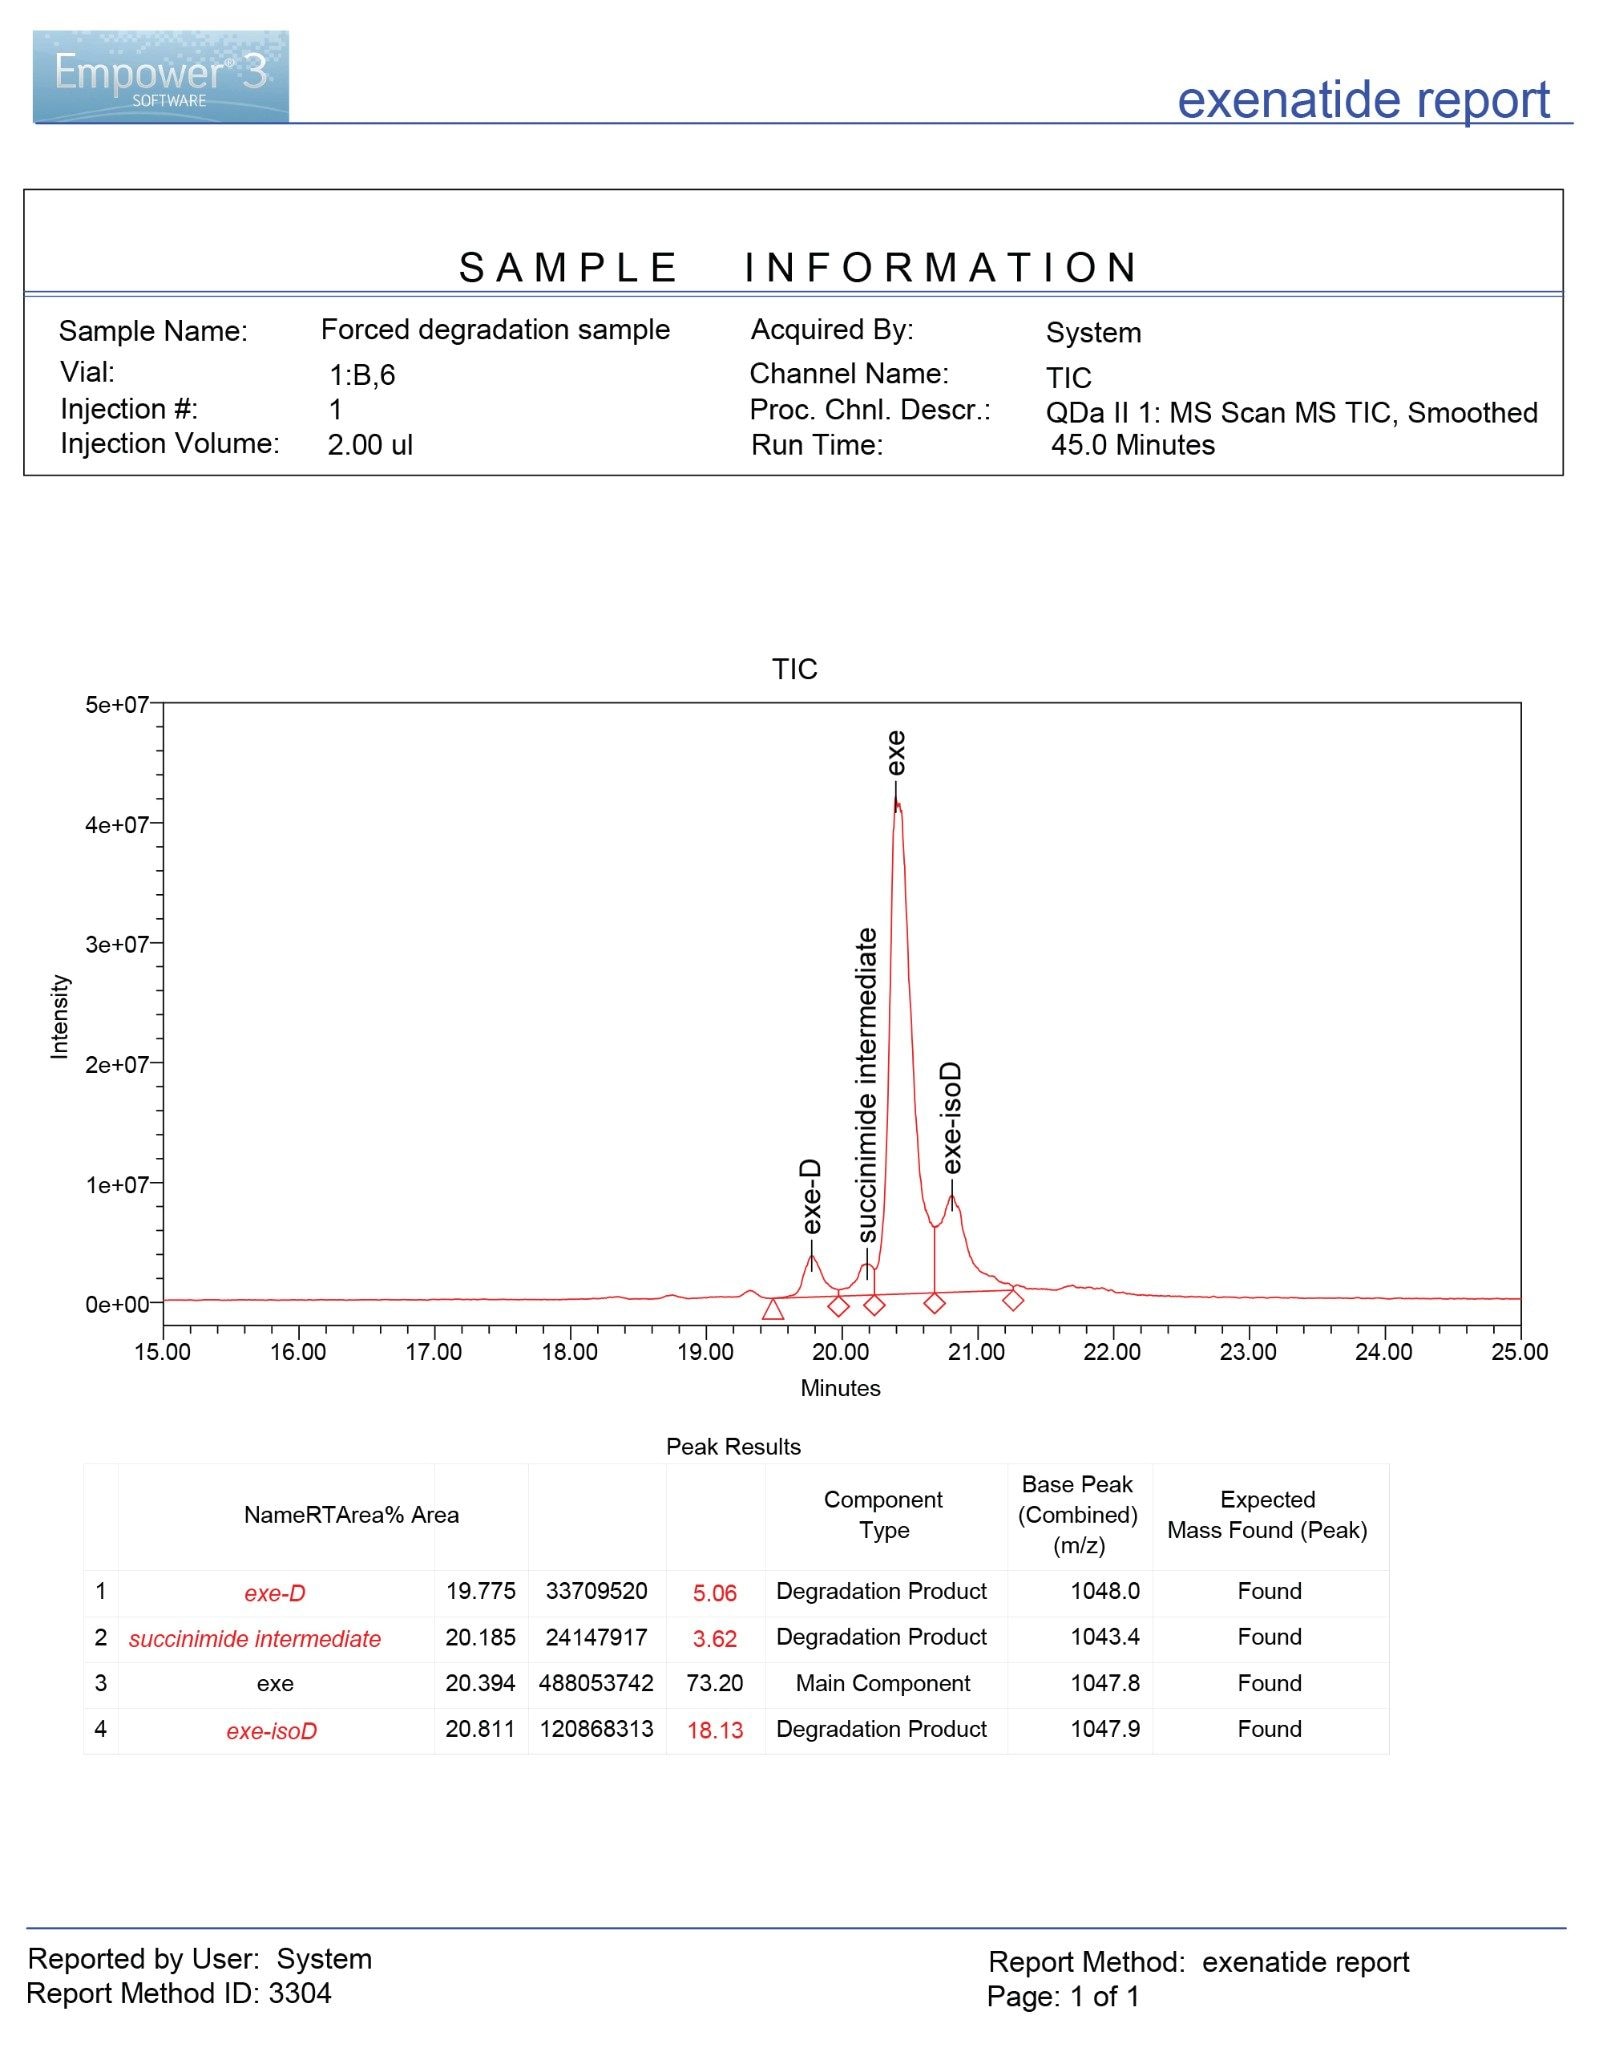
This method can be extended to degradants monitoring. Forced degradation (pH 8) potentially generated deamidation species, and three major degradants were detected (Figure 7). Comparison of their mass and retention time with deamidation standards confirmed that the earliest-eluting degradant is exe-D. A second degradant exhibited a mass shift of -17Da, consistent with the formation of succinimide intermediate in the deamidation pathway. A third degradant displayed a +1Da mass shift; however, its retention time differs from exe-E. Its peak area is 3.9 times of the exe-D peak, consistent with the formation of isoaspartic acid (exe-isoD). This is the predominant product of succinimide-mediated deamidation and is commonly observed at 3 to 4 times level of aspartic acid variant.3 The distinct retention of these species highlights the chromatographic selectivity of this HILIC method for resolving structurally-related deamidation products that are indistinguishable by nominal mass alone.
These observations extend the utility of the LC-UV/MS workflow beyond impurity identification to routine impurity and degradant monitoring. When combined with Empower CDS Software, automated peak identification based on mass and retention time reduces manual review, improves confidence in peak assignments, and accelerates decision-making. Furthermore, results can be efficiently compiled into traceable reports suitable for quality and regulatory documentation.
Conclusion
This study demonstrates the value of orthogonal impurity profiling by combining the complementary selectivity of RPLC and HILIC. While RPLC remains a foundational technique for peptide analysis, HILIC provides additional selectivity based on polarity and hydrophilicity, enabling resolution of impurities that may remain unresolved under conventional RPLC conditions. Using MS-compatible mobile phases, HILIC can be readily integrated into existing LC-UV/MS workflows. Combined with LC-UV, ACQUITY QDa II Mass Detector, and Empower CDS Software, this workflow provides greater confidence in peptide impurity detection and confirmation than UV-only methods and supports method implementation across development and quality laboratories.
References
- Yu, M.; et al. “Battle of GLP-1 Delivery Technologies” Advanced Drug Delivery Reviews 130 (2018) 113.
- Han, D.; et al. “Accelerating Method Development and Manufacturing of GLP-1 Analogs with LC-UV/MS”. Application Note 720008800, May 2025, Waters Corporation.
- Neale, Q.; et. al. “Chromatographic Properties of Deamidated Peptides with Asn-Gly Sequences in Proteomic Bottom-up Experiments” Journal of Chromatography A 1738 (2024) 465513.
720009593, September 2026


