
Characterizing AAV Aggregates with Subvisible Particle Analysis
Published on October 12, 2026

Abstract
Subvisible particles can be present even when smaller aggregates are not detected by dynamic light scattering (DLS) or size exclusion chromatography (SEC). Measuring subvisible particles in viral vector formulations presents unique challenges because standard methods can consume large amounts of sample. The Aura™ System uses backgrounded membrane imaging (BMI) technology to enable particle counting, sizing, and characterization in up to 96 samples in less than two hours while requiring only 5 μL per sample. The system provides highly resolved particle images, count and size distribution information, and sensitivity to detect changes as a function of stress and solution conditions.
Fast, low-volume subvisible particle analysis for viral vector characterization with the Aura System.
Benefits
- Detects and characterizes particles not measured by DLS or SEC
- Requires only 5 μL per sample
- Analyzes up to 96 samples in less than two hours
- Provides highly resolved particle images, count, and size distribution information
- Measures particles from 1 μm to 5 mm
- Detects changes as a function of stress and solution conditions
Introduction
Sub-Visible Particle Analysis Shouldn’t Require Milliliters of Precious Sample
Subvisible particles are particles that are too large for analysis by SEC (SEC; ~ > 0.1 μm), but too small to be visible to the unaided eye (< 100 μm).
Evidence suggests that their presence in parenterally administered drugs can lead to dangerous immunogenic reactions. The FDA tightly monitors particulates in parenteral protein drug formulations, referencing guidelines for subvisible particles >10 μm established by the US Pharmacopeia <788>.1
However, measuring subvisible particles in viral vector formulations for gene therapy poses challenges. Due to the complexity of manufacturing, availability of sample formulation or quality testing limits the number and type of analytics that can be performed. Standard methods for subvisible particle measurement such as flow microscopy are impractical because they can consume large amounts of sample (> 1 mL).
Experimental
Measuring Only in the Sub-Micron Range May Not Give the Whole Picture
DLS and SEC can miss aggregates in the subvisible range. Large aggregates can be altered or removed in SEC by the column separation mechanism, and DLS becomes difficult to interpret when samples are polydisperse or if larger aggregates are present. Often the solution to improve data quality is to filter samples before running, which only removes the larger particles, so they escape analysis entirely.
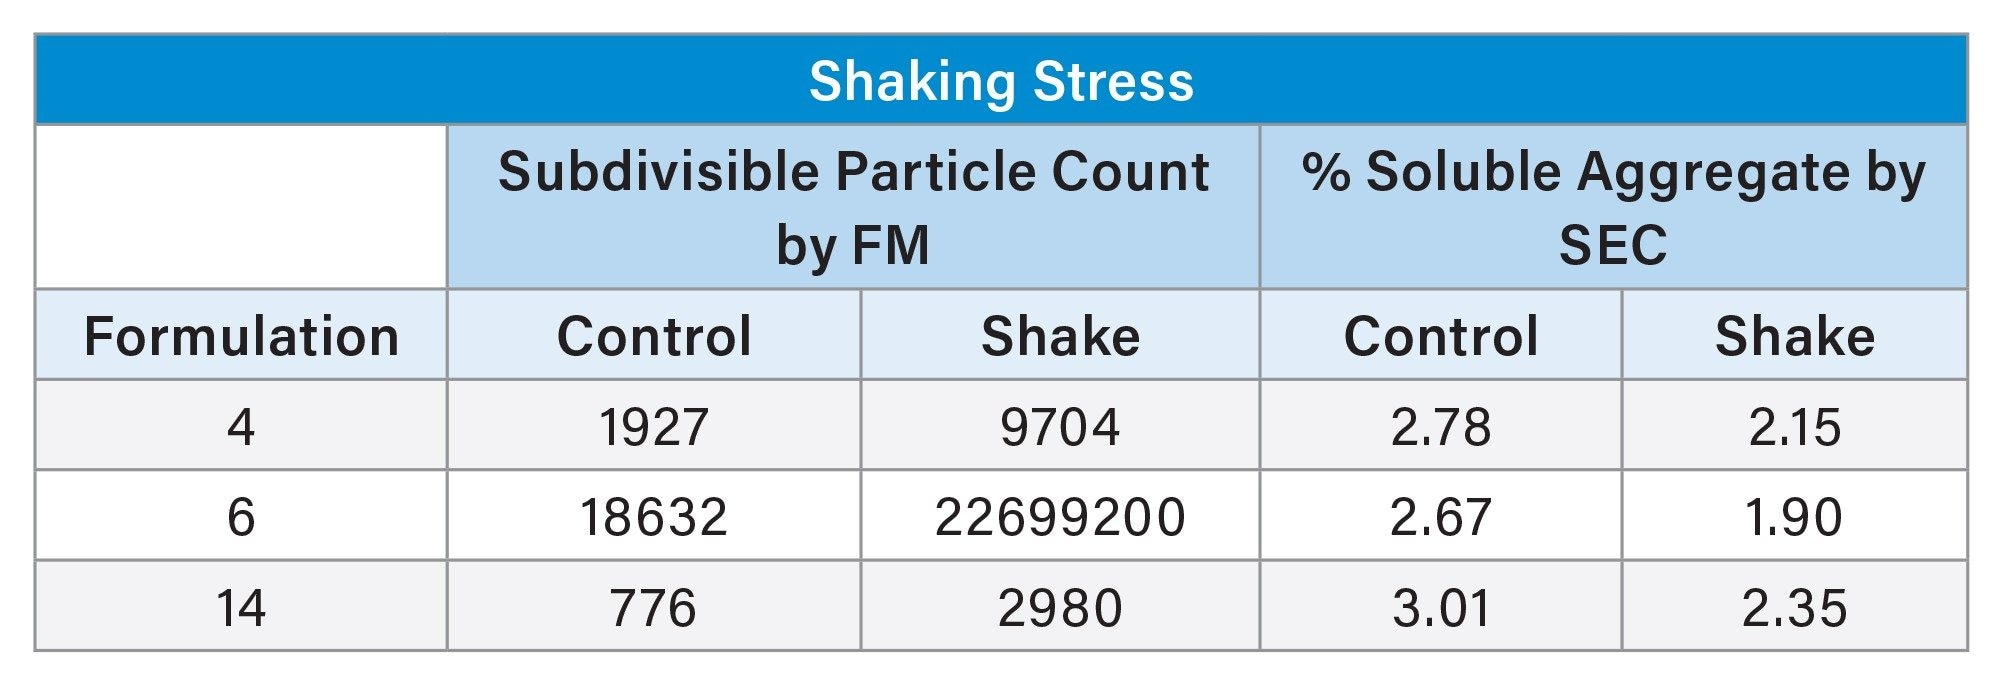
Table 1. Monoclonal antibody (mAb) samples subjected to mechanical stress show low counts of soluble aggregates as measured by SEC. However, when aggregates in the subvisible range are measured by flow microscopy (FM), the same samples.
show high aggregate counts. Adapted from Southall, et al. Particle analysis as a formulation development tool, Amer. Pharm Rev. (2011).
In other words, subvisible particles can be present even when smaller aggregates are not detected.
Results and Discussion
The Aura System: Automated Subvisible Particle Analysis
Subvisible particle analysis using the Aura Instrument is fast and requires only 5 μL per sample — making detection of larger, insoluble aggregates accessible for gene therapy analytics.
The Aura System uses BMI technology, a form of automated membrane microscopy, that enables particle counting, sizing, and characterization in up to 96 samples in less than two hours.
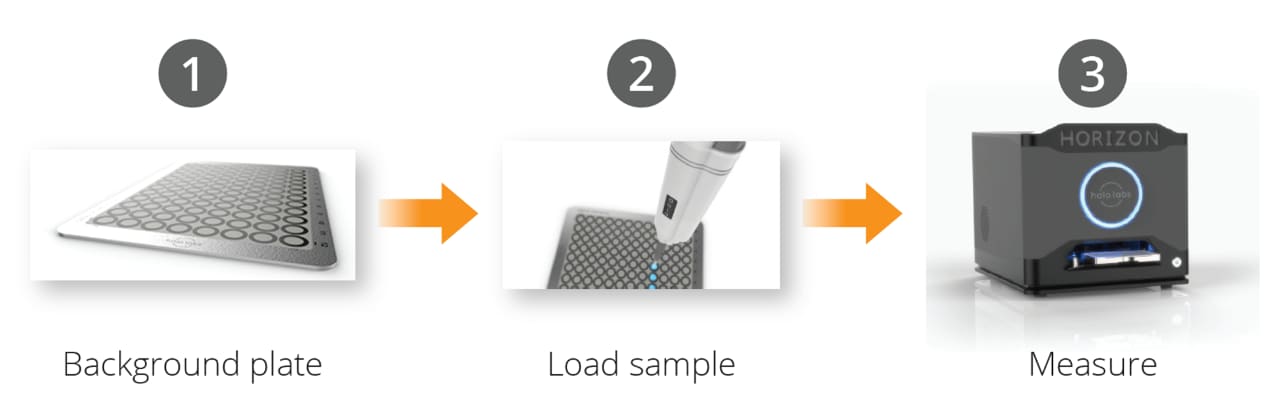
The Aura System Delivers AAV Aggregate Particle Images, Count, and Size Distribution Information
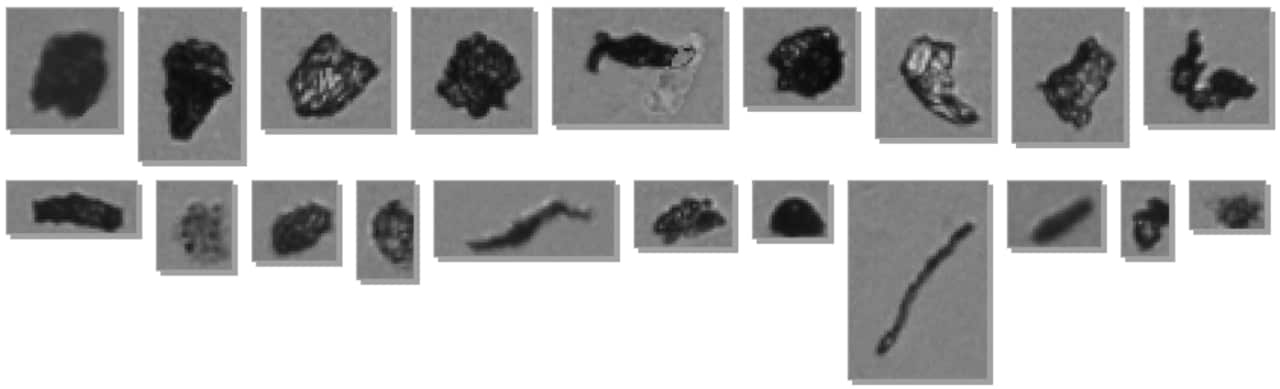
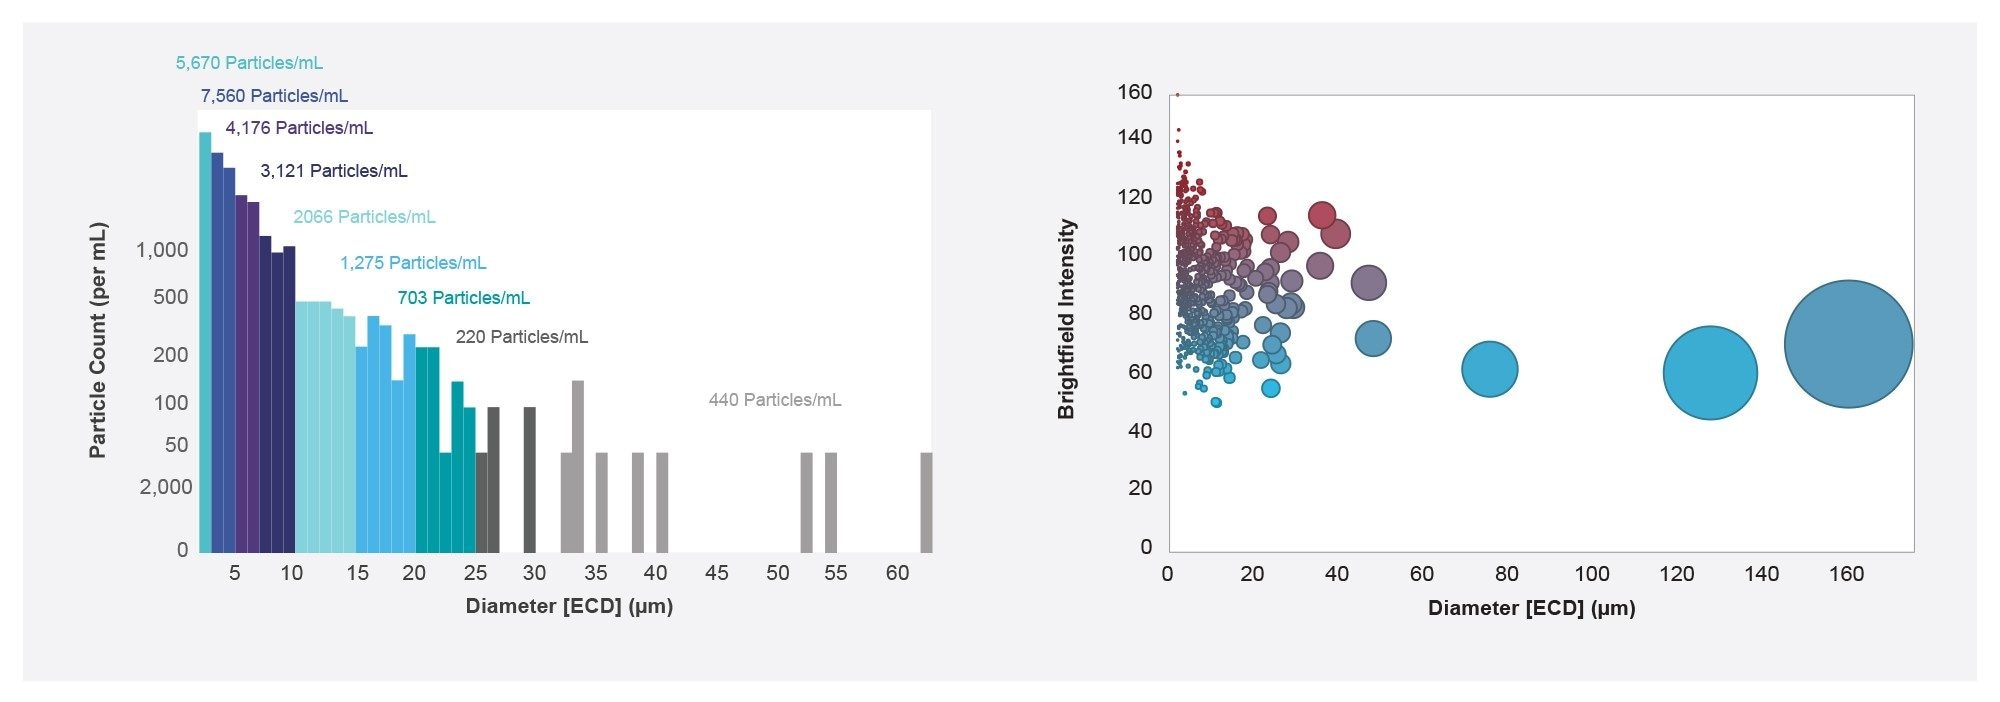
Highly resolved particle images, count, and size distribution are provided. Optional fluorescence enables differentiation between protein-containing capsid particles and extrinsic particles such as glass, metal, or plastic.
Subvisible Particle Counts are an Indicator of Stability
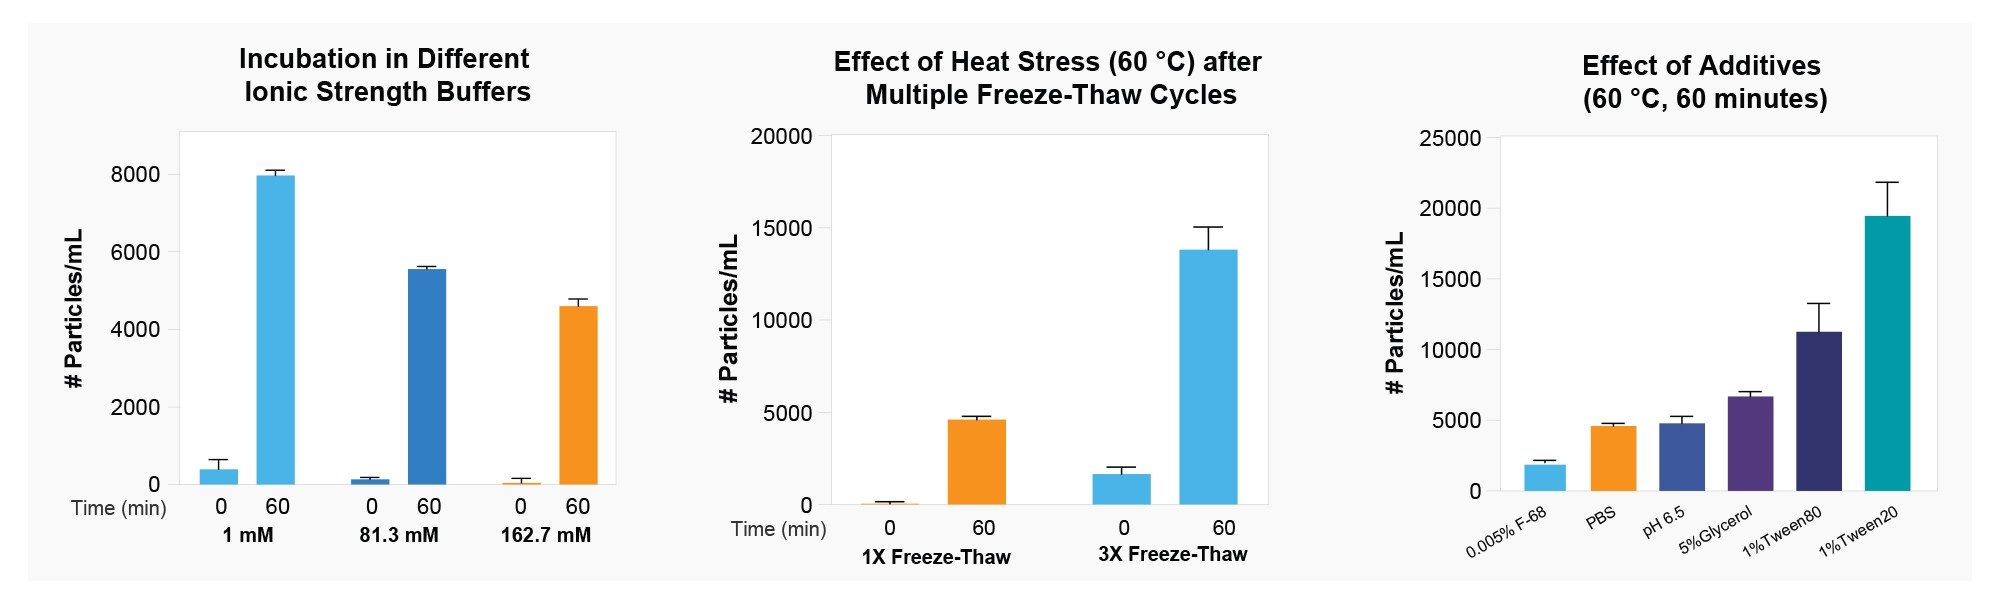
Measurement of subvisible particles helps to complete the stability picture , which helps to minimize risk and enable more informed decisions about viral vector formulations and quality assessment.
Conclusion
In conclusion, the Aura System detects and characterizes particles from 1 μm to 5 mm in gene therapy samples, including particles that are often missed by DLS or SEC. It only requires as little as 5 μL of sample per test to provide detailed information on particle size, morphology, counts, and distribution. Its 96-well automation format makes it possible to test many conditions in one experiment, and it takes about 1 minute per sample for analysis.
The Aura System generates high-quality images for each particle without interference from buffers or different matrices. The Aura System also has the sensitivity to detect changes as a function of stress and solution conditions.
Combined with 21 CFR Part 11 Software, the Aura System supports viral vector quality assessment.
Why Use the Aura System for Viral Vector Quality Assessment?
- Detects and characterizes particles not measured by DLS or SEC
- Low sample consumption (as little as 5 μL per test)
- 96-well automation format for testing lots of conditions
- Provides detailed information on particles — size, morphology, counts, distribution, identification
- Rapid analysis time of about 1 minute per sample
- Wide working range: Measures particles from 1 μm to 5 mm with high reproducibility
- Particles are imaged without the interference of buffer or matrix for higher sensitivity
- Quality images of particles
- Sensitivity to detect changes as a function of stress and solution conditions
- 21 CFR Part 11 software available
References
- Annex 3(R1) Test for Particulate Contamination: Subvisible Particles General Chapter Guidance for Industry: https://www.fda.gov/media/71231/download
Featured Products
720009613, October 2026


