Quantification of Additives in a Commercial CMP Sample Using HPLC With Photodiode Array and Mass Detection
Abstract
Chemical mechanical polishing (CMP) or planarization slurries are used in the semiconductor industry to create a specific surface on a silicon wafer in the construction of various electronics.1 To maintain the quality of the slurry, many chemical additives are used.
The routine analysis of additives in a CMP slurry can be helpful in formulation or quality control. Using a fifteen minute separation method, the Waters Arc™ High Performance Liquid Chromatography (HPLC) System with Photodiode Array (PDA) and ACQUITY™ QDa™ Mass Detection (MS) can be used for analysis of a CMP slurry and for individual additives or mixtures of additives in a quantitative analysis for those easily detected by PDA, and a qualitative analysis for those more challenging additives that require mass detection. The single quadrupole mass detector adds a second layer of detection that gives confidence in the results assay by providing a mass-to-charge (m/z) ratio unique to each molecule.
Benefits
- Arc HPLC System with a routine 15 minute separation method and capable of in-system method update to UHPLC without re-validation
- Robust XBridge™ BEH™ Columns capable of low and high-pressure applications without compromising the column bed
- ACQUITY QDa Mass Detection for more confidence in results assay
- Empower™ 3 Chromatography Data System (CDS) for data analysis of PDA, QDa, and all Waters Arc HPLC compatible detectors
Introduction
The CMP slurry is a mixture of chemicals and mechanical polishing particles that are formulated to achieve a specific surface quality that will not interfere with the performance of the completed product. Maintaining the quality of the CMP slurry during the polishing process is achieved by adding a fine balance of chemical additives that prevent slurry degradation due to friction, heat, oxidation, and degradation. Examples of common CMP additives are polymers, complex organic molecules, organic acids, and mineral acids.2
Polymers are used as dispersing stabilizers. Complex organic molecules are used as corrosion inhibitors and biocides. Acids are used as chelating agents and pH adjusters.3
Analytical methods are needed to ensure the quality of a CMP slurry, and most methods require complicated sample preparation and multiple techniques to achieve results: gas chromatography-mass spectrometry (GC/MS), freeze drying, nuclear magnetic resonance spectroscopy (NMR), Fournier transform infrared (FTIR).3 Arc HPLC with PDA and ACQUITY QDa Detector is a simple and routine analysis option. This application note offers a fifteen minute routine method for the analysis of known CMP slurry additives with minimal sample prep: dilute and inject for additives, centrifuge, dilute, and inject for CMP slurry. QDa single quadrupole mass detection confirms the additive qualitatively regardless of detection in the PDA, while the PDA detection enables quantitation for ultra violet (UV) active analytes at low concentrations.
Experimental
Sample Description
Commercially available samples and standards were purchased (Merck, Germany) and are shown in Table 1. Each of these chemicals were chosen based on researching prior CMP analysis work. The CMP slurry sample information was found on the Chempoint website along with the technical data sheet.4 The benzotriazole, polyethylene glycol (PEG), citric, and phosphoric acid were identified as common CMP slurry additives in a publication by Toray Research Center.3 All the chemicals purchased, except for the CMP slurry, were dissolved in 10 mM ammonium formate at a concentration of 1 mg/mL. The CMP slurry was centrifuged at a temperature of 4 ºC at 2200 rpm for twenty minutes and the top 4 mL of supernatant were decanted into a 20 mL scintillation vial. The supernatant was diluted to a concentration of 6.5 mg/mL with 10 mM ammonium formate. Samples were made to an optimized concentration for injection onto the instrument.
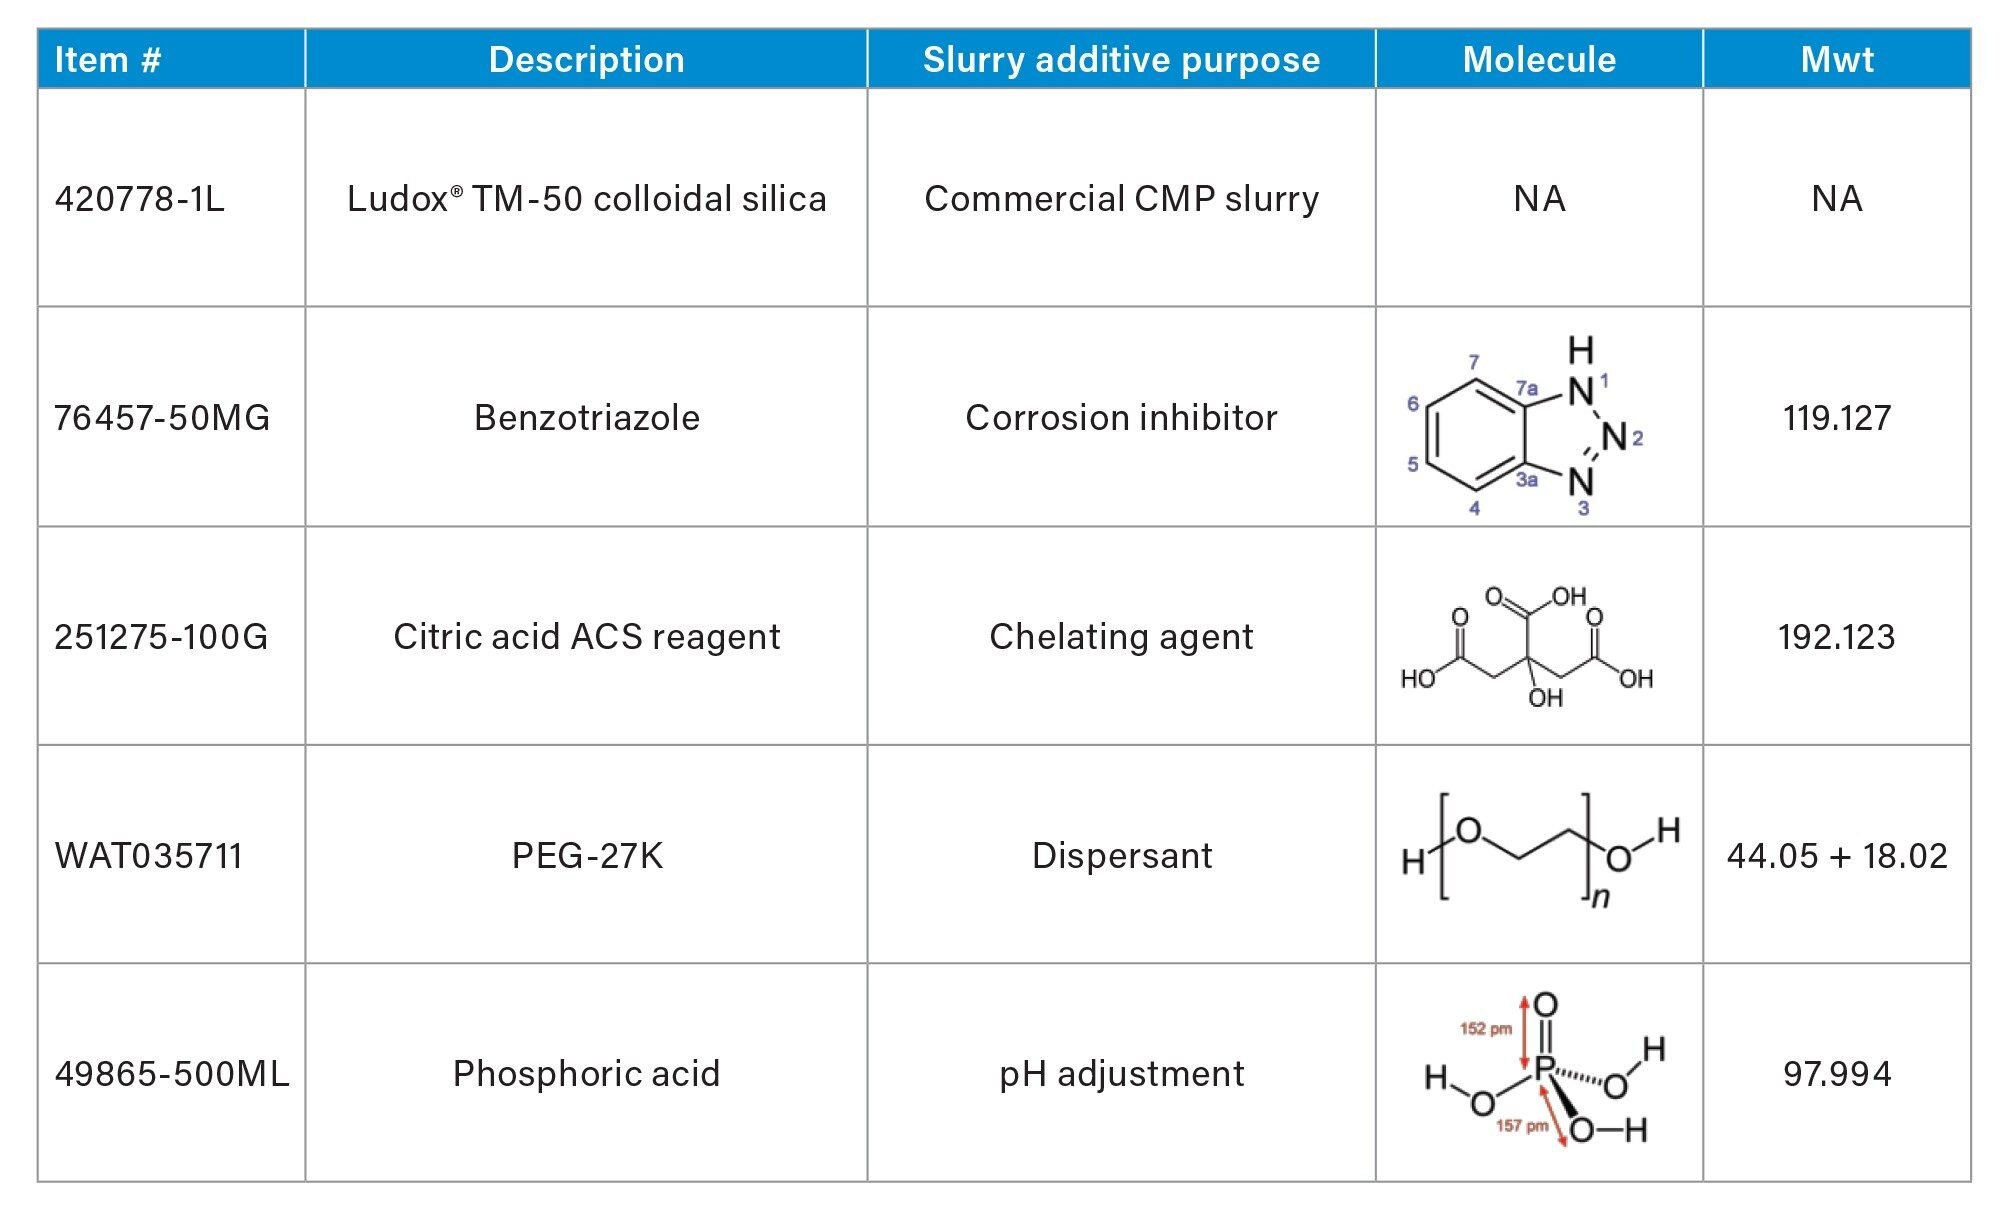
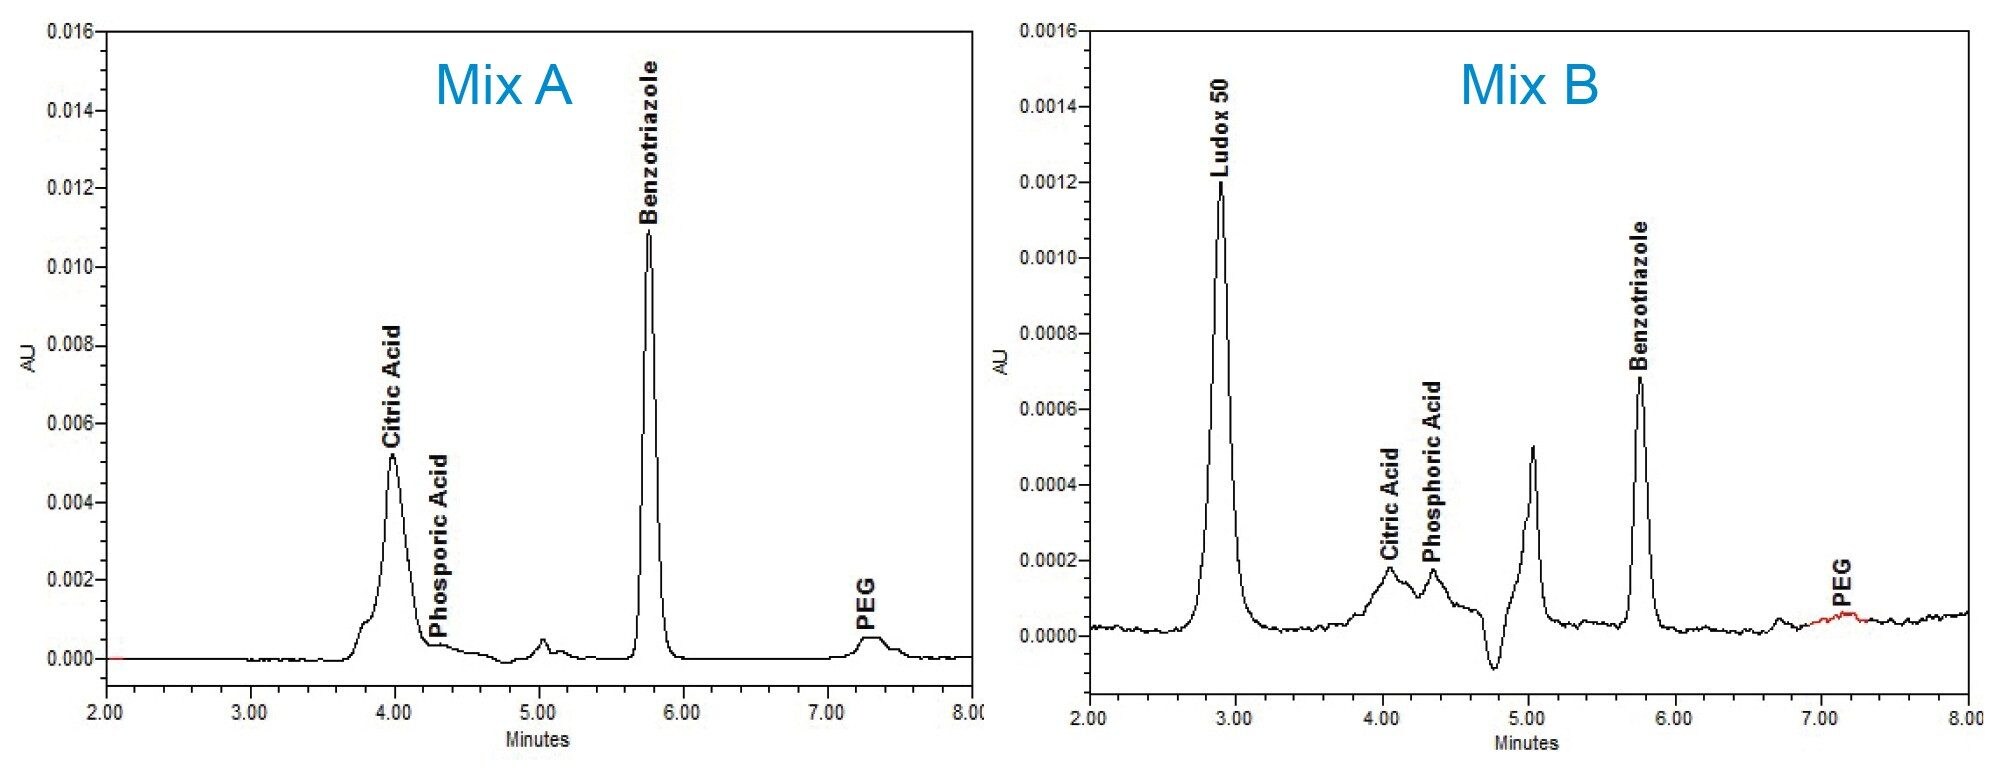
The Individual standards, at varying concentrations stated in Table 2, were serial diluted for individual calibration curves, were then combined one-to-one forming a CMP additive mixture (Mix A), and Mix A was serial diluted for a calibration curve. Finally, Mix A was diluted with the Ludox® supernatant to form a Mix B dilution series for calculating the recovery of the additives spiked into the Ludox supernatant matrix. An example of PDA chromatography of CMP standard Mix A chromatography versus spiked Ludox CMP supernatant Mix B are compared in Figure 1.
Additive Concentrations (Table 2)
|
Additive |
Concentration (mg/mL) |
|
Citric acid: |
1 |
|
Benzotriazole: |
0.01 |
|
PEG: |
1 |
|
Phosphoric acid: |
0.01 |
Method Conditions
The CMP slurry method was designed with the option to be scaled to a smaller particle column within the same Arc HPLC System. Therefore, two XBridge BEH 5 µm (4.6 x 150 mm) were used for this analysis.
LC Conditions
|
Chromatographic system: |
Arc HPLC |
|
Pump: |
Quaternary Solvent Manager |
|
Sample temperature: |
20 °C |
|
Column temperature: |
50 °C |
|
PDA (wavelength): |
254 nm |
|
Column set: |
XBridge BEH 5 µm (2), (4.6 x 150 mm) |
|
Solvent A: |
Water; ammonium formate 10 mM |
|
Solvent B: |
Acetonitrile |
|
Wash solvent: |
80/20 Water/acetonitrile |
|
Seal wash: |
50/50 Water/methanol |
|
Flow rate: |
0.600 mL/min |
|
Injection volume: |
20 µL |
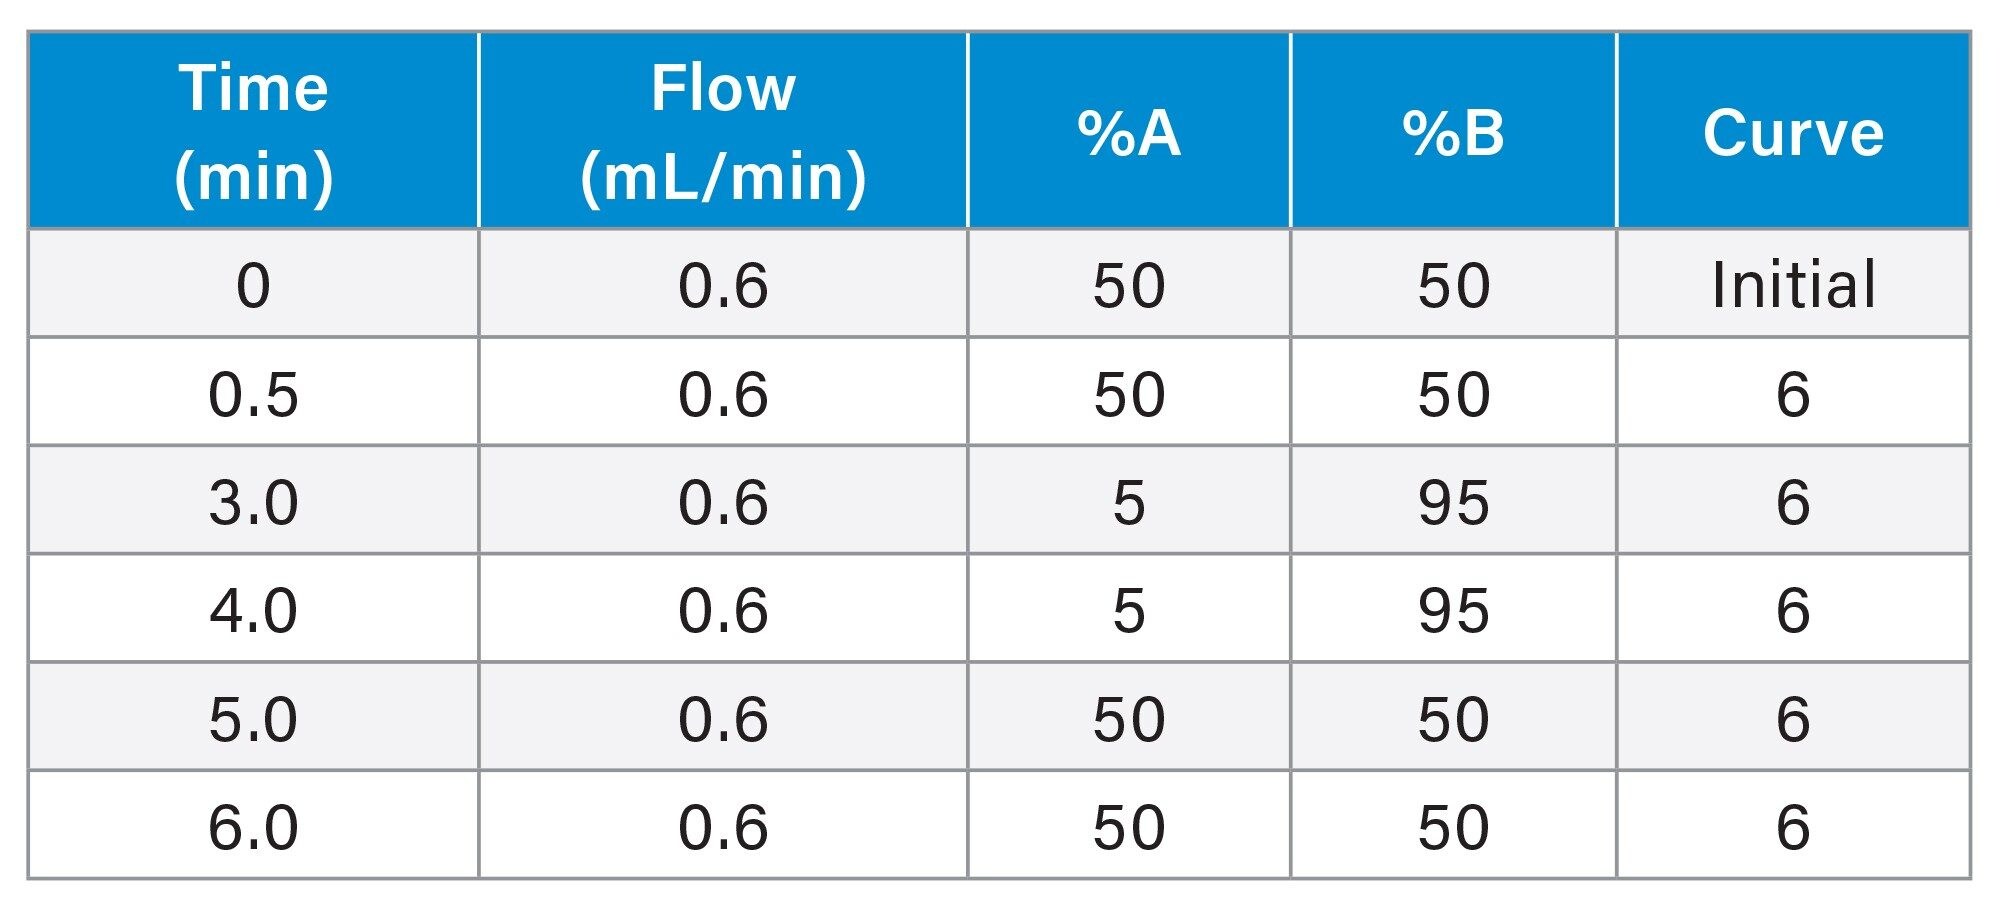
Gradient Table
MS Conditions
|
MS system: |
Waters ACQUITY QDa Mass Detector |
|
Ionization mode: |
ESI+/- |
|
Acquisition range: |
30–1200 Da |
|
Cone voltage: |
15 V |
|
Data: |
Centroid |
Data Management
Instrument control (PDA and QDa Mass Detector) as well as data acquisition and processing were done by Empower 3 Chromatography Data System, FR5.
Results and Discussion
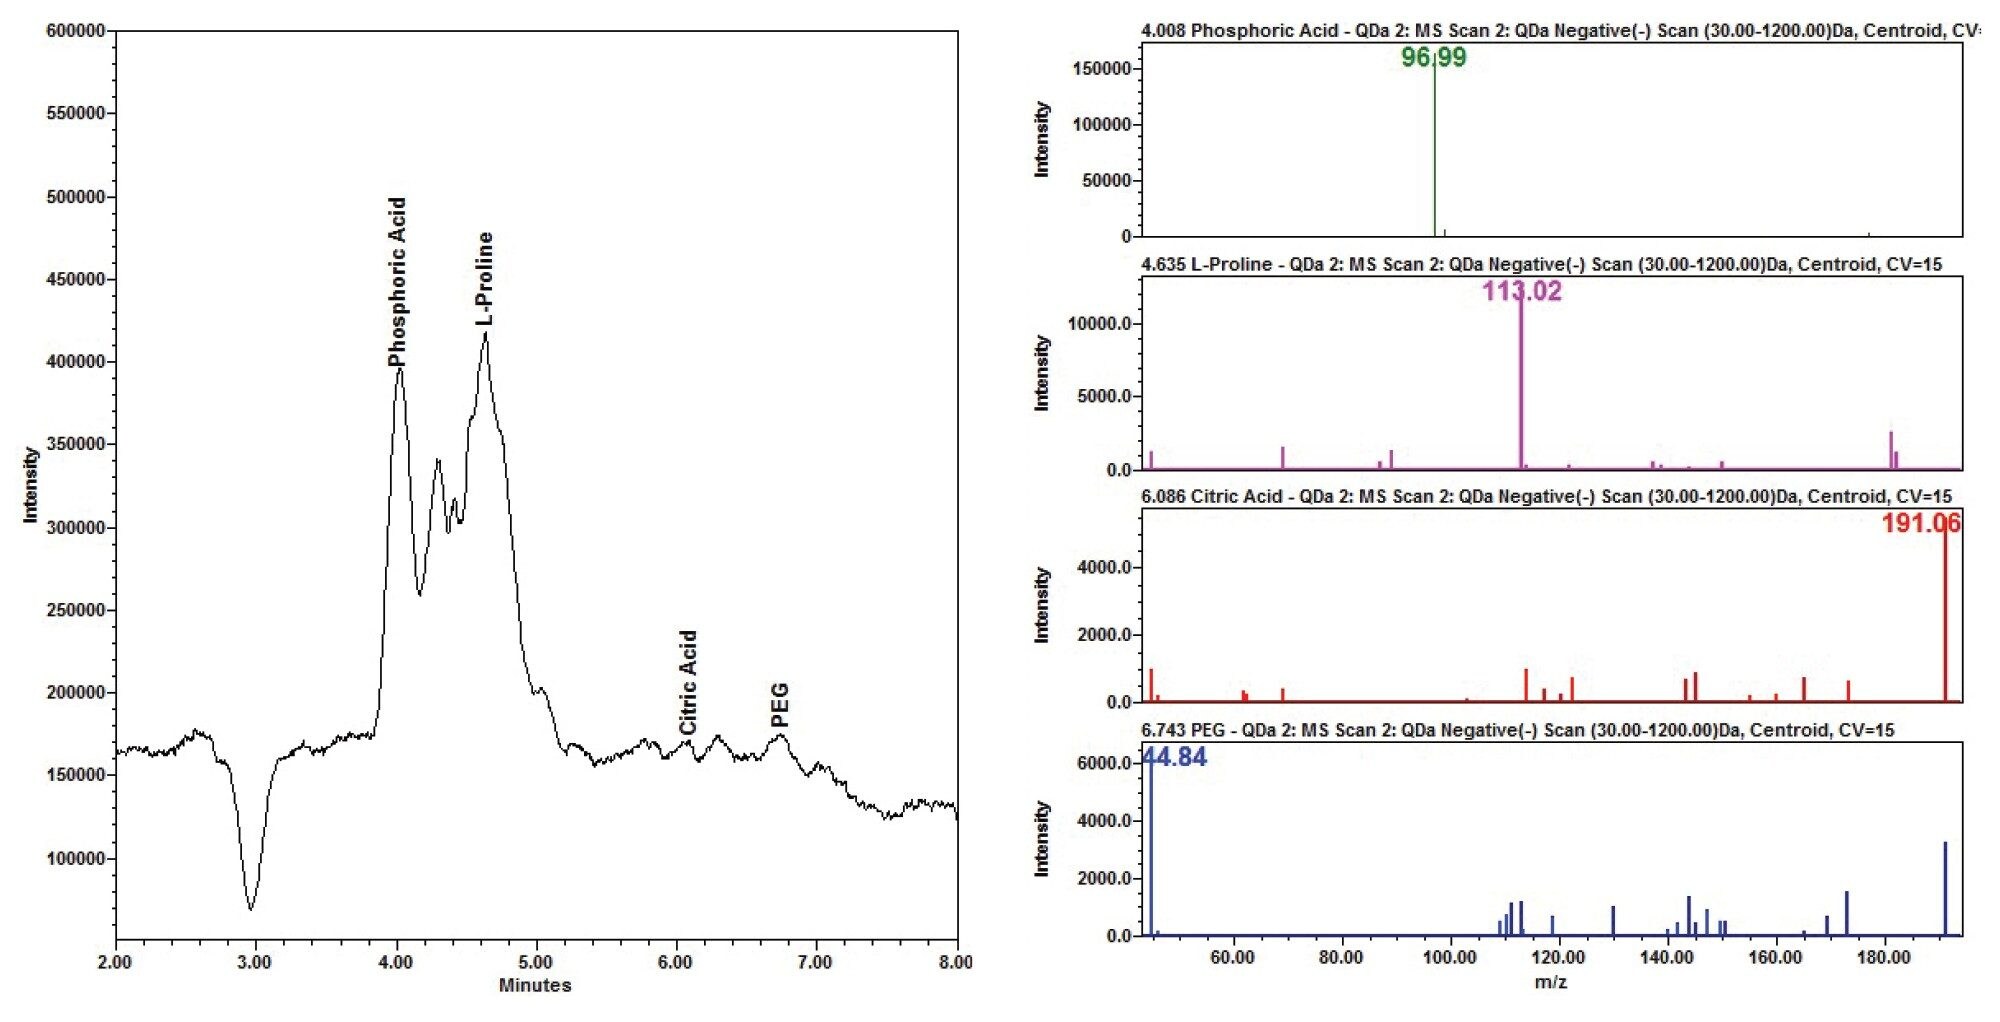
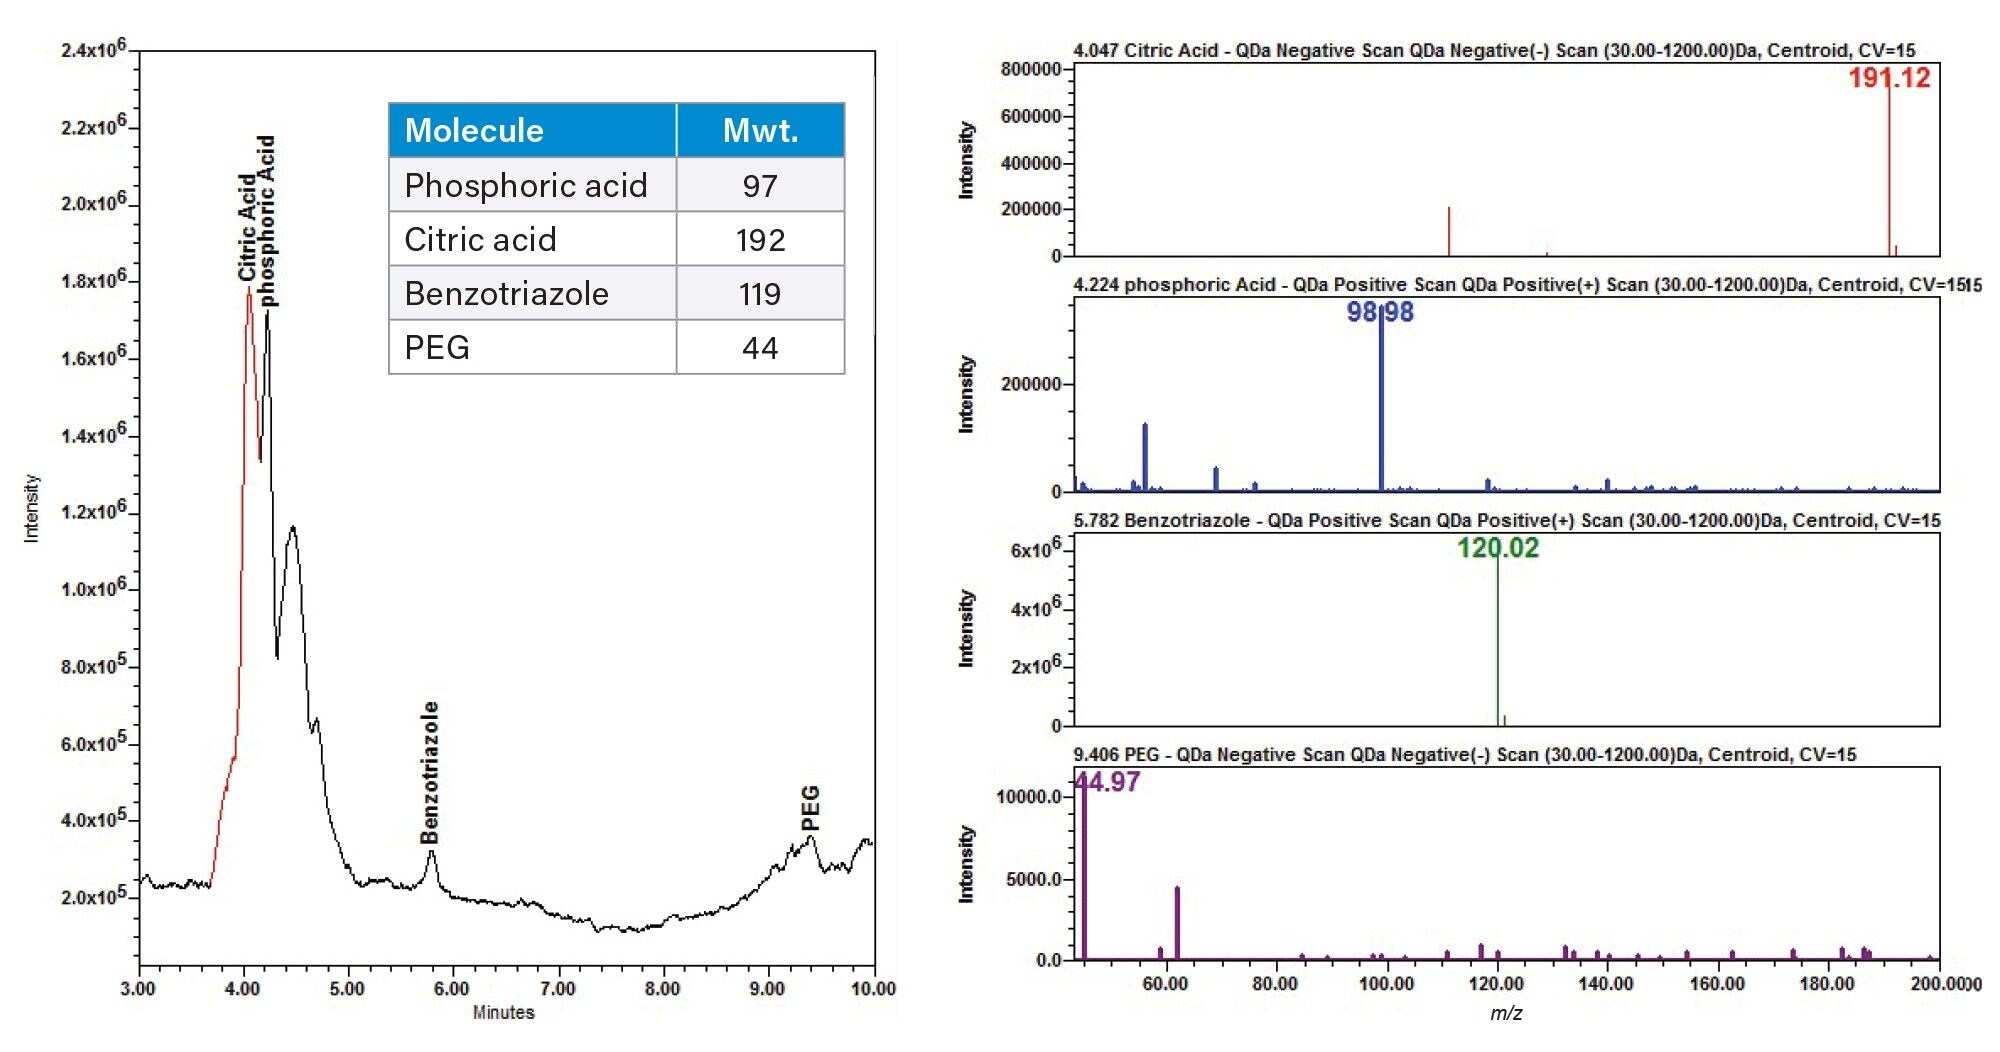
The Ludox supernatant revealed one peak in the PDA while the QDa scan revealed multiple peaks. Some of these peaks were identified as common slurry additives by their m/z values in the CMP slurry supernatant as phosphoric acid, citric acid, polyethylene glycol (PEG), and L-proline (Figure 2).
For the QDa data, the CMP additive Mix A additives phosphoric (m/z 97), and benzotriazole (m/z 119) were extracted in positive ionization mode, and the citric acid (m/z 192) and PEG (m/z 44) additives were extracted in the negative ionization mode. The phosphoric acid and PEG were detected at low intensities with a small amount of background signal noise (Figure 3).
The PDA data for ten consecutive injections of additive Mix A was processed in Empower 3 (Figure 4), and the data tables for peak retention time and peak area were reported (Tables 6a and 6b). The peak retention times had excellent %RSD < 0.1%. The peak areas had typical %RSD values expected in a mixture excluding the benzotriazole value. The higher area %RSD values are likely due to chemical interactions.
The PEG concentration in the mixture was optimized to overcome its low level of UV visibility and low intensity response in the QDa. The phosphoric acid in the additive mixture increased the PEG UV activity.5 The benzotriazole was the most UV active chemical in the additive mixture due to its ring structure.
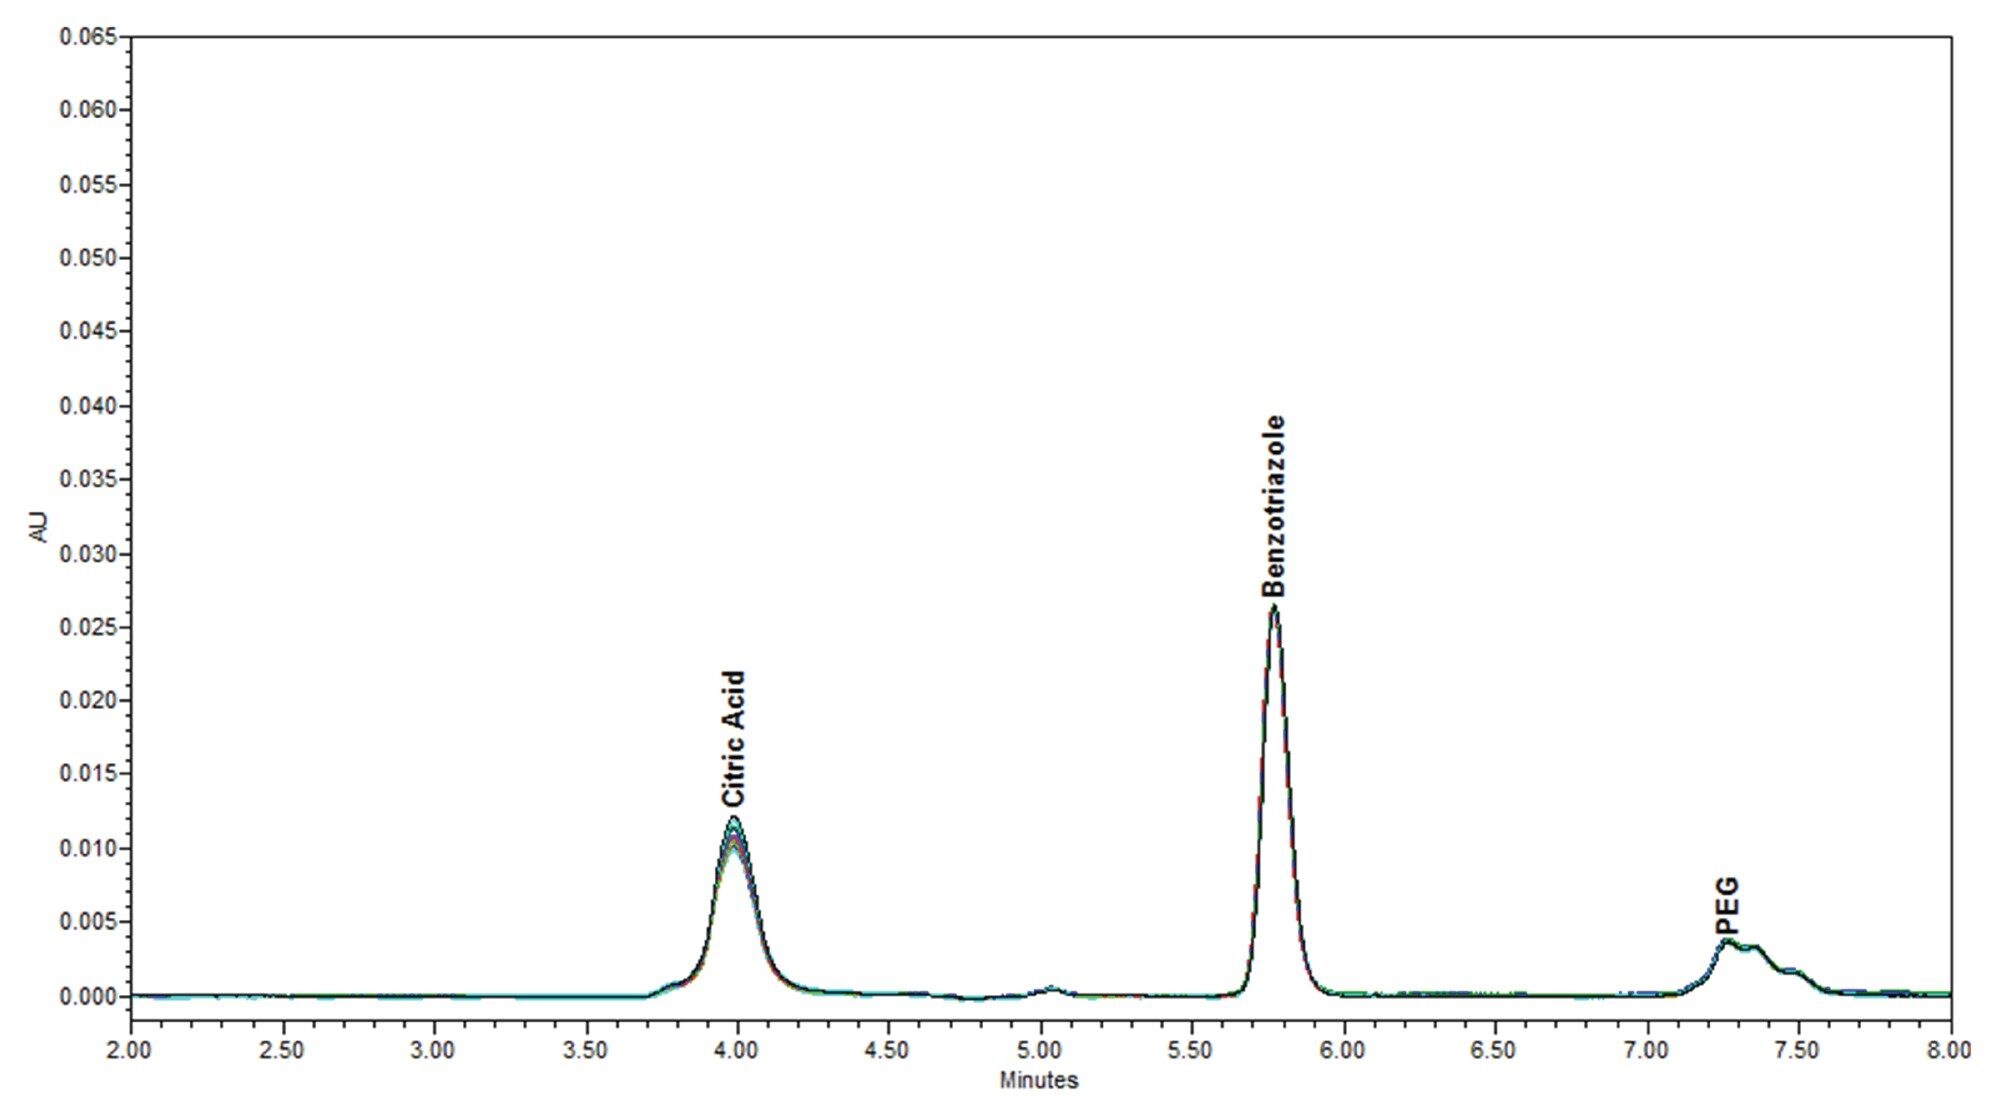
Table 6a
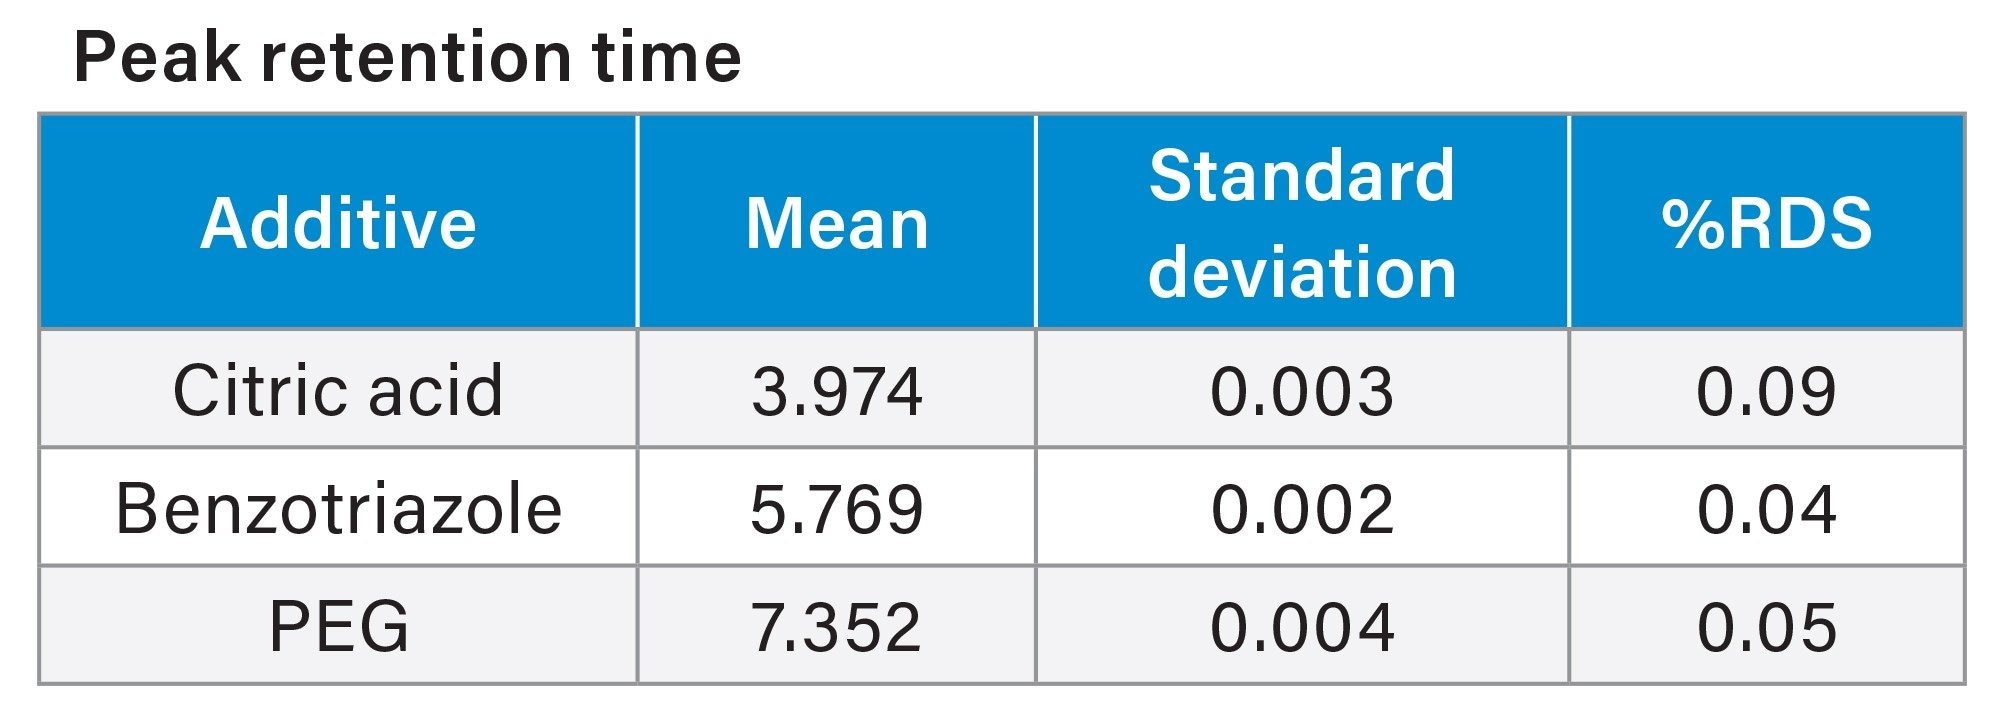
Table 6b
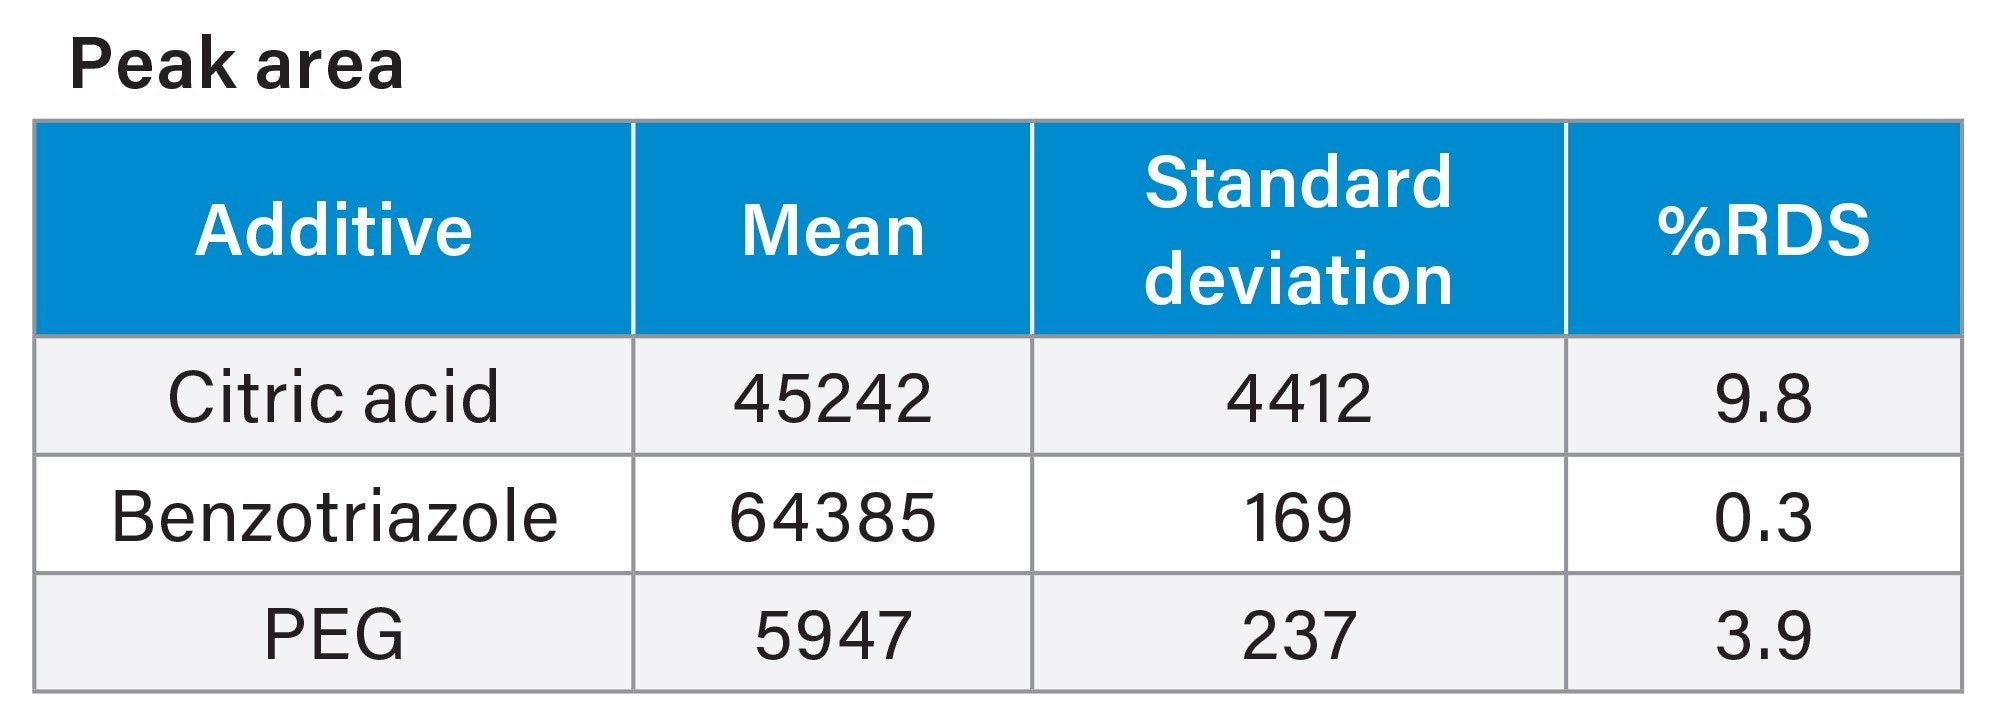
Tables 6a and 6b. CMP additive Mix A Empower 3 System suitability peak retention times and peak areas PDA data analysis.
Linearity and Recovery
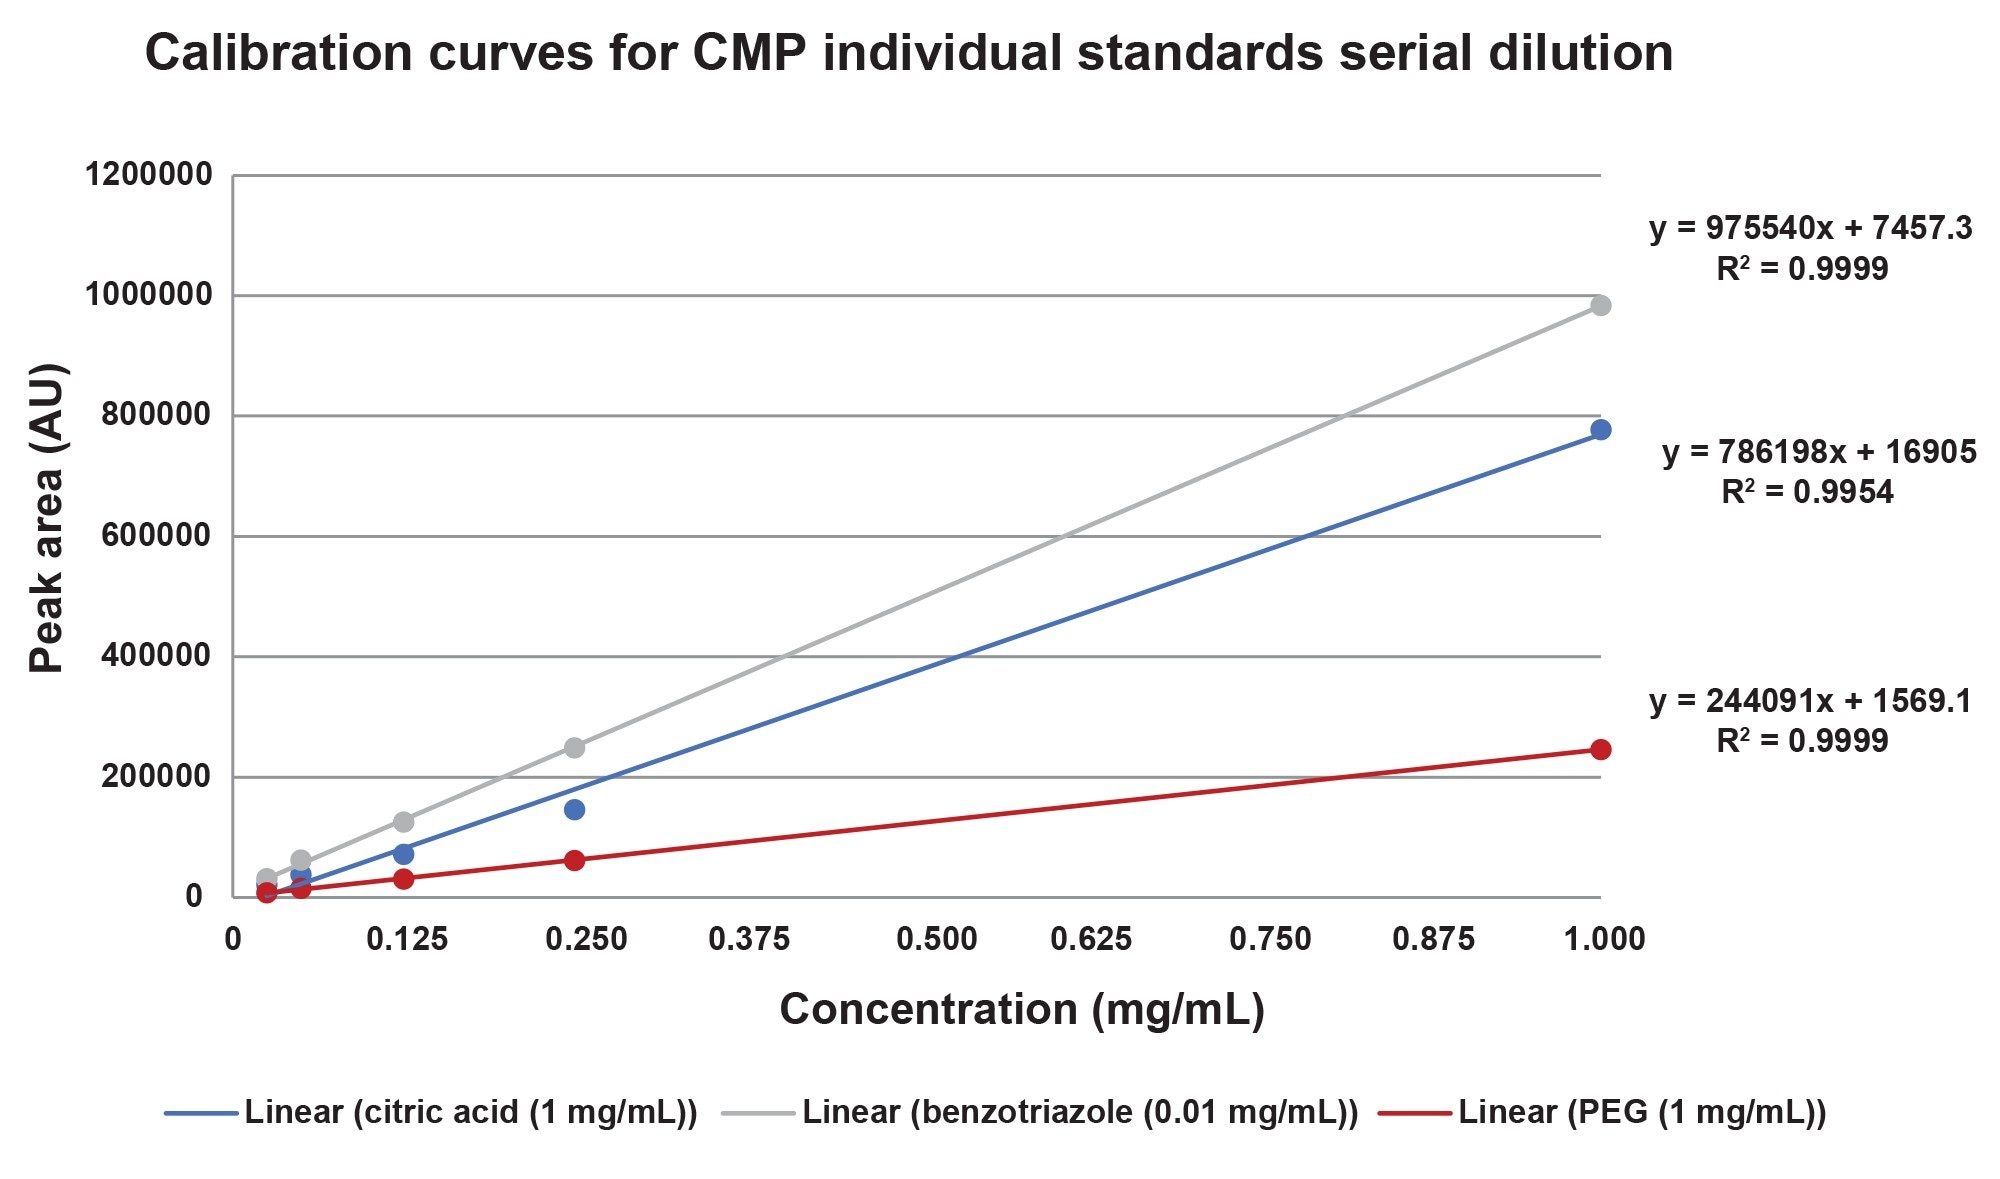
To assess compound linearity calibration standards with concentrations ranging from 0.01 mg/mL to 1 mg/mL were prepared in solvent standards as well as in CMP slurry matrix and analyzed for each target compound. No internal standards were used.
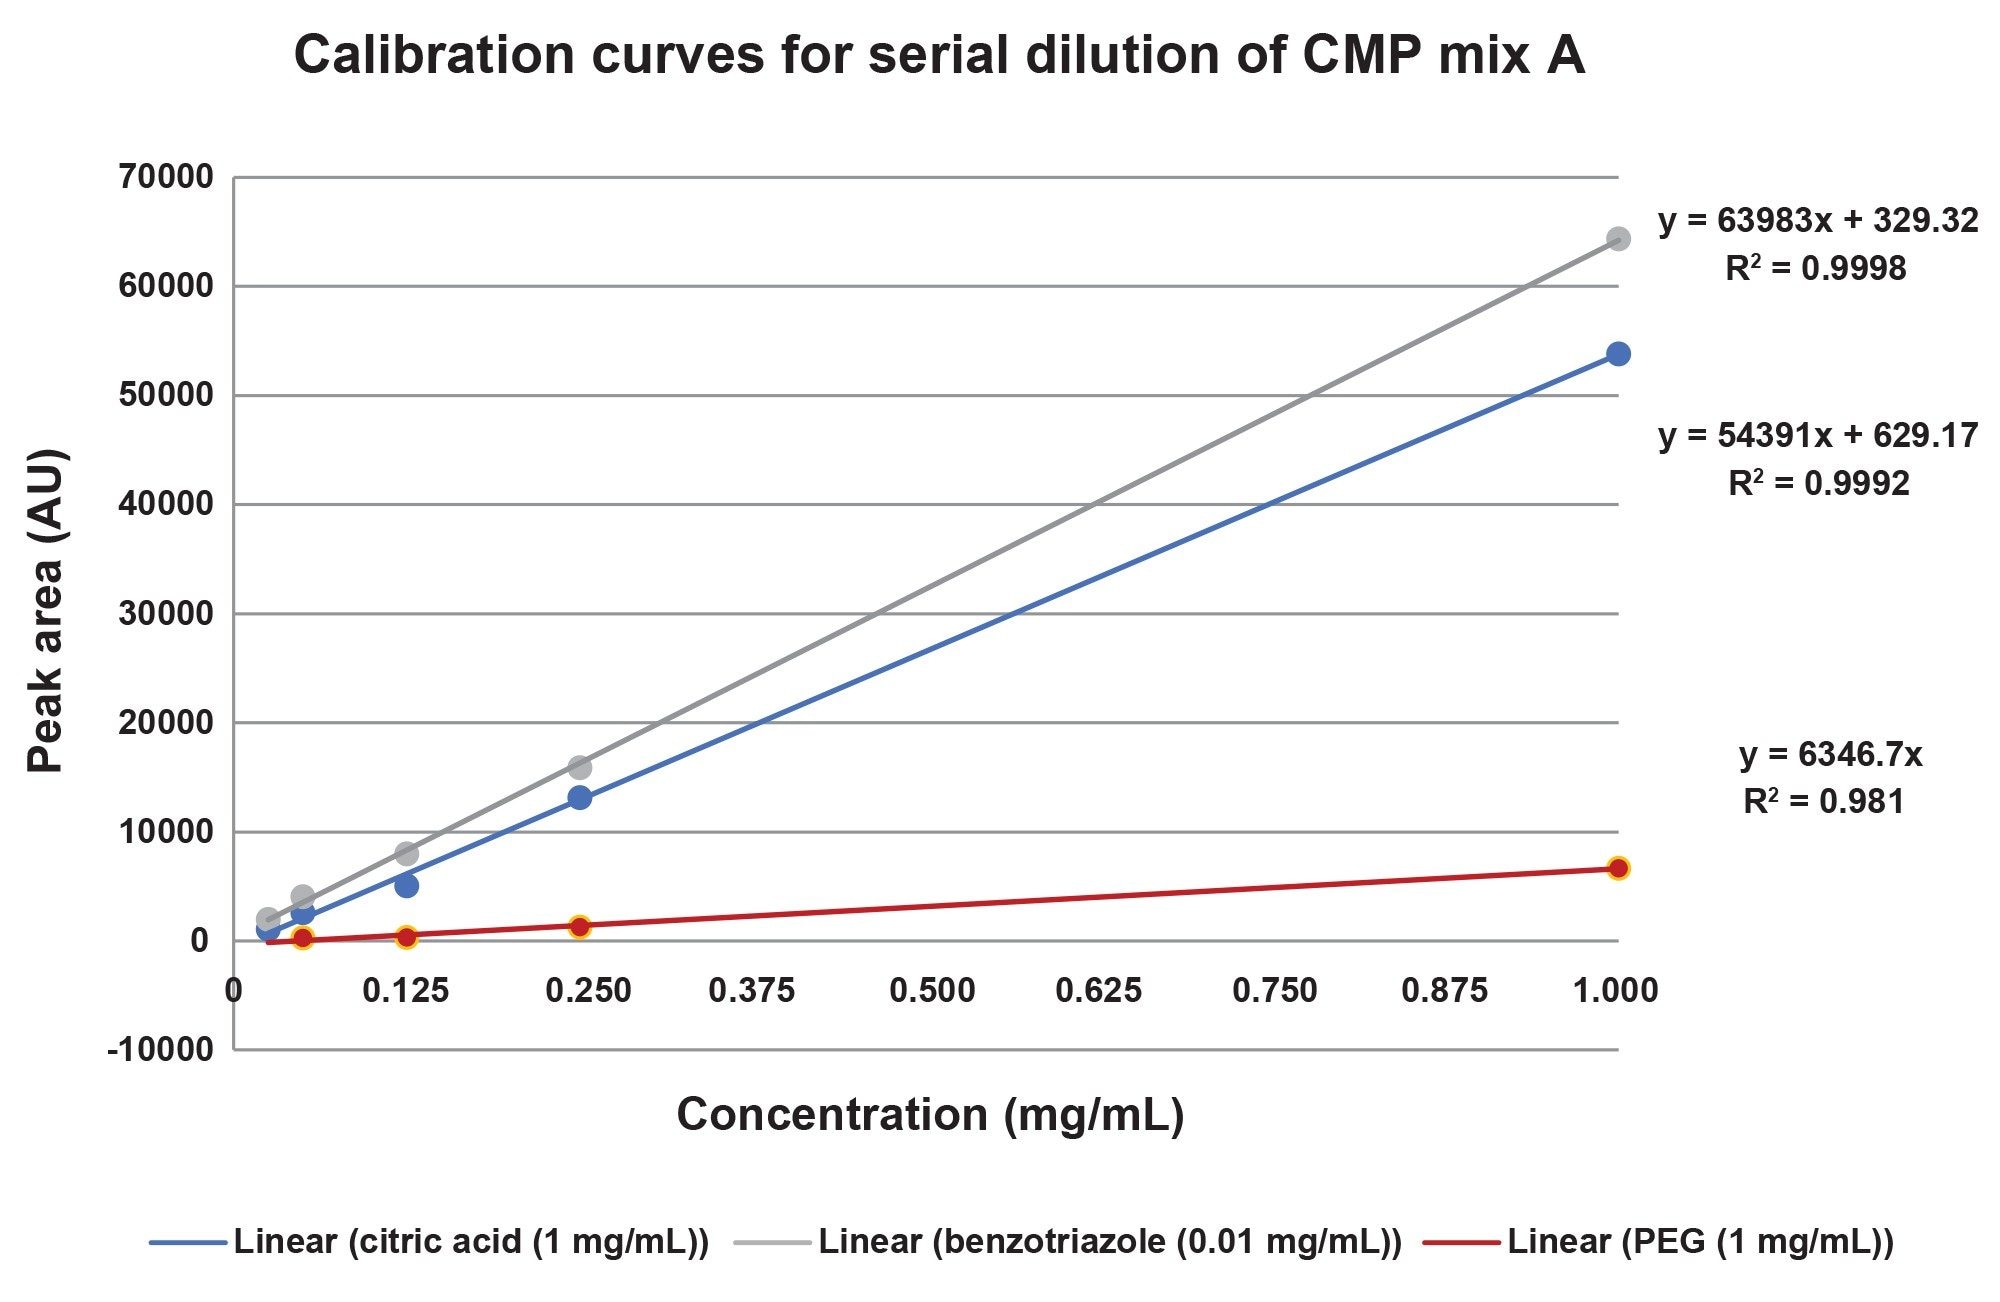
The calibration response of the individual standards and the CMP Mix A are compared below, in figures 5a and 5b. Generally, the coefficient of determination R2 was >0.995 indicating excellent linear response. There is a lower R2 value (0.98) on the PEG curve in the additive mixture, and this change may be due to interaction of the PEG in the Mix A sample.
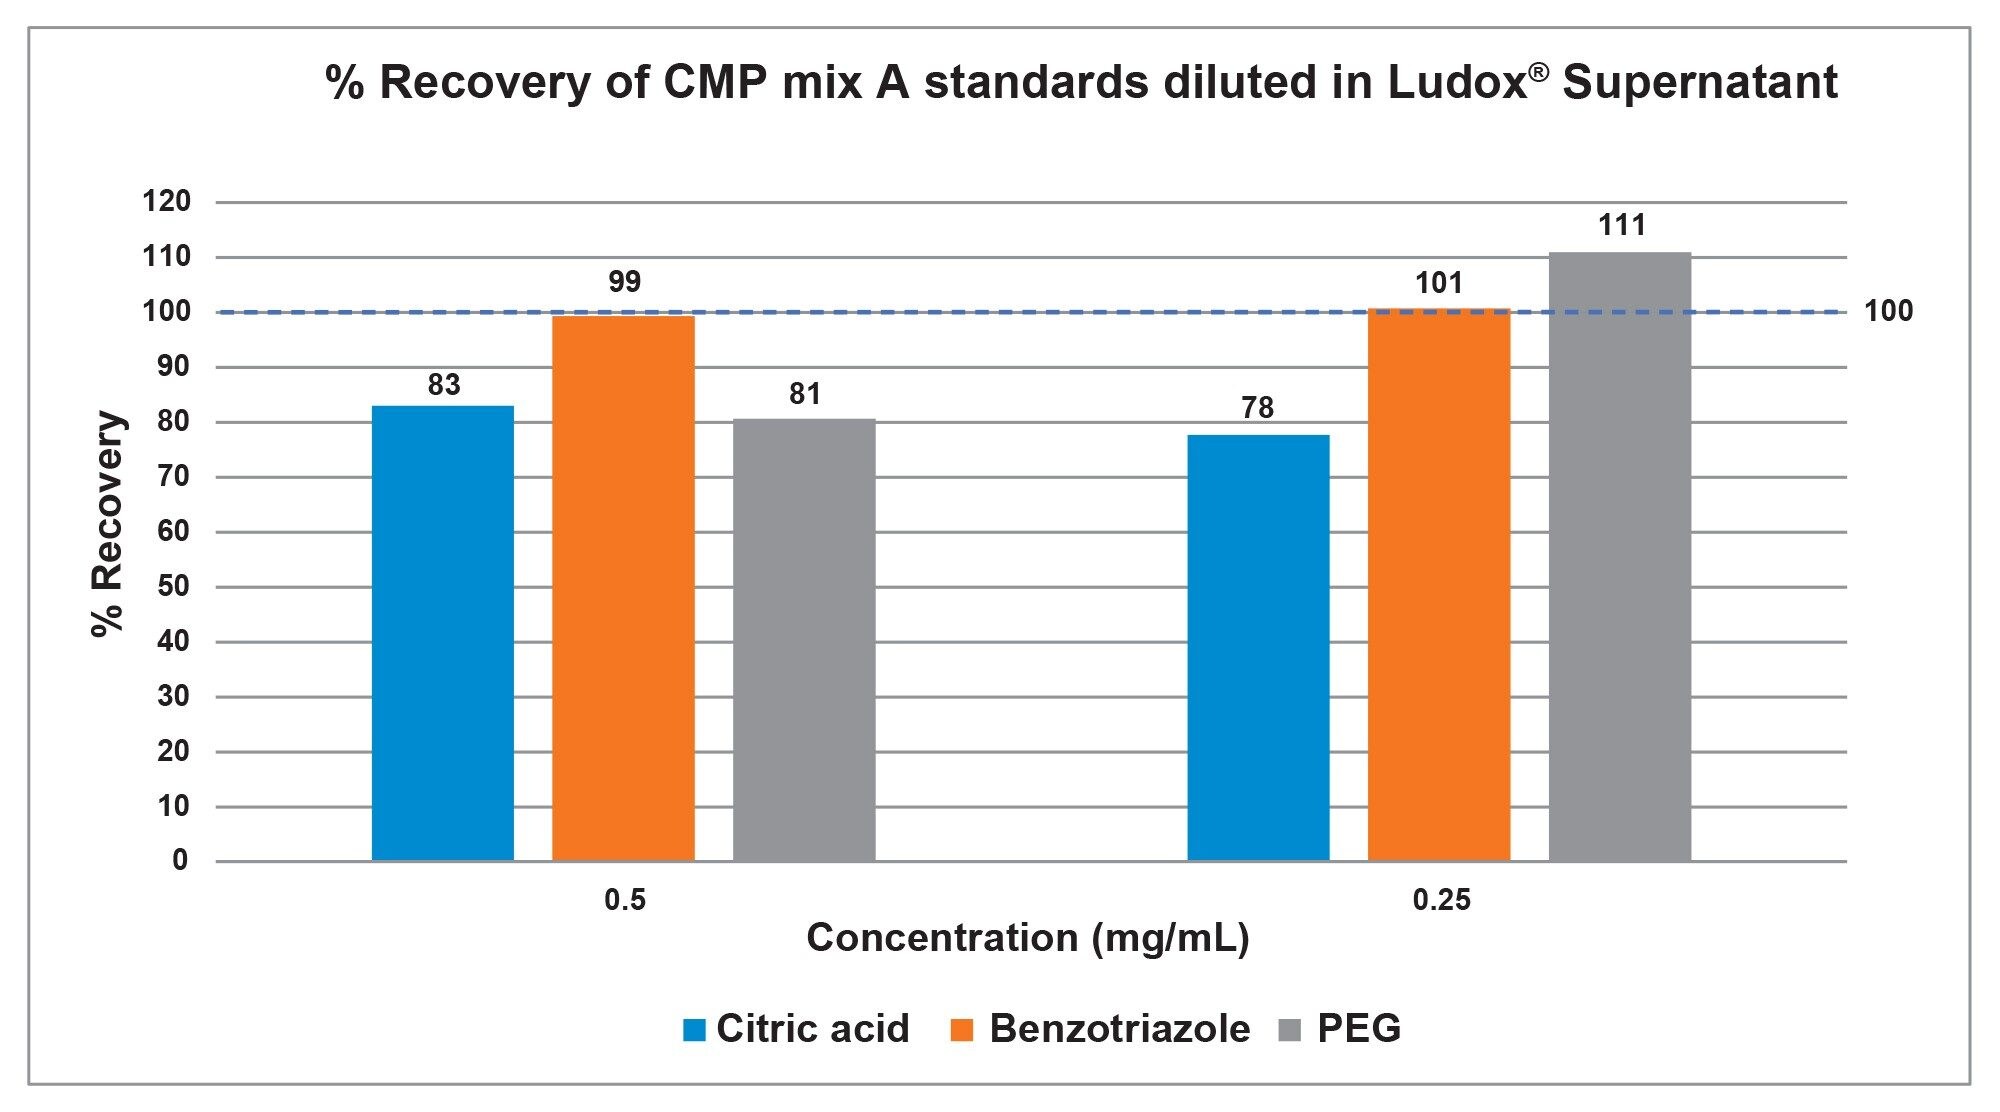
The percent recovery of the CMP mixture individual standards spiked into the Ludox supernatant, based on PDA peak areas, is indicative of the limits of concentration detection within the method. The benzotriazole is recovered well with percent recovery values between 99–101%, the citric acid is recovered at 78–83% that are likely due to a matrix effect, and the PEG is recovered at 81–111% (Figure 6).
The percent recovery of the CMP Mix A in a serial dilution using the Ludox supernatant as a diluent was noted as having a large matrix effect. Benzotriazole was the only additive standard detected at all the dilution levels significant enough in the PDA for quantification use. Although the matrix effects were stronger for the citric acid and PEG in the Mix B, the citric acid did have some quantitative data as well as peaks from the QDa Mass Detector for qualitative data.
Conclusion
The results from the experiments performed demonstrate a simple, routine analytical approach for the analysis of additives in CMP slurry using Arc HPLC coupled with PDA and Single Quadrupole Mass Detector. All target analytes were baseline separated on Waters XBridge BEH 5 µm Column in under fifteen minutes. Excellent repeatability of results was obtained as demonstrated by calculating peak area %RSD for citric acid, benzotriazole, and PEG with %RSD values between 0.3–10% (n=10 consecutive injections). Retention time stability was achieved with %RSD <0.1%, and linearity of the calibration curves for the standards produced R2 values at >0.995.
Overall, the combination of Arc HPLC, PDA, and QDa Mass Detection can be routinely used for robust and confident quantification of CMP slurries additives. Empower 3 CDS enables acquisition, processing, and reporting of data acquired with the PDA and the QDa Mass Detection in one software platform.
References
- Raghavan S, Keswani M, Jia R, Particulate Science and Technology in the Engineering of Slurries for Chemical Mechanical Planarization, Kona Powder and Particle Journal 2008;26:94–105.
- Nagendra Prasad Y, Ramanathan S, Role of Amino-Acid Adsorption on Silica and Silicon Nitride Surfaces during STI CMP, Electrochemical and Solid-State Letters 2006;9(12):G337.
- Analysis of Organic Additives in CMP Slurry, Toray Research Center, Inc., https://www.toray-research.co.jp/en/technicaldata/pdf/TechData_S00194E.pdf.
- Ludox® TM-50 Colloidal Silica Technical Data Sheet, https://www.chempoint.com/products/grace/ludox-monodispersed-colloidal-silica/ludox-colloidal-silica/ludox-tm-50.
- Rodrigues PCA, Beyer U, Schumacher P, Roth T, Fiebig HH, Unger C, Messori L, Orioli PL, Paper DH, Mülhaupt R, Kratz F, Acid-Sensitive Polyethylene Glycol Conjugates of Doxorubicin: Preparation, in vitro Efficacy and Intracellular Distribution, Bioorganic & Medicinal Chemistry 1999;7(11): 2517–2524.
Acknowledgements
Nobutake Sato, Jinchuan Yang, Paula Hong, Catherine Layton, Margaret Maziarz, Dimple Shaw.
Featured Products
720007596, April 2022