• 응용 자료

Effective Use of Survey Scan on Xevo TQ-XS for Qualitative Analysis of Herbal Samples

Effective Use of Survey Scan on Xevo TQ-XS for Qualitative Analysis of Herbal Samples

  • Bheeshmacharyulu S
  • Dilshad Pullancheri
  • Padmakar Wagh
  • Waters Corporation

This is an Application Brief and does not contain a detailed Experimental section.

Abstract

This application brief demonstrates to increase the efficiency and productivity for qualitative analysis time of complex samples like herbal extracts.

Introduction

Nowadays there is an urgent need to develop effective and selective methods to stimulate research of complex samples. Complex samples usually contain various component mixtures, their separation creates a big challenge for the process of identification and characterization. Mass spectrometry is a powerful analytical technique for the identification of unknown compounds, quantification of known compounds and to elucidate the structure and chemical properties of molecules.

A typical qualitative analysis of complex samples like herbal extraction samples using tandem quadrupole instruments can require multiple injections. Comprising samples run in MS scan mode and then further injections in daughter ion mode. For a complex sample creating the daughter ion method can be a laborious process. Each parent needs to be manually identified and a separate daughter scan created for each parent. Use of survey scan eliminates the need for a second acquisition. Survey scan allows automatic switching from one scan type to another based on various user defined triggers. For improved sensitivity survey scan can also utilize ScanWave for the MS and DS modes.

Figure 1. Xevo TQ-XS with ACQUITY UPLC I-Class Plus

Experimental

System:

Xevo TQ-XS with ACQUITY UPLC I-Class/SM-FTN

Column:

ACQUITY UPLC HSS T3, 2.1 x 150 mm, 1.8 µm

Detector:

ACQUITY UPLC PDA Detector

Flow rate:

0.4 mL/min

Mobile phase A:

0.05% Acetic acid in water

Mobile phase B:

0.05% Acetic acid in methanol

Column temperature:

40 ˚C

Injection volume:

5 µL

Sample concentration:

1 mg/mL

Wash and purge solvent:

1:1 (Water:Acetonitrile)

Sampling rate:

10 pts/sec

Wavelength:

210 to 400 nm

Gradient Program:

MS Method Parameters:

MS Survey Scan Parameters:

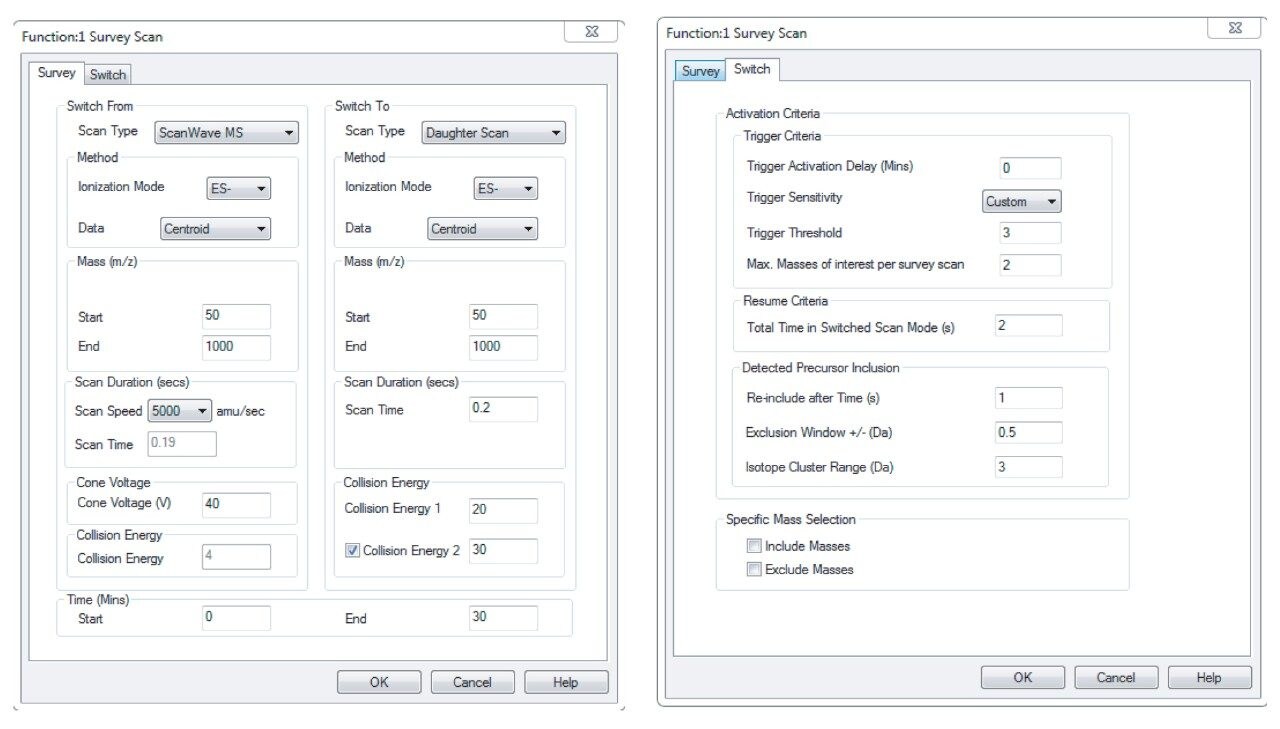
Survey Scan Switch tab function parameters for selecting the number and intensity of Parent and Product ions:

Trigger Activation Delay (Min): It defines the delay (in minutes) before the instrument switches between scans.

Trigger Sensitivity: It sets the peak height at which to trigger the switch-to function to detect the Parent and Product ions. Select high, medium, low or select custom to enter a threshold value.

Trigger Threshold: It specifies the custom threshold at which to trigger the switch-to function to detect the Parent and Product ions response. We can set the threshold from 1 to 10, here 1 = 3.3e4,2 = 6.6e4,3 = 1.0e5,4 = 3.3e5,5 = 6.6e5,6 = 1.0e6,7 = 3.3e6,8 = 6.6e6,9 = 1.0e7,10 = 3.3e7.

Max. Masses of interest per survey scan: It selects the maximum number of peaks (Parent and Product) of interest (up to 8) to detect from the switch-from scan. The setting we specify for this parameter defines the number of masses the instrument surveys per switch, for example, where the intensities of 3 masses exceed the threshold, a setting of 2 causes the instrument to trigger on the two most intense masses only.

Total Time in Switched Scan Mode(s): It defines the minimum total time spent in the switch-to scan mode. The switch-to function switches back to the switch-from function after the specified time elapses.

Re-include after Time(s): It defines the time (in seconds) for which the software excludes a mass, once that mass is switched on. After this time elapses, the mass is again included.

Exclusion Window +/- (Da): It defines the span (in Daltons) excluded from triggering around a mass, after that mass is switched on.

Isotope Cluster Range (Da): It defines how far the exclusion span extends up the mass scale, to prevent triggering on isotopes of the last triggered mass.

Results and Discussion

Qualitative analysis of herbal extracts on Xevo TQ-XS demonstrated the effective use of survey scan tool that speeds up the analysis time, thus improving productivity in comparison with the conventional MS and daughter scan. Analysis time scale for survey scan mode is significantly less in comparison to the LC-MS and LC-MS/MS data acquired in multiple runs.

 Table 1. Calculation of productivity of Survey scan method and conventional MS Scan and Daughter Scan method.

ScanWave MS Chromatogram

The ScanWave MS (MS Full scan) chromatogram obtained from the herbal sample analysis is shown in Figure 2. Here we can see that a significant number of peaks were detected within 30 min runtime in ScanWave MS chromatogram and automatically selected for ScanWave Daughter Scan analysis.

Figure 2. Survey Scan (ScanWave MS) precursor ion chromatogram for herbal sample.

The Xevo TQ-XS mass spectrometer’s ability to rapidly switch between MS and Daughter Scan allowed the narrow UPLC peaks to be correctly defined. In this approach, MS and Daughter Scan data are collected in an unbiased manner and qualitative analysis can be done for herbal samples.

The ScanWave MS (MS Full scan) spectrum and ScanWave DS (MS/MS) spectrum of peak at RT 14.77 min is shown in Figure 3. Here the precursor ion m/z 592.86 was automatically selected based on the triggered sensitivity criteria and display fragmented ions m/z 352.65, m/z 382.73, m/z 472.69 and m/z 502.89 in daughter ion scan spectrum. Based on characteristic fragment ions observed for m/z 592.86, it was identified as Vicenin.

Figure 3. Shown is an example of a Survey Scan for herbal sample qualitative analysis and Vicenin (m/z 592.86) triggered in initial ScanWave MS Survey function at RT 14.77 min and switches to ScanWave DS mode.

The extracted ion chromatogram for the parent compound Vicenin m/z 592.86 is shown in Figure 4, which was eluted at RT 14.77 min in ScanWave MS Chromatogram.

Figure 4. Extracted precursor ion (m/z 592.86) chromatogram from Survey Scan ScanWave MS.

The extracted ion chromatograms for the fragmented ions m/z 502.89, m/z 472.69, m/z 382.72, m/z 352.64 of m/z 592.86 from daughter scan spectrum is shown in Figure 5.

Figure 5. Extracted product ions m/z 502.89, m/z 472.69, m/z 382.72 and m/z 352.64 chromatograms of m/z 592.86 from Survey Scan ScanWave DS.

The Possible fragmented ions of Vicenin m/z 592.86 are shown in Figure 6.

Figure 6. Possible fragmented ions of Vicenin.

Table 2 explains the example of survey scan for herbal sample qualitative analysis and Sinapaldehyde, Vicenin, Trans-3′-isopentadienyl-3,5,4′-trihydroxystilbene (IPD) isomer 2, 3,4-O-Dicaffeoylquinic acid, and Trans-arachidin-3 molecules were identified based on the precursor ion and product ions. To confirm the presence of these known compounds, literature survey was performed for product ions and matched with the obtained spectra as mentioned in Table 2.

Table 2. Identified precursor ion and respective product ions using survey scan for herbal sample qualitative analysis.

Conclusion

  • Xevo TQ-XS features StepWave ion transfer optics that demonstrates enhanced sensitivity for challenging samples. Xevo TQ-XS also features ScanWave Collison cell technology enabled for enhanced MS/MS Spectral performance (product ion scanning), it facilitates the simultaneous acquisition of MS and MS/MS data in one injection (run).
  • Xevo TQ-XS has high scan speed (up to 20000 Da/s) allows for survey scan experiments to be performed with enough points across the peak and this capability facilitates data-directed experiments, where real-time switching between MS and MS/MS allows more information to be acquired from a single injection. This reduces the need for separate experiments and accelerates the process of structural identification and unknown compound determination.
  • Qualitative application on a tandem quadrupole using real time data directed switching speeds up the acquisition time for analysis of multiple samples and accelerates the data interpretation time required for characterization of complex samples.

References

  1. Development and validation of a LC-ESI-MS/MS method for the determination of phenolic compounds in honeydew honeys with the diluted-and-shoot approach. Food Research International. 2016;87:60-67.
  2. LC-MS/MS analysis, antioxidant and anticholinergic properties of galanga (Alpinia officinarum Hance) rhizomes. Industrial Crops and Products. 2015;74:712-721.
  3. LC-ESI/LTQOrbitrap/MS/MS and GC-MS profiling of Stachys parviflora L. and evaluation of its biological activities. Journal of Pharmaceutical and Biomedical Analysis. 2019..
  4. LC-MS/MS profiles and interrelationships between the anti-inflammatory activity, total phenolic content and antioxidant potential of Kalasin 2 cultivar peanut sprout crude extract. 2018;239:569-578.
  5. LC/ESI-MS/MS profiling. Journal of Functional Foods. 2016;26:645-656.
  6. LC-MS/MS method validation for the quantitative investigation of 37 fingerprint phytochemicals in Achillea species: A detailed examination of A. coarctata and A. monocephala. J Pharm Biomed Anal. 2018;154:413-424.
  7. Marian Twohig, Andrew Aubin, Michael Jones, and Robert S. Plumb. Improving qualitative conformation using Xevo TQ MS with Survey Scanning.
  8. Extraction, Isolation, and Characterization of Natural Products from Medicinal Plants (International Journal of Basic Sciences and Applied Computing (IJBSAC) ISSN: 2394-367X, Volume-2 Issue-6, December 2018).
  9. Simplifying Qual/Quan Analysis in Discovery DMPK using UPLC and Xevo TQ MS.

720006932, May 2020

맨 위로 돌아가기 맨 위로 돌아가기