• 응용 자료

Evaluating the Performance of the ACQUITY Arc Bio UHPLC System for the Size-Exclusion Chromatography Analysis of a Monoclonal Antibody

Evaluating the Performance of the ACQUITY Arc Bio UHPLC System for the Size-Exclusion Chromatography Analysis of a Monoclonal Antibody

  • Corey Reed
  • Stephan M. Koza
  • Weibin Chen
  • Waters Corporation
Comprehensive tools for intact protein analysis

Abstract

Extra column dispersion is an important factor to consider when choosing a system to perform SEC. Here we will evaluate system dispersion on the ACQUITY Arc Bio, Alliance, and ACQUITY UPLC H-Class Bio systems and its impact on the separation of trastuzumab aggregates and fragments. We have also demonstrated that analysis time and sample throughput requirements need to be carefully considered when choosing a SEC separation method for mAbs.

Benefits

  • ACQUITY Arc Bio UHPLC provides the performance required for the separation of monoclonal antibodies and their aggregates on sub-2-μm particle size exclusion columns
  • ACQUITY Arc Bio provides effective monoclonal antibody fragment separations when using tandem 3.5 μm particle size exclusion columns
  • ACQUITY Arc Bio is designed to withstand the corrosive effects of high salt buffers used for size exclusion chromatography

Introduction

Size-exclusion chromatography (SEC) is the chromatographic method of choice for the separation of proteins and their impurities based on the hydrodynamic radius of their tertiary or quaternary structure under non-denaturing conditions. This is important when maintaining the native structure of a protein is necessary to monitor biotherapeutic product quality. One particular case that will be investigated here is the separation of the monoclonal antibody (mAb) trastuzumab (Herceptin) using SEC to determine the level of high molecular weight (HMW) aggregation as well as low molecular weight (LMW) fragmentation in the formulated drug product. These are two product quality attributes (PQA) of mAbs, as HMW aggregation is known to elicit an immune response when present in high enough amounts and LMW fragmentation is a sign of manufacturing or storage issues.1

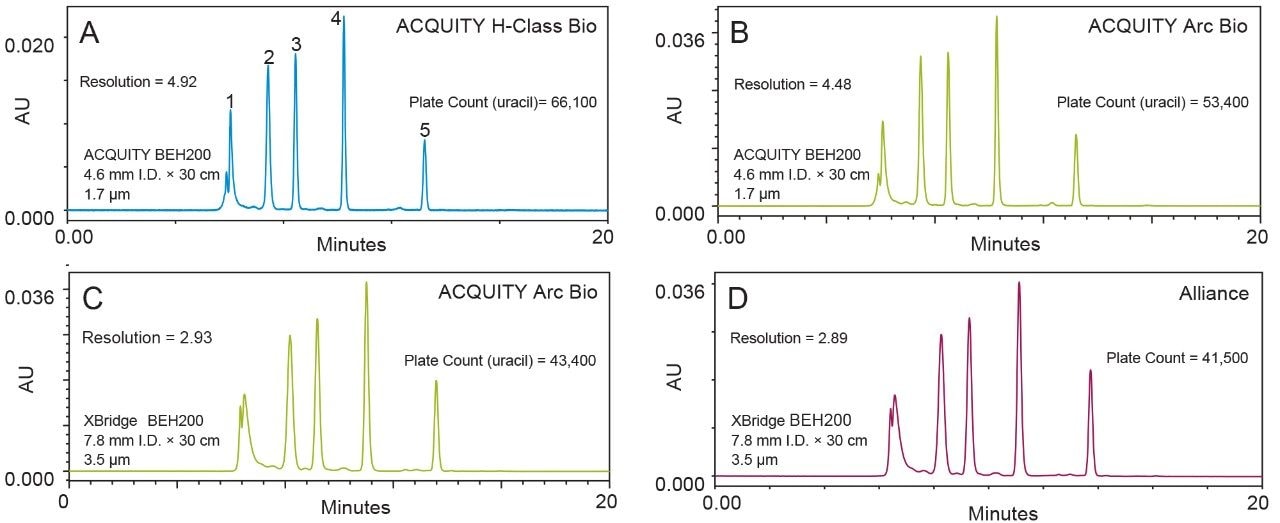
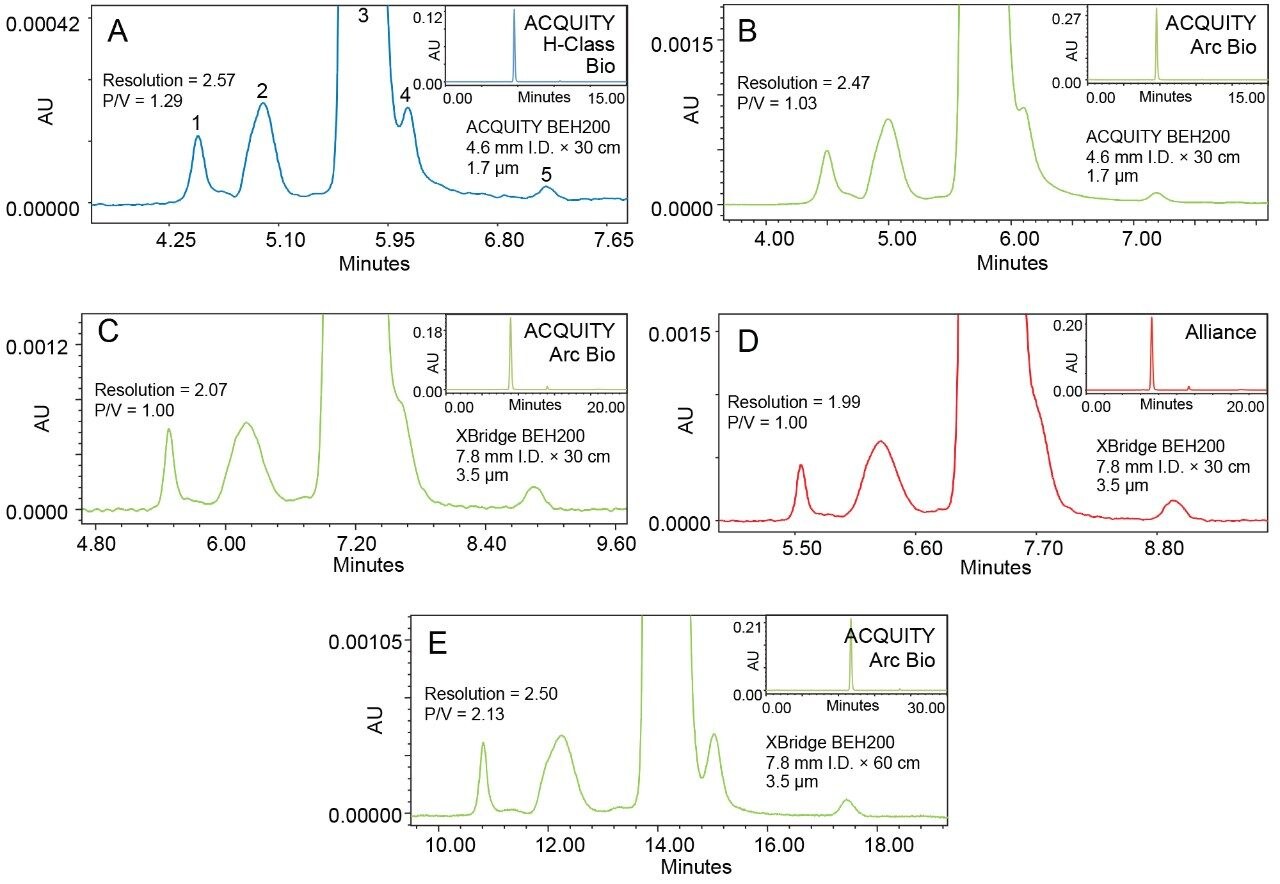
Waters offers both ultra-performance liquid chromatography (UPLC) and high performance liquid chromatography (HPLC) BEH Columns for SEC mAb analysis. The 4.6 mm internal diameter (I.D.) ACQUITY UPLC Column is packed with 1.7 µm diameter particles and the 7.8 mm I.D. XBridge HPLC Column is packed with 3.5 µm diameter particles, both of which have 200 Å pores. Traditionally, HPLC SEC separations are performed on the Alliance HPLC System and UPLC SEC separations are performed on the ACQUITY UPLC H-Class Bio System. However, in 2016 Waters launched the ACQUITY Arc ultra high performance Liquid Chromatography (UHPLC) system which was designed as a stepping stone in performance between the Alliance HPLC and ACQUITY UPLC H-Class System. Recently, Waters introduced a biocompatible version of the ACQUITY Arc System which uses titanium and MP35N alloy components in the wetted flow path in place of stainless steel, making the system more corrosion resistant under high salt conditions such as those required by SEC. 

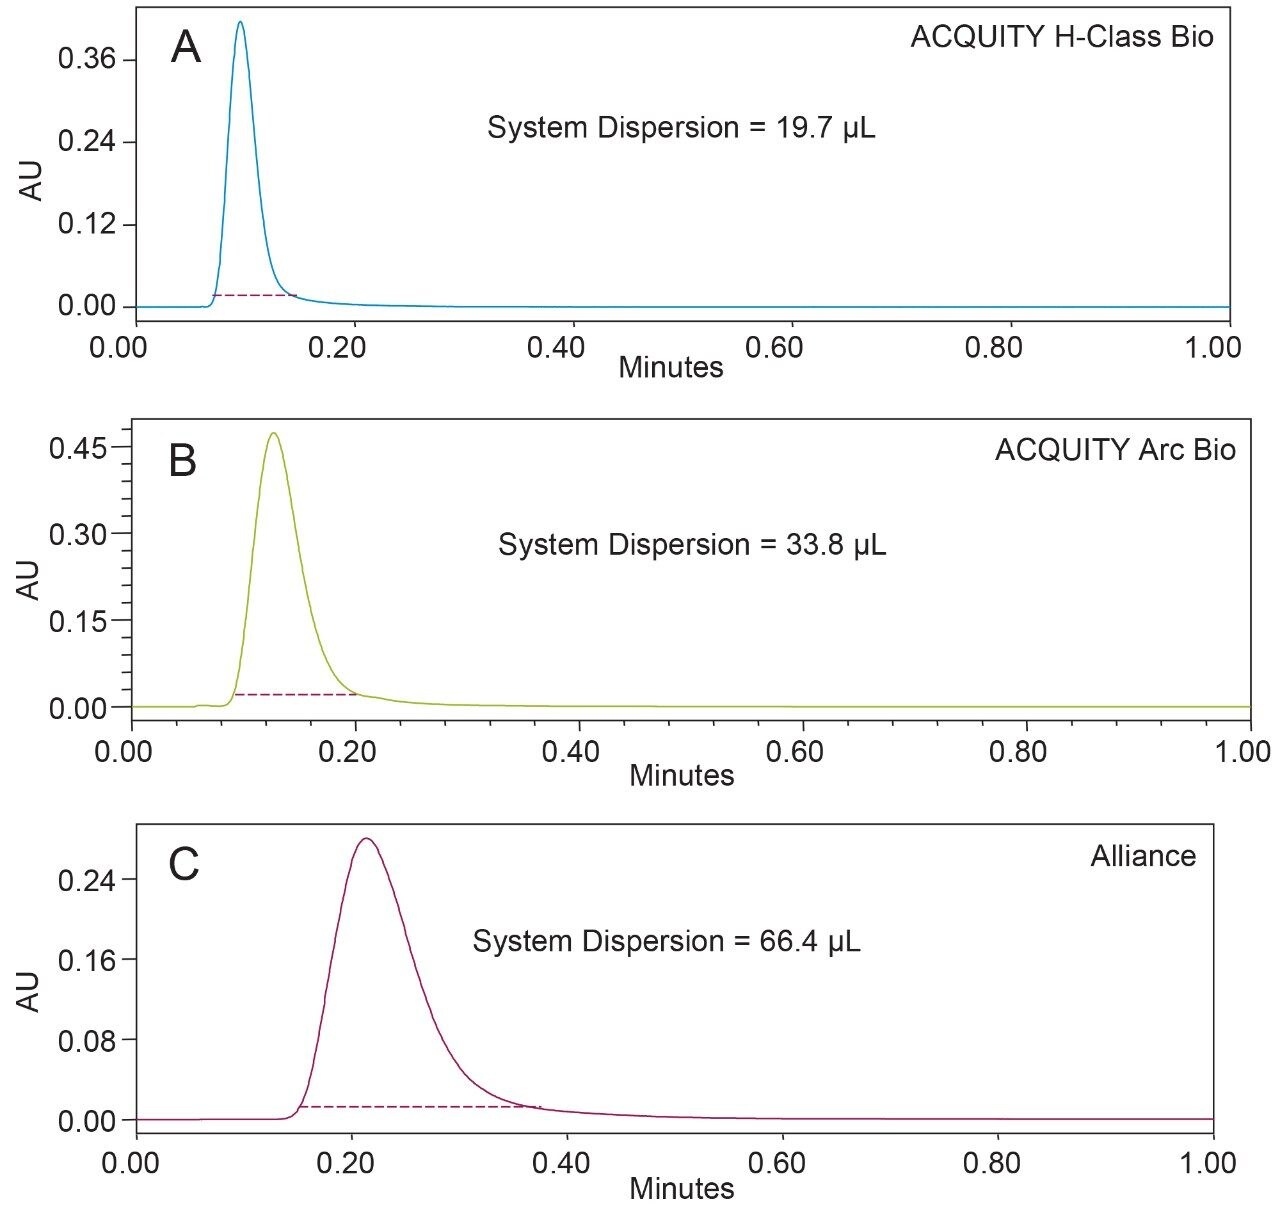
With regards to SEC separations, a critical performance characteristic of the LC system is extra column dispersion, which can be defined as the band broadening effects exhibited by an injected sample that are caused by the flow path of the LC system. 

The impact of extra column dispersion on SEC separations has been discussed in detail in two recent application notes; “Impact  of LC System Dispersion on the Size-Exclusion Chromatography Analysis of Monoclonal IgG Antibody Aggregates and Fragments: Selecting the Optimal Column Configuration for Your Method” (Waters Application Note, 720006336EN) and “Evaluating the Impact of LC System Dispersion on the Size-Exclusion Chromatography Analysis of Proteins” (Waters Application Note,  720006337EN). Here we will evaluate system dispersion on the ACQUITY Arc Bio, Alliance, and ACQUITY UPLC H-Class Bio systems and its impact on the separation of trastuzumab aggregates and fragments.

Experimental

Trastuzumab SEC analysis

LC system and detector

  • ACQUITY UPLC H-Class Bio System equipped with an ACQUITY UPLC TUV and CM-A 30 cm Column Heater
  • ACQUITY Arc Bio System equipped with a 2489 UV/Vis Detector and CM-A 30 cm Column Heater
  • Alliance System and a 2489 UV/Vis Detector

Detection:

280 nm @ 2 Hz

Column temp.:

Room temperature for trastuzumab 30 °C for standard

Samples:

2 mg/ml trastuzumab BEH200 SEC protein standard mix

Sample temp.:

4 °C

Injection volume:

15 μL for trastuzumab on the XBridge Column

5 μL for trastuzumab on the ACQUITY Column

2 μL for the standard on both columns

Flow rate:

0.3 mL/min for BEH200 SEC Protein Standard Mix on the ACQUITY Column

0.86 mL/min for BEH200 SEC Protein Standard Mix on the XBridge Column

0.4 mL/min for trastuzumab on the ACQUITY Column

1 mL/min for trastuzumab on the XBridge Column

Mobile phase

For trastuzumab on both columns:

25 mM NaH₂PO₄ and 400 mM NaCl @ pH 7.2

BEH200 standard:

100 mM NaH₂PO₄ @ pH 6.8

Seal wash:

10% methanol

Sample manager wash and purge:

Milli-Q Water

System dispersion analysis

LC system and detector

  • ACQUITY UPLC H-Class Bio System with an ACQUITY UPLC TUV Detector
  • ACQUITY Arc Bio System with a 2489 UV/Vis Detector
  • Alliance System and a 2489 UV/Vis Detector

Detection:

273 nm @ 40 Hz

Column temp.:

Ambient

Sample:

Caffeine

Sample temp.:

4 °C

Injection volume:

1 μL

Flow rate:

0.3 mL/min

Mobile phase:

30/70 water/acetonitrile

All wash lines:

Milli-Q water

Columns

  • ACQUITY UPLC Protein BEH SEC 200 Å, 1.7 μm (p/n 186005226)
  • XBridge Protein BEH SEC 200 Å, 3.5 μm (p/n 186007640)
  • 0.005" x 1.75" UPLC SEC connection tubing (p/n 186006613)

Data management

Empower 3 Software

Sample preparation

Trastuzumab (Herceptin) was analyzed past expiry and diluted from 21 mg/mL to 2 mg/mL in water

Caffeine standard was prepared to 0.16 mg/mL in 90:10 water:acetonitrile

Results and Discussion

Extra column (system) dispersion was measured on the ACQUITY UPLC H-Class Bio, ACQUITY Arc Bio, and Alliance systems using a caffeine standard. For these analyses a 30 cm column heater was used and a zero dead volume union was used in place of a column. The extra column dispersion at 5σ for each system is given in Figure 1. The impact of system dispersion observed in these tests is dependent upon the design of the autosampler, quality of the tubing connections, internal diameter of the tubing, and the detector flow cell volumes. In addition to these measures, SEC of proteins relies on the biocompatibility (inertness) of the system to reduce as much as possible the protein-surface interactions between analytes and the chromatographic system.2 Regardless of its origins, increasing system dispersion results in wider peaks and lower separation efficiencies. 

Dispersion (5σ) on the ACQUITY UPLC H-Class Bio (panel A), ACQUITY Arc Bio (panel B), and Alliance (panel C) chromatography systems measured in µL.
Figure 1. Dispersion (5σ) on the ACQUITY UPLC H-Class Bio (panel A), ACQUITY Arc Bio (panel B), and Alliance (panel C) chromatography systems measured in µL by multiplying the flow rate (0.3 mL/min) by the peak width at 4.4% peak height (dashed red line). The sample used was 0.16 mg/L caffeine injected at 1 µL with detection performed at a sampling rate of 40 points/second at 273 nm. The ACQUITY Arc Bio and Alliance systems used UV/Vis Detectors models VTU and 87E, respectively. The ACQUITY UPLC H-Class Bio  used a TUV Detector model UPT. A zero volume union was used in place of a column. Mobile phase was 30:70 water:acetonitrile. N=10 for all systems.

To determine the quality of separation provided by each chromatographic system a protein standard mix was used. BEH200 SEC Protein Standard Mix (p/n 186006518) was separated on an ACQUITY UPLC Protein BEH SEC 200 Å 1.7 µm Column (p/n 186005226) and a XBridge Protein BEH SEC 200 Å 3.5 µm Column (p/n 186007640) (Figure 2). 

BEH200 standard run on the ACQUITY BEH200 Column on the ACQUITY UPLC H-Class Bio (panel A) and the ACQUITY Arc Bio (panel B).
Figure 2. BEH200 standard run on the ACQUITY BEH200 Column on the ACQUITY UPLC H-Class Bio (panel A) and the ACQUITY Arc Bio (panel B) using the recommended conditions in the care and use manual. BEH200 standard run on an XBridge BEH200 Column on the ACQUITY Arc Bio (panel C) and the Alliance (panel D) using the recommended conditions in the care and use manual. Injections were made at 2 µL for both columns on all 3 systems. Components of the standard correspond to the numbered peaks in panel A and are in order from left to right as follows: 3 mg/mL thyroglobulin, 2 mg/mL IgG, 5 mg/mL BSA, 2 mg/mL myoglobin, and 0.1 mg/mL uracil. The ACQUITY BEH200 Column used a flow rate of 0.3 mL/min, while the XBridge BEH200 Column used a flow rate of 0.86 mL/min. Resolution between the BSA and IgG peaks and plate count calculated using the uracil peak were used for comparison between systems and are an average over all runs. N = 10 for the ACQUITY Column for both systems and 5 for the XBridge Column for both systems.

Both columns were 30 cm in length, however the ACQUITY column has an internal diameter (I.D.) of 4.6 mm while the XBridge Column has an I.D. of 7.8 mm. As such, the ACQUITY Column was used for comparison of the ACQUITY UPLC H-Class Bio and ACQUITY Arc Bio systems while the XBridge Column was used for comparison of the ACQUITY Arc Bio and Alliance systems. Separation quality was monitored using two parameters; plate count determined using the uracil peak (an analyte small enough to experience the full volume of the 200 Å particle pores) is a measure of column efficiency and takes into account peak dispersion, while resolution measured between the BSA and IgG peaks of the standard provides a measure of the separation between the two peaks taking into account their width and distance traveled through the column.3 The results in Figure 2 agree with the results shown in Figure 1. System dispersion decreases when moving from the Alliance to the ACQUITY Arc Bio, and again when moving from the ACQUITY Arc Bio to the ACQUITY UPLC H-Class Bio. Since system dispersion is inversely proportional to separation quality, we see an increase in plate count and resolution in the same direction.

The observations made using the protein standard can also be applied to the separation quality between a mAb (in this case trastuzumab) and the HMW aggregation or LMW fragments found in the formulated drug product. Figure 3 shows the SEC separations of trastuzumab on the same ACQUITY and XBridge BEH200 columns and also includes data showing two 30 cm XBridge Columns in series. As with the BEH Standards, the ACQUITY UPLC H-Class Bio provides higher resolution (measured between the monomer peak and the second HMW aggregate peak) and is able to resolve the first LMW fragment from the monomer peak well enough to give a higher peak/valley ratio than the ACQUITY Arc Bio on the ACQUITY Column. The same observation of increased resolution can also be applied to the ACQUITY Arc Bio System compared to the Alliance system when using a single 30 cm XBridge Column. However, this column is unable to resolve the LMW fragment peak from the monomer on either system, resulting in the inability to quantify this impurity. It should be noted, however, that the quality of separation is very similar system to system when using the same column (i.e. the ACQUITY Column on the ACQUITY UPLC H-Class Bio and ACQUITY Arc Bio systems) which is a testament to the robustness of the columns and systems used. Additionally, a separation using two 30 cm XBridge Columns in series on the ACQUITY Arc Bio System was performed. Sample injection volume was scaled linearly to match column volume. Panel E of Figure 3 shows the results of this test. It is immediately apparent that the LMW fragmentation separation from the monomer peak is far better than that achieved even with the ACQUITY Column on the ACQUITY UPLC H-Class Bio System. This, however, more than doubling this separation time the separation time which will limit sample throughput. The injection volume is also much larger than on the ACQUITY Column (>4X). Ultimately, a comparable separation of mAb, aggregates, and fragments was achieved using the two XBridge Columns in tandem, but if this method is to be employed the larger sample load, decreased sample throughput, and higher mobile phase consumption must be considered.

2 mg/mL trastuzumab (Herceptin) run on the ACQUITY BEH200 Column on the ACQUITY UPLC H-Class Bio (panel A) and the ACQUITY Arc Bio (panel B), on a single XBridge BEH200 Column on the ACQUITY Arc Bio (panel C) and the Alliance (panel D), and on 2 XBridge BEH200 Columns in sequence on the ACQUITY Arc Bio (panel E).
Figure 3. 2 mg/mL trastuzumab (Herceptin) run on the ACQUITY BEH200 Column on the ACQUITY UPLC H-Class Bio (panel A) and the ACQUITY Arc Bio (panel B), on a single XBridge BEH200 Column on the ACQUITY Arc Bio (panel C) and the Alliance (panel D), and on 2 XBridge BEH200 Columns in sequence on the ACQUITY Arc Bio (panel E).  In all cases an isocratic method was used  with mobile phase consisting of 25 mM phosphate and 400 mM NaCl at pH 7.2. Injections were made at 5 µL for the ACQUITY Column, 15 µL for the single XBridge Column, and 21.2 µL for the 2 XBridge Columns in sequence. Separation components correspond to the numbered peaks in panel A and are in order from left to right as follows: HMW aggregate (1), HMW aggregate (2), monomer, LMW fragment (1), and LMW fragment (2). The ACQUITY BEH200 Column used a flow rate of 0.4 mL/min while the XBridge BEH200 Column(s) used a flow rate of 1 mL/min. Resolution between the monomer and HMW aggregate (2) peak and starting peak  to valley ratio between LMW fragment (1) and the monomer were used for comparison between systems. N-count = 3 for all tests.

Quantification of the HMW aggregate and LMW fragment levels observed using each system configuration demonstrates where increased system dispersion can potentially lead to issues with product monitoring. When quantifying the level of trastuzumab HMW aggregation both columns and all 3 systems performed comparably (Table I). The HMW aggregate peaks were fully resolved from the monomer peak in all cases. Quantifying the LMW fragmentation peak on the back end of the monomer peak is where extra column dispersion is of greater importance. The single XBridge Column on both the ACQUITY Arc Bio and Alliance systems did not resolve the LMW fragment peak from the monomer peak sufficiently for quantification. Coupling two XBridge Columns, however, provides enough resolving power to achieve a starting peak to valley ratio of the LMW fragment peak higher than that of the single ACQUITY Column. This is important for accurate quantification of the LMW fragment, as can be seen by the relative area counts for this peak (Table 1). With the ACQUITY column on the ACQUITY Arc Bio and ACQUITY UPLC H-Class Bio systems the monomer peak tails into the LMW peak and increases the relative area count when compared to the better resolved peak on the two XBridge Columns. Additionally, the increased system dispersion of the ACQUITY Arc Bio results in more of the monomer peak tailing into the LMW fragment peak which further increases the observed relative area compared to the ACQUITY UPLC H-Class Bio result on the ACQUITY Column. Again, the improvement in separation quality observed on the tandem XBridge Columns comes at a cost of approximately doubling the analysis time, increasing sample use, and increasing mobile phase consumption.

Relative (%) areas of the HMW aggregate (2) and LMW fragment (1) peaks.
Table 1. Relative (%) areas of the HMW aggregate (2) and LMW fragment (1) peaks. Data presented here are an average of triplicate injections for each condition. N/Q indicates that the peak was not resolved from the monomer enough to quantify an area count.

Conclusion

Extra column dispersion is an important factor to consider when choosing a system to perform SEC. Here we have demonstrated that the higher system dispersion of the Alliance over the ACQUITY Arc Bio for the 30 cm XBridge Column and the ACQUITY Arc Bio over the ACQUITY UPLC H-Class Bio for the 30 cm ACQUITY Column can cause difficulties in product quality monitoring. All systems and columns were able to accurately monitor the level of HMW aggregation as this peak was well resolved from the monomer peak in all cases. The LMW fragmentation peak of trastuzumab was not well resolved using single XBridge Columns, but the increased resolving power of the ACQUITY Column was able to separate this peak. Increased system dispersion on the ACQUITY Arc Bio resulted in higher measurements of LMW fragmentation due to increased tailing of the monomer peak into the LMW fragment peak when compared to the ACQUITY UPLC H-Class Bio. We have also demonstrated that analysis time and sample throughput requirements need to be carefully considered when choosing a SEC separation method for mAbs. Multiple HPLC columns in tandem on the ACQUITY Arc Bio System can achieve separations comparable to a ACQUITY Column on the ACQUITY UPLC H-Class Bio in terms of resolution, while dramatically improving the separation of the LMW fragment peak from the monomer peak. This comes at a cost of significantly longer run times, increased sample requirement, and increased mobile phase consumption.

References

  1. Hong, P.; Koza, S.; Bouvier, E. S. A review size-exclusion chromatography for the analysis of protein biotherapeutics and their aggregates. Journal of Liquid Chromatography and Related Technologies 2012, 35 (20), 2923–2950.
  2. Bouvier, E. S.; Koza, S. M. Advances in size-exclusion separations of proteins and polymers by UHPLC. TrAC Trends in Analytical Chemistry 2014, 63, 85–94.
  3. Neue, U. D. HPLC columns. Theory, Technology, and Practice 1997.

720006408, October 2018

맨 위로 돌아가기 맨 위로 돌아가기