• 응용 자료

Techniques for Improving the Efficiency of Large Volume Loading in Preparative Liquid Chromatography

Techniques for Improving the Efficiency of Large Volume Loading in Preparative Liquid Chromatography

  • Jo-Ann M. Jablonski
  • Andrew J. Aubin
  • Wendy Harrop
  • Waters Corporation

Abstract

In this study, we illustrate and compare different techniques for improving the efficiency of loading large volumes of dilute sample in weak solvent for compound isolation. The impact of each technique on the overall purification efficiency is discussed.

Benefits

  • Large volume sample loading reduces the number of runs, time, and solvent required for the isolation of compounds from weak diluents, thereby improving the efficiency of the purification process.
  • Large volumes of sample with low concentration in weak solvent can be isolated more quickly by increasing
    loading with simple HPLC method and plumbing changes.
  • Mass-directed purification clearly identifies the product of interest and makes isolation easy.

Introduction

Preparative scale liquid chromatography can be challenging to the purification scientist in many ways, but effective sample loading directly influences the success of compound isolation. While the objectives of prep chromatography include achieving high mass load on the column and employing rugged generic chromatography, two conflicting principles almost always play a role in the approach used to realize these objectives. First, strong solvents dissolve samples but distort chromatographic peaks due to the inability of the sample to properly interact with the column packing. Second, weak solvents as sample diluents give good chromatography but do not dissolve samples at high concentration. Low sample concentration ultimately results in large injection volumes which are difficult to handle and generally result in poor chromatography. Although these challenges are well-known among chromatographers, with easy modifications to the HPLC system plumbing and with mass detection, these issues can be addressed satisfactorily using at-column dilution.1 In this study, we illustrate and compare different techniques for improving the efficiency of loading large volumes of dilute sample in weak solvent for compound isolation. The impact of each technique on the overall purification efficiency is discussed.

Experimental

Conditions

Analytical column and flow rate:

XBridge BEH Shield RP18, 4.6 x 50 mm, 5 μm; 1.46 mL/min

Prep column and flow rate:

XBridge BEH Shield RP18 OBD Prep, 19 x 50 mm, 5 μm; 25 mL/min

Mobile phase A:

0.1% formic acid in water

Mobile phase B:

0.1% formic acid in acetonitrile

Makeup solvent:

50:50 water:acetonitrile, 0.01% formic acid

Cone voltage:

15 V

Probe temp.:

500 °C

Ionization mode:

ES+, continuum

Sampling frequency:

5 Hz

Scan range:

100–650 amu

Wavelength:

274 nm

Gradients and injection volumes:

as noted in figures

Sample:

10 bags Lipton Green Tea extracted with 1L hot water for 10 minutes and filtered

Instrumentation

Waters AutoPurification System: 2545 Binary Gradient Module, 2767 Sample Manager, System Fluidics Organizer, 8–30 mL Flow Splitter, two 515 HPLC pumps, 2998 Photodiode Array Detector, ACQUITY QDa Detector

Results and Discussion

Epigallocatechin gallate (EGCG) and epicatechin gallate (ECG), two of the many catechins found in green tea, were chosen as the compounds of interest for illustrating the concepts in these experiments. A loading study was performed to determine the amount of crude green tea extract that could be loaded on the analytical column, yet still give good resolution for the EGCG and ECG. The 200 μL maximum volume showed good resolution at 274 nm, but with mass detection, the two peaks of interest were clearly identified (Figure 1) even when running a fast screening gradient.

Figure 1. 200 μL crude green tea extract injected on the 4.6 x 50 mm column.
Gradient: 5–50% B in 5 min.
Peak 1 = Epigallocatechin gallate, M + H 459.1;
Peak 2 = Epicatechin gallate, M + H 443.2

Geometric scaling from 200 μL on the analytical column to 3412 μL on the 19 x 50 mm preparative column gave acceptable chromatography with easy mass-directed fraction collection, as did doubling the injection volume to 6824 μL (Figure 2). Fraction analysis (not shown) at 274 nm for EGCG and ECG, however, indicated purities of approximately 94% for both EGCG preps, and 40% for the 3.4 mL and 72% for the 6.8 mL ECG preps.

Figure 2. 3.4 and 6.8 mL injections of crude green tea extract on the 19 x 50 mm column.
Mass chromatograms are SIR channels. Gradient: 5–50% B in 5 min.

Focusing the gradient2 and isolating the two catechins from a 6824 μL injection of the crude extract improved the fraction purities of both the main product (EGCG) and the impurity (ECG) to 100% and 80%, respectively (Figure 3).

Figure 3. 6.8 mL injection of crude green tea extract on the 19 x 50 mm column. Mass chromatograms are SIR channels. Prep gradient: 10–30% B in 11 min. Analysis gradient: 5–50% B in 5 min, 20 μL.

Large volumes of sample in weak solvent necessitate loading as much sample as possible to improve purification efficiency while maintaining enough resolution to successfully isolate the compounds of interest. Since the purity of the desired product was excellent with a 6.8 mL injection, and the resolution between the EGCG and its closely-eluting neighbors was also acceptable, a 21 mL injection was performed. Despite the three-fold increase in sample size, the fraction analysis showed comparable purity to the 6.8 mL injection (Figure 4).

Figure 4. 21 mL injection of crude green tea extract on the 19 x 50 mm column using a 30 mL loop. Mass chromatograms are SIR channels. Prep gradient: 10–30% B in 11 min.
Analysis gradient: 5–50% B in 5 min, 20 μL.

Loading large sample volumes onto the prep column would be more efficient if a pump was used. With a successful 21 mL prep already performed using a syringe for sample introduction, the same volume was loaded in a second prep using a pump to load the sample. The plumbing configuration was analogous to the setup used for at-column dilution, a technique described in detail in previous communications. The sample extract was pumped to one side of a tee at 7 mL/min where it was mixed with the system mobile phase at 100% A (water, 0.1% formic acid) flowing at 18 mL/min (total flow rate 25 mL/min) and subsequently deposited onto the head of the column (Figure 5). After the sample loading line was chased with water, the gradient was started. The chromatography for the sample loaded with the pump was identical to the chromatography for the sample injected by syringe (Figure 6). Fraction analysis results were also the same.

Figure 5. Diagram for using a loading pump to introduce large sample volumes onto a column for compound isolation
Figure 6. Comparison of two 21 mL prep isolations with different modes of sample loading.

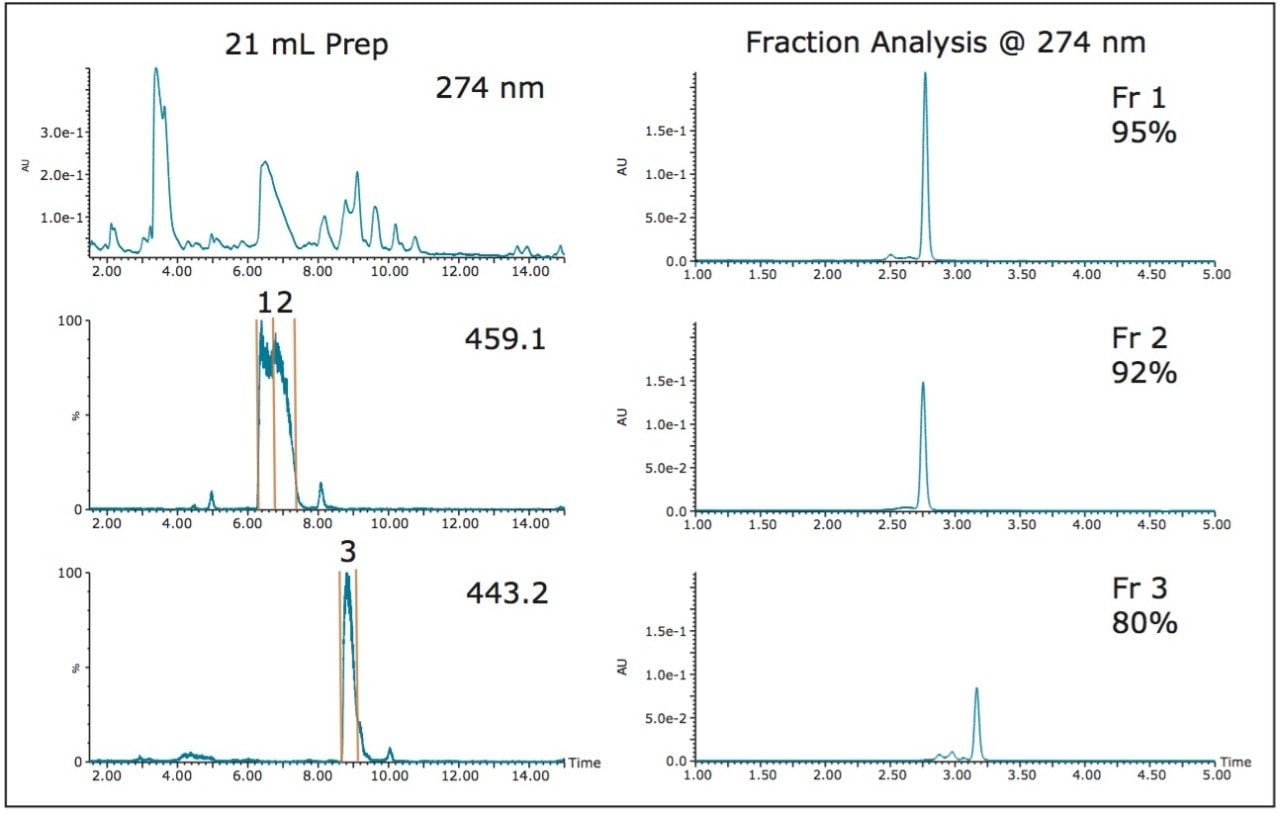
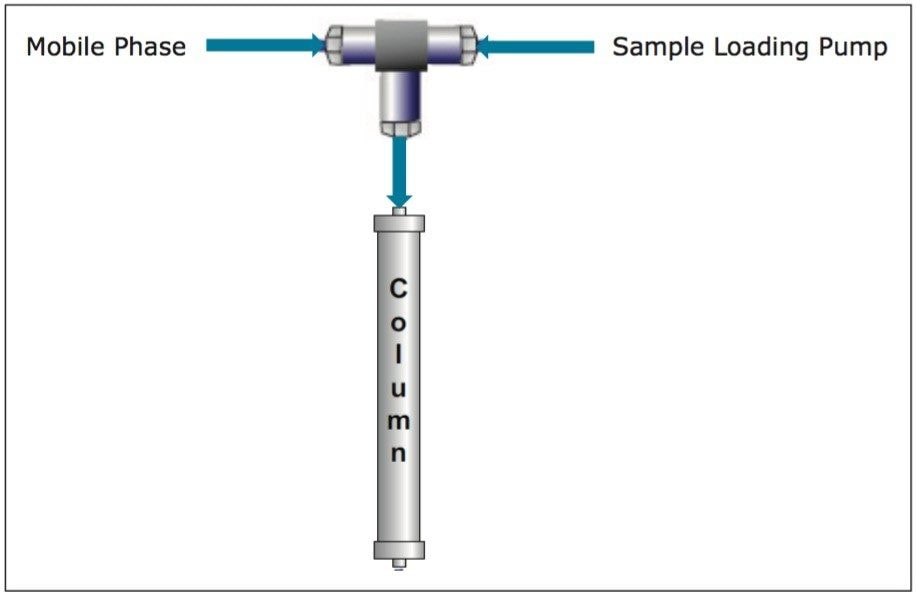
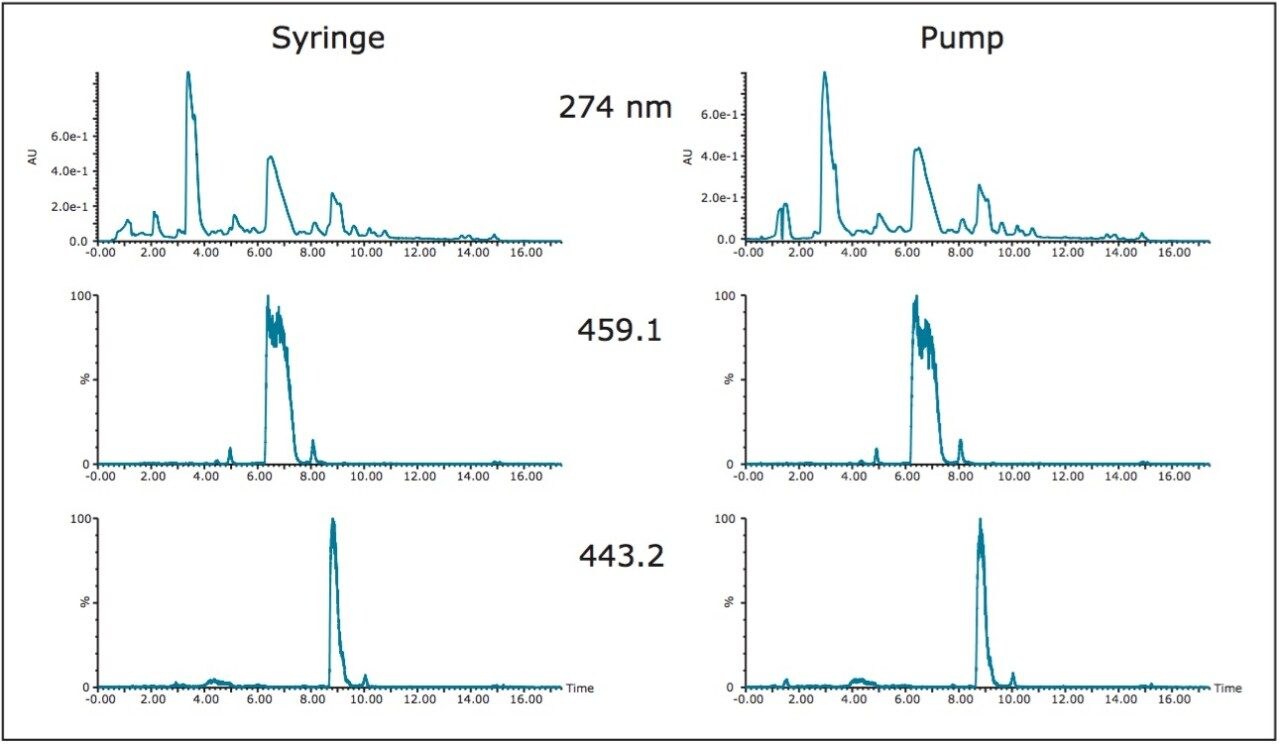
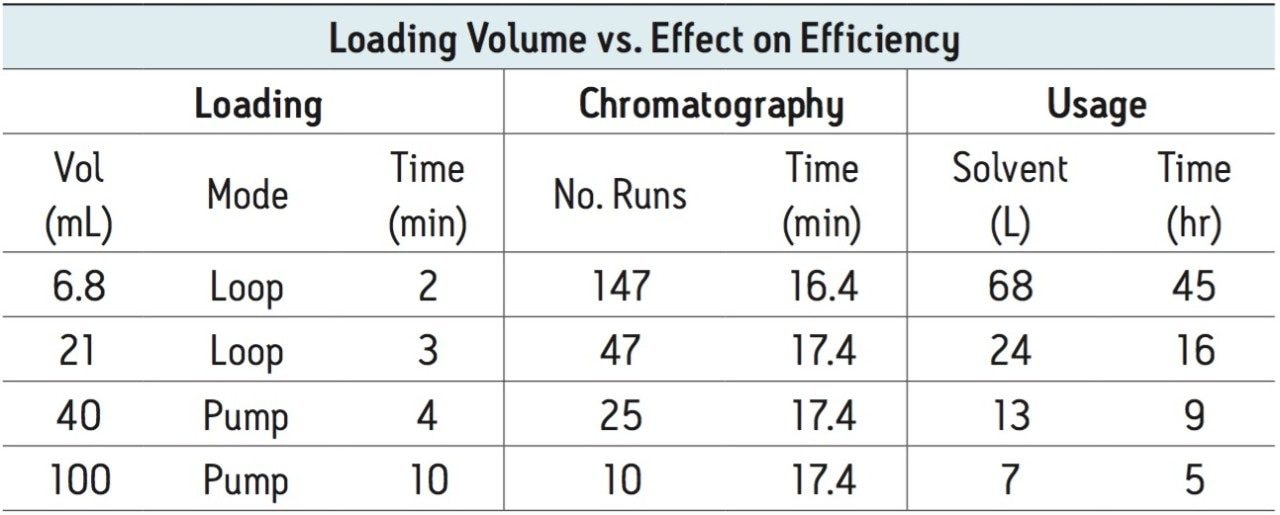
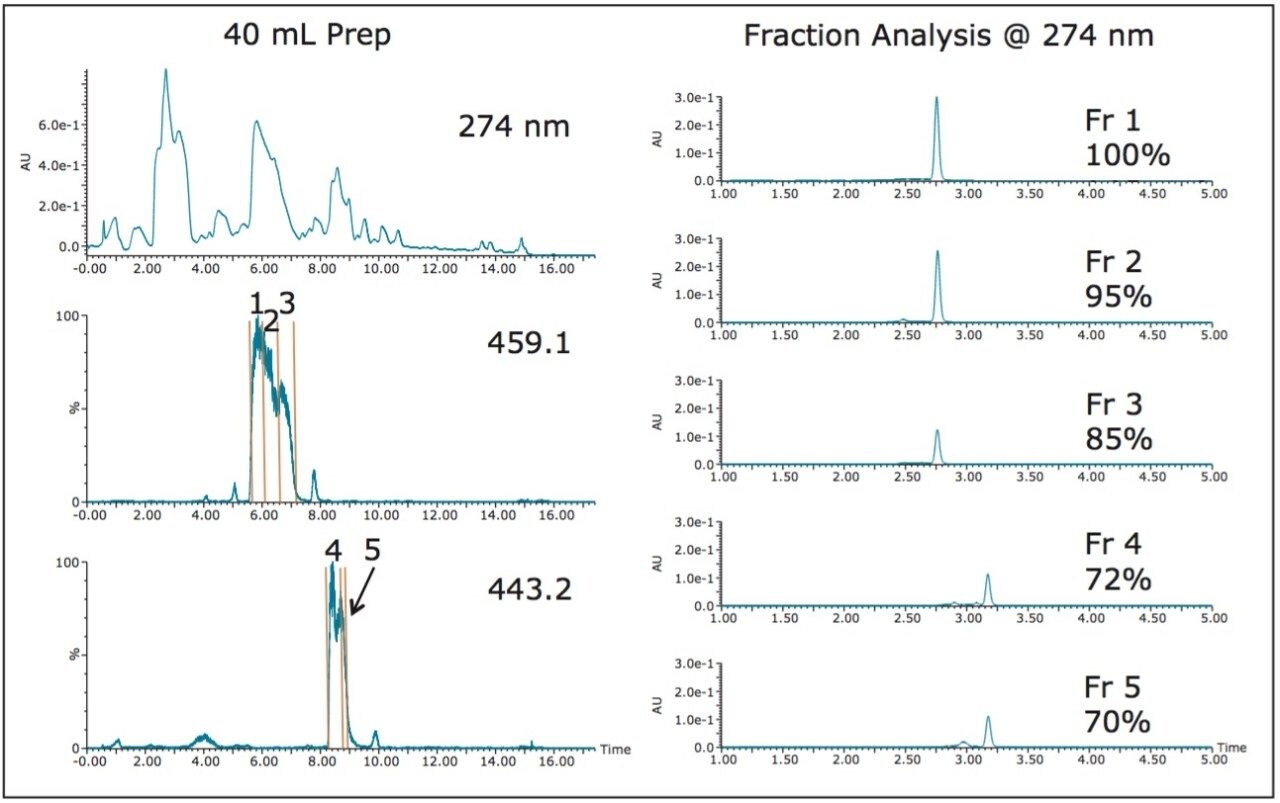
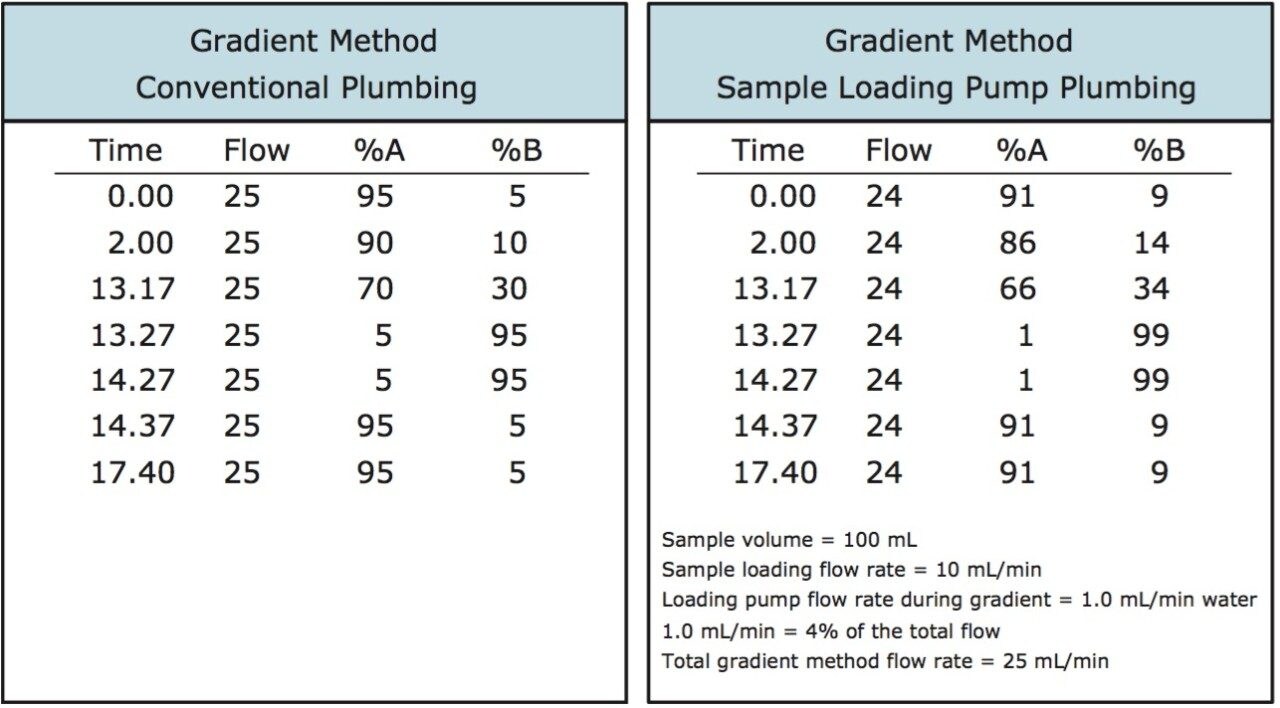
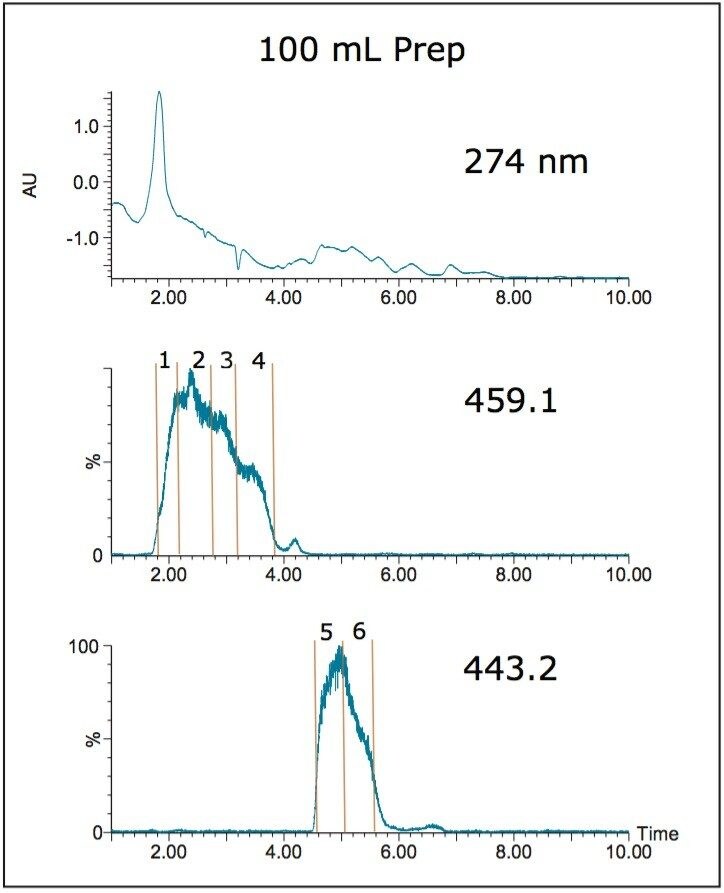
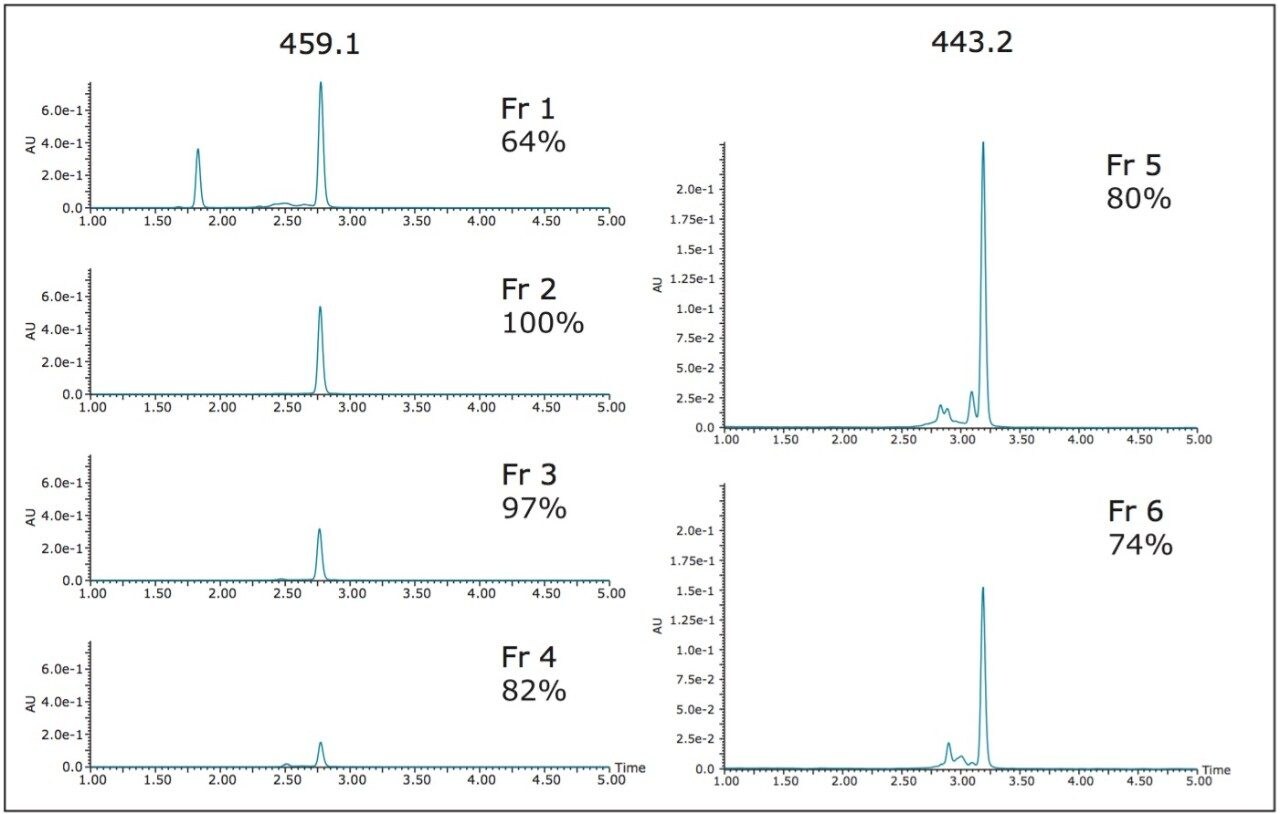
With a 21 mL sample loading successfully performed, and with 1 liter of extract to process, loading even larger sample volumes would clearly increase the efficiency of the product and impurity isolation. Table 1 shows the benefit of increasing sample loading volumes with the reduction in the number of chromatographic runs, decreased solvent usage and time savings. Consequently, the loading pump was used to introduce 40 and 100 mL sample extract volumes onto the 19 x 50 mm column for isolation (Figures 7, 9). These sample extracts were pumped onto the column at 10 mL/min, mixing with the chromatographic pump flow at 15 mL/min, for a total flow rate of 25 mL/min. The total flow rate was maintained at the flow rate used to time the system for fraction collection, ensuring consistent collection performance. The 100 mL isolation showed an earlier target compound elution time due to the extremely high sample load and a modification of the gradient method. Despite the large volume which was loaded, mass-directed purification unambiguously identified the peaks of interest. While the 21 and 40 mL samples were loaded with a pump and the lines chased with water, the plumbing after sample loading was returned to the typical conventional configuration without the tee for sample addition. To make the process less cumbersome, for the 100 mL extract isolation, the sample loading pump plumbing was preserved throughout the gradient method. Once the aqueous green tea extract was loaded, water was added to the sample loading vessel and introduced as part of the weak solvent composition throughout the gradient.

Table 1. Loading volume’s effect on the calculated processing efficiency of 1 liter of crude extract.
Figure 7. 40 mL green tea extract on the 19 x 50 mm column. Mass chromatograms are SIR channels. Prep gradient: 10–30% B in 11 min. Analysis gradient: 5–50% B in 5 min, 20 μL.

The gradient method was modified to account for the aqueous contribution from the loading pump (Figure 8).

Figure 8. Gradient method comparison for conventional plumbing and sample loading pump plumbing configurations. The sample loading pump gradient method was modified to account for the loading pump’s contribution to the total flow rate and solvent composition.
Figure 9. 100 mL green tea extract on the 19 x 50 mm column. Mass chromatograms are SIR channels. Prep gradient: 10–30% B in 11 min, sample loading pump plumbing configuration.

Fraction analysis results for the 100 mL isolation were comparable to the purities obtained from the 21 mL and 40 mL sample loading experiments with two very pure EGCG (459.1) fractions and similar purities for ECG (443.2) (Figure 10).

Figure 10. Fraction analysis from the 100 mL isolation. Analysis gradient: 5–50% B in 5 min, 20 μL.

Conclusion

In this study, isolation of compounds of low concentration from large volumes of weak solvent was effectively accomplished with simple HPLC method and plumbing modifications. Focusing the gradient improved the quality of the target compound isolation by increasing the resolution between contaminant peaks and permitting increased loading on the column. Whether using a larger loop and syringe or adding a tee and a loading pump to the HPLC configuration for sample introduction, the chromatography was remarkably consistent and isolated products had comparable purities.

Detection plays an important role in the success of product isolation. While large sample volumes very rapidly distort UV chromatograms and make product peak identification ambiguous, mass-directed purification clearly reveals where the target compound elutes and makes fraction collection easier. As the amount of sample volume increases, the efficiency of the overall compound isolation improves by reducing the solvent usage and time for completing the purification process

References

  1. Wheat T, et.al. At-Column Dilution. Waters Application Note 71500078010rA. 2003.
  2. Jablonski J, Wheat T, Diehl D. Developing Focused Gradients for Isolation and Purification. Waters Technical Note 720002955EN. September 2009

720005454, July 2015

맨 위로 돌아가기 맨 위로 돌아가기