• 응용 자료

The Analysis of Coccidiostatic Agents in Feed Using the ACQUITY UPLC I-Class and Xevo TQ-S

The Analysis of Coccidiostatic Agents in Feed Using the ACQUITY UPLC I-Class and Xevo TQ-S

  • Nathalie Gillard
  • Gilles Pierret
  • Philippe Delahaut
  • Marijn Van Hulle
  • Centre d’Economie Rurale
  • Waters Corporation

Abstract

This application note describes a fast, accurate, and robust UPLC/MS-MS method using the  ACQUITY UPLC I-Class System with Xevo TQ-S for the detection of 11 coccidiostatic agents in feed down to 0.25% carryover levels. The Xevo TQ-S is a highly sensitive tandem quadrupole instrument with fast positive/negative ion switching capabilities able to deal with challenging matrices.

Benefits

A fast, robust, accurate, and sensitive method for 11 coccidiostats in feed samples was developed on an ACQUITY UPLC I-Class System with Xevo TQ-S.

  • Compared to the original HPLC/MS-MS method the feed sample extracts can be further diluted by a factor of 50, using only half of the injection volume.
  • Runtime reduced from 16 min. (HPLC/MS-MS) to eight min. (UPLC/MS-MS).
  • RADAR provides the necessary qualitative information about possible matrix effects and is therefore a valuable tool during method development

Introduction

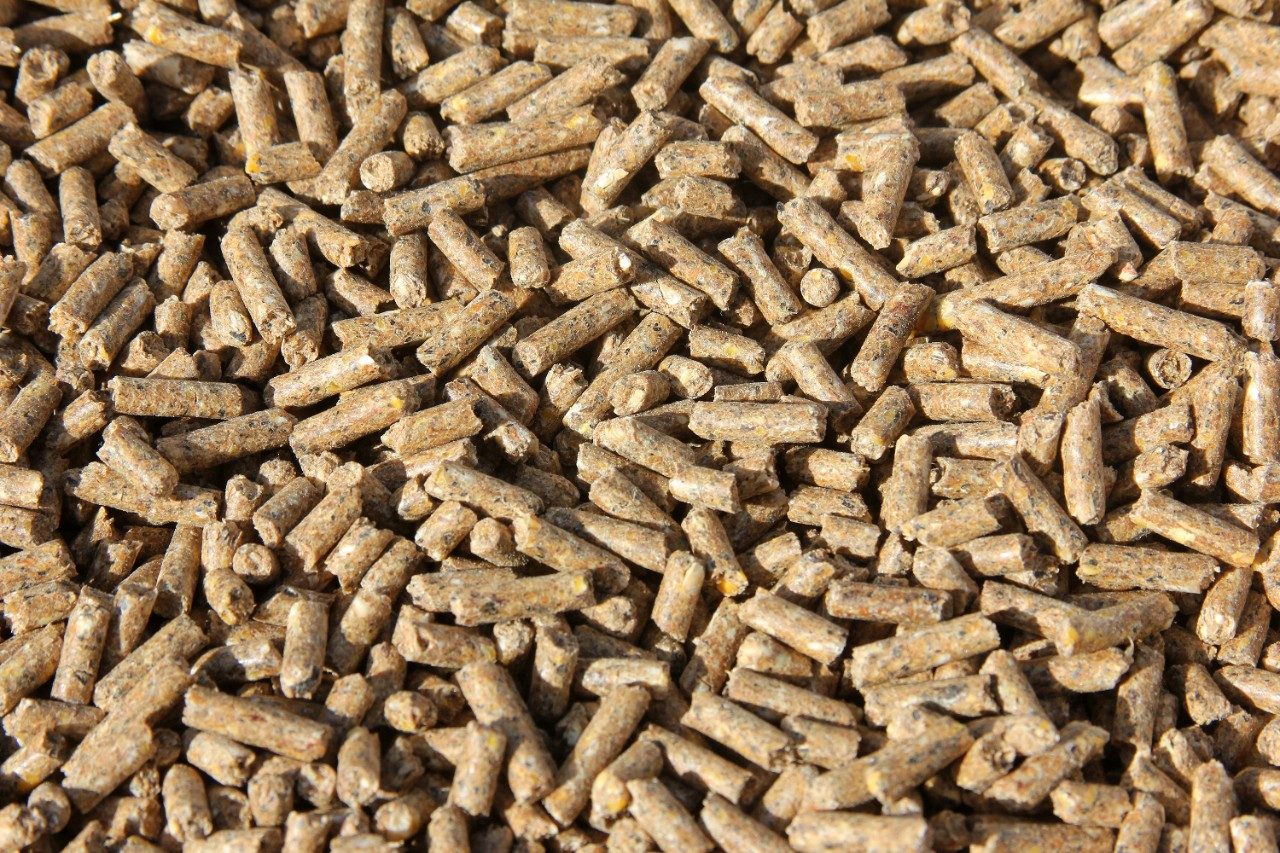
Coccidiosis is a parasitic disease of the intestinal tract of animals caused by coccidian protozoa. The disease spreads from one animal to another by contact with infected feces or ingestion of infected tissue. Diarrhea, which may become bloody in severe cases, is the primary symptom. Most animals infected with coccidia are asymptomatic; however, young or immuno-compromised animals may suffer severe symptoms, including death. Among domestic animals, industrially bred poultry and rabbits are particularly prone to this disease.

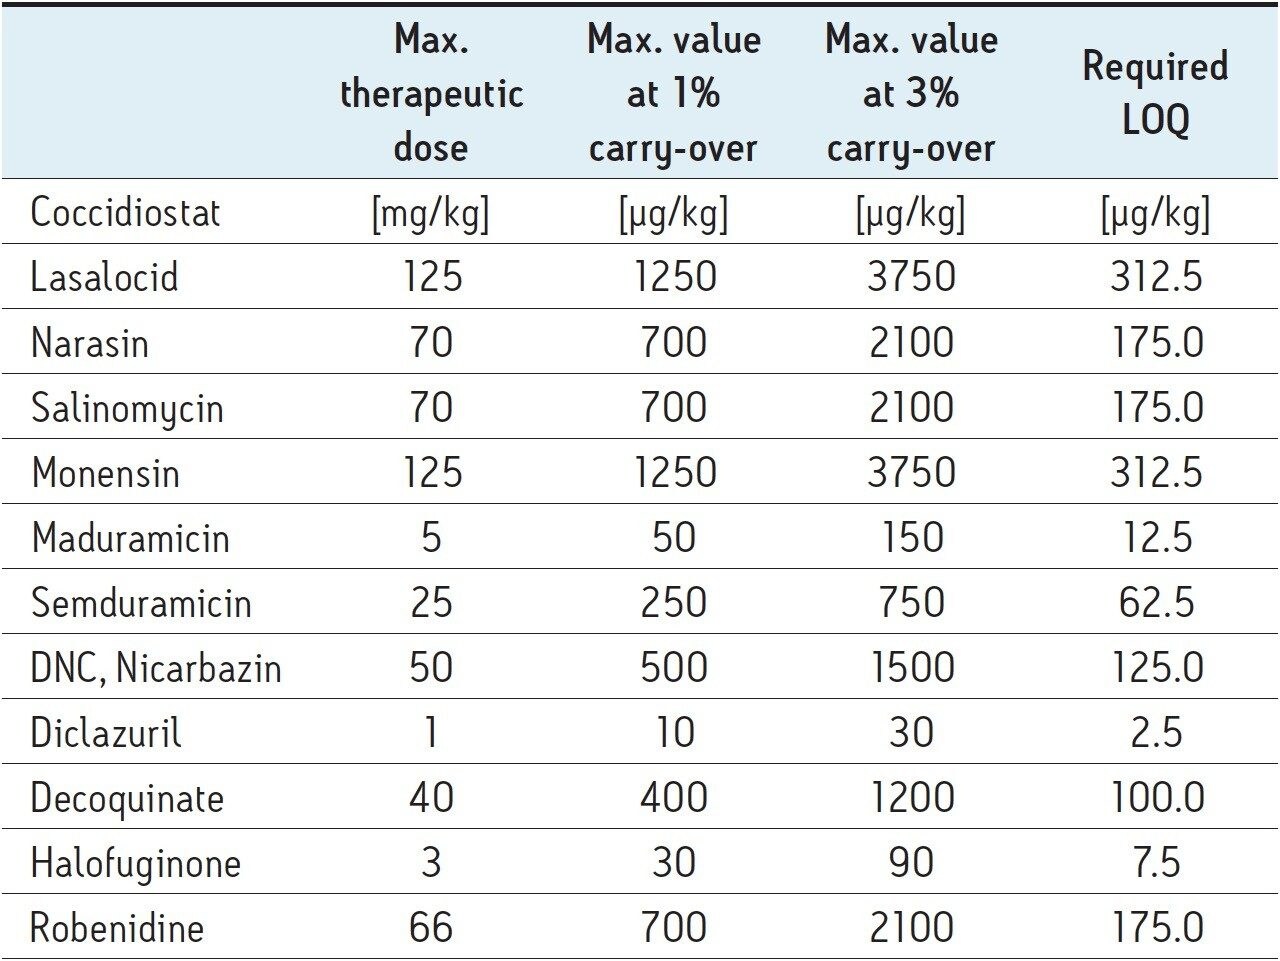
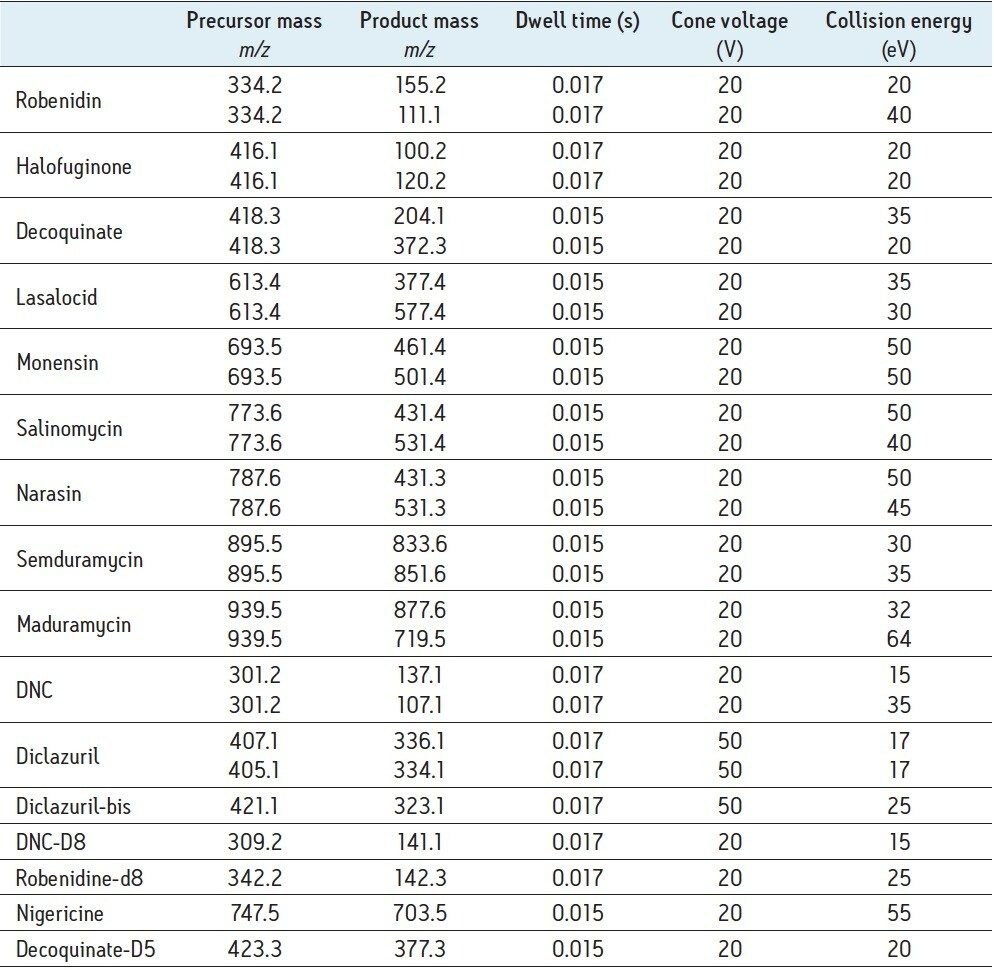
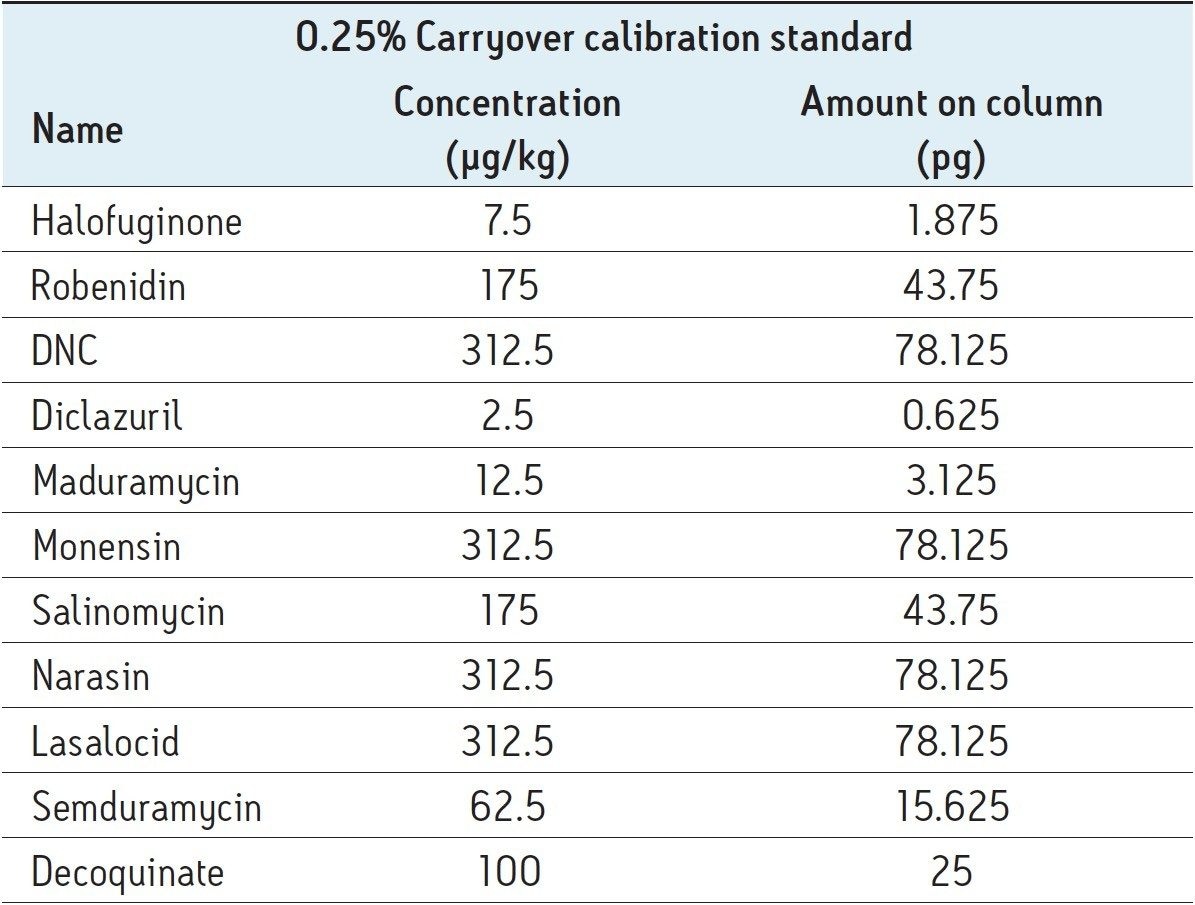
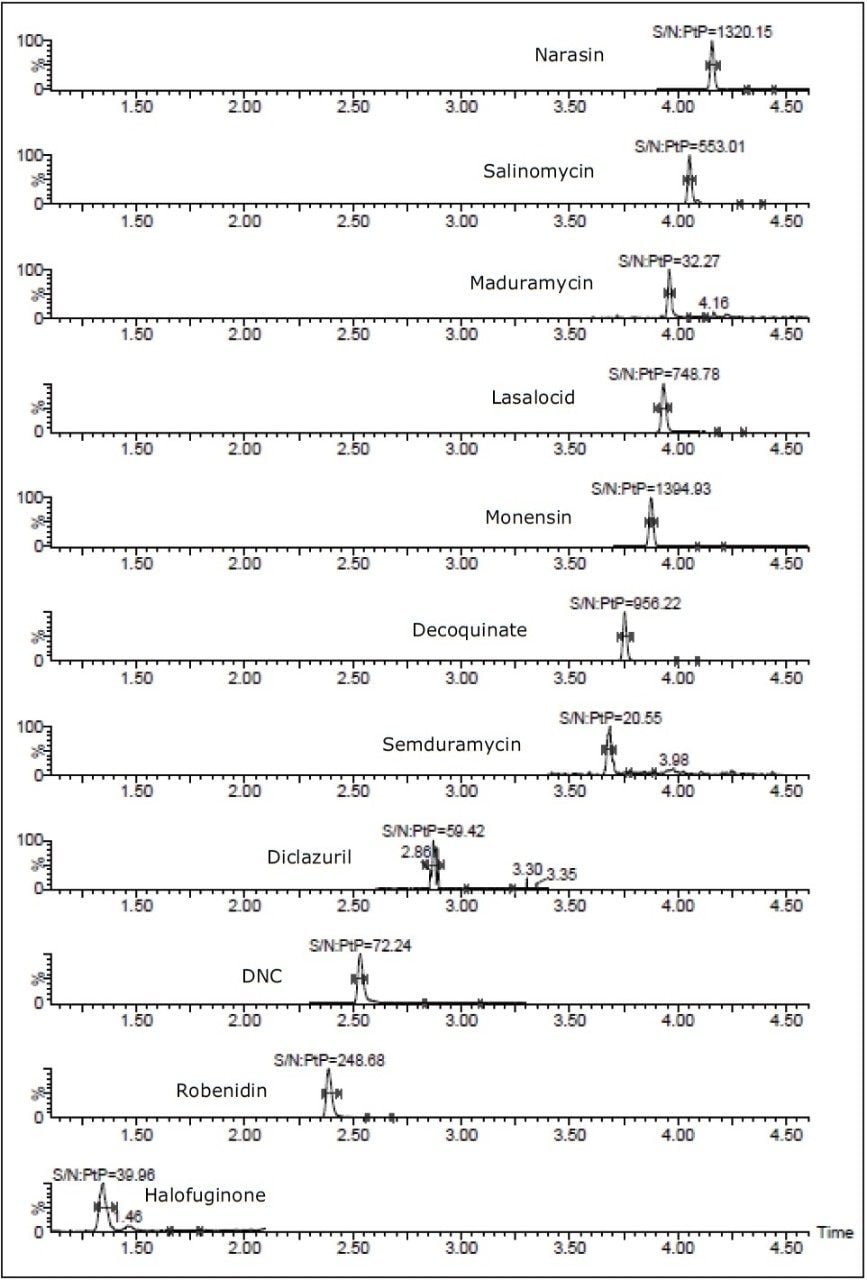
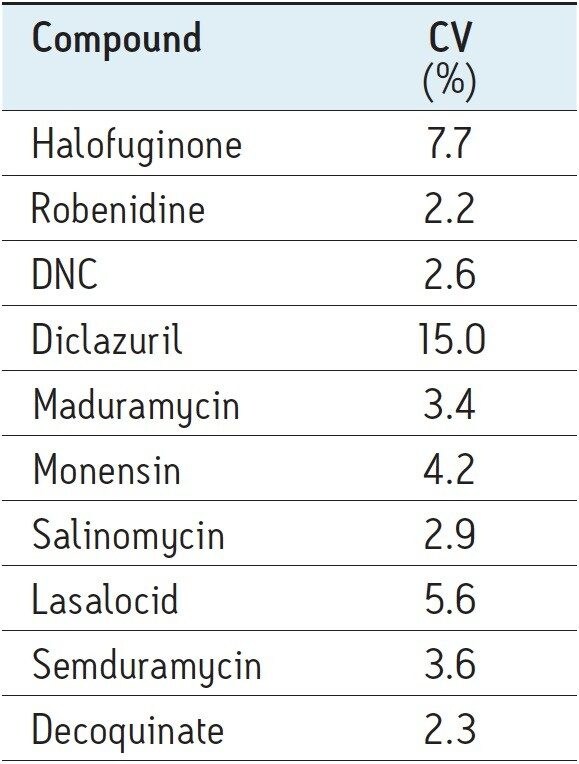
Today 11 coccidiostatic agents are authorized as feed additives in accordance with EU Regulation 2003/1831/EC. Other regulations specify which agents can be used for specific animal species. Because feed companies typically use the same production line for the production of different feeds, carryover and therefore transfer of coccidiostats from one batch to another is unavoidable. Despite the efforts taken by the feed companies to avoid any cross-contamination, as imposed by European directive 2005/183/EC, maximum levels of coccidiostat carryover have been set (2009/8/CE) to protect animal health and guarantee minimal risk to the consumers. This directive sets maximum carryover levels of 1% for sensitive animal species and 3% for less-sensitive non-target animal species, respectively. These required LOQ levels, described in Table 1, which are drug dependent, The are based on an extraction protocol described further. These levels are very diverse, making it difficult to combine all of the components into one multi-residue analysis and achieve good overall sensitivity, accuracy, and linear range.

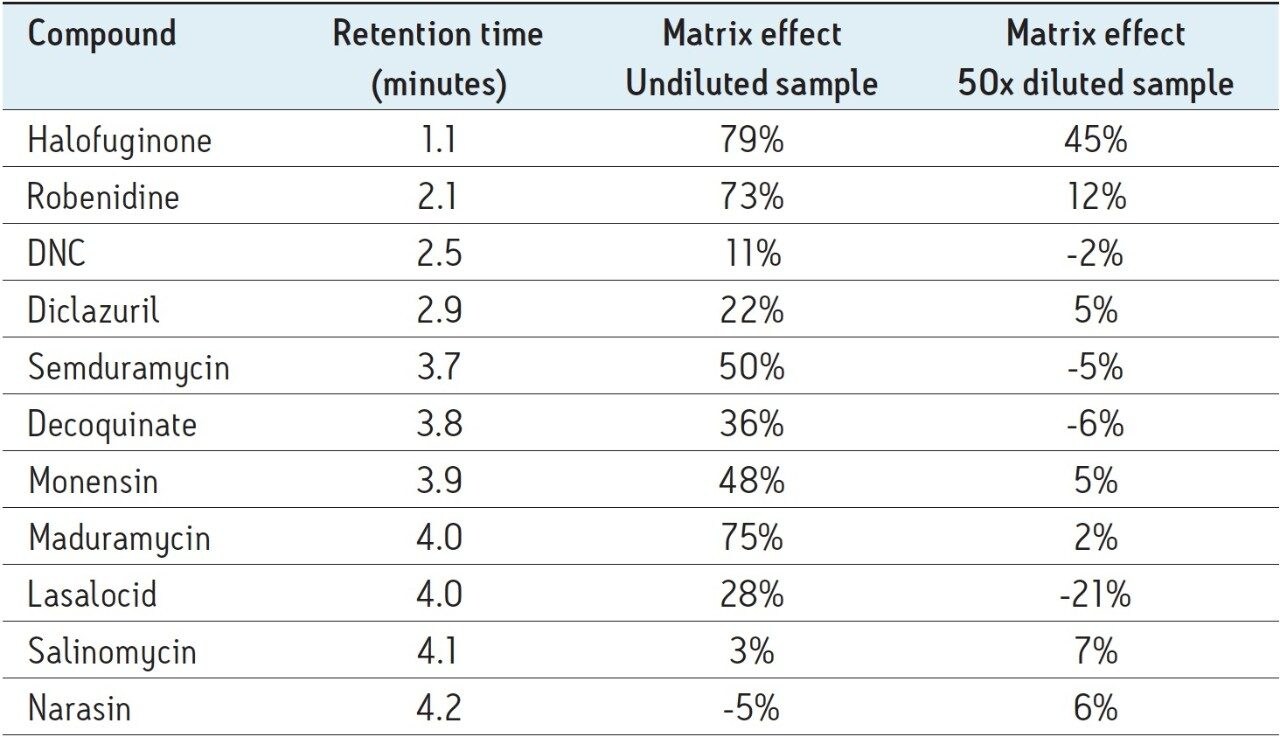
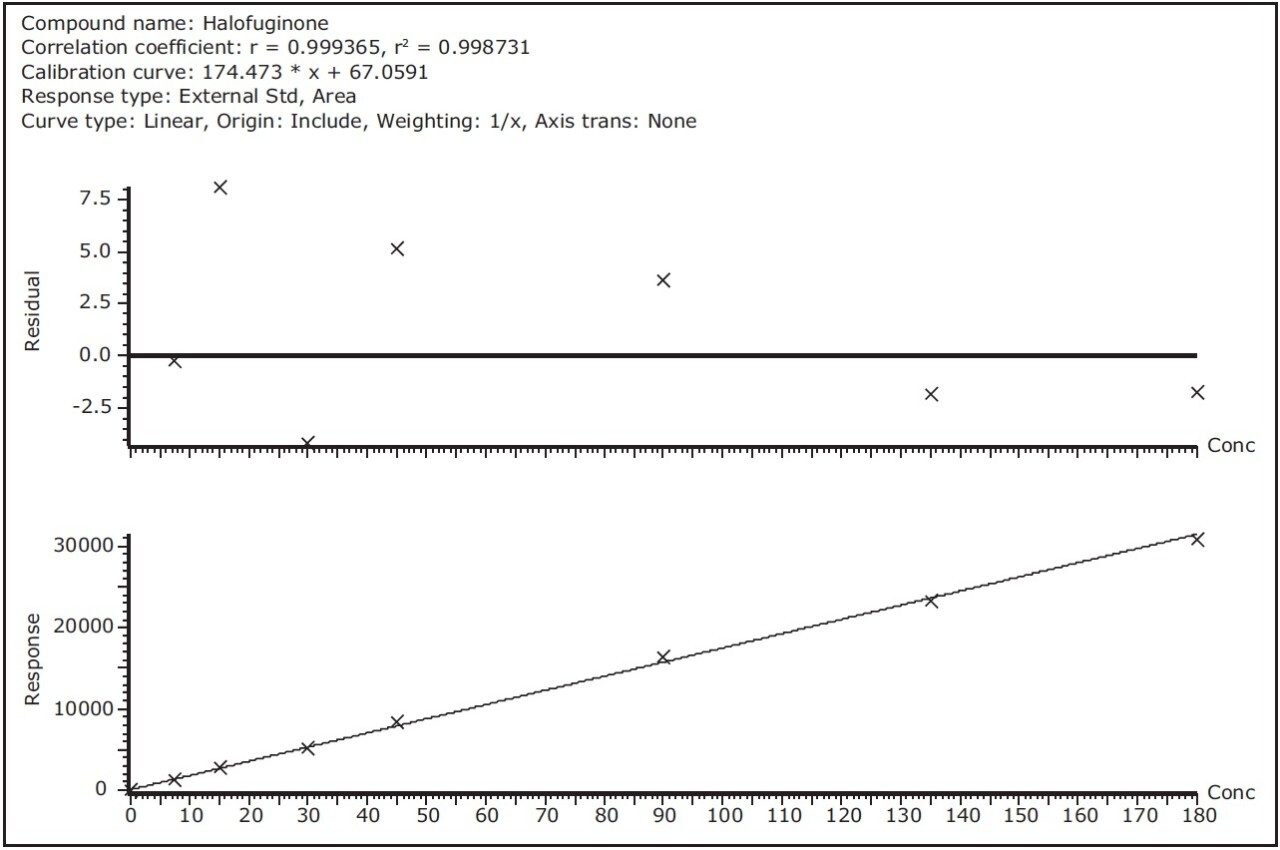
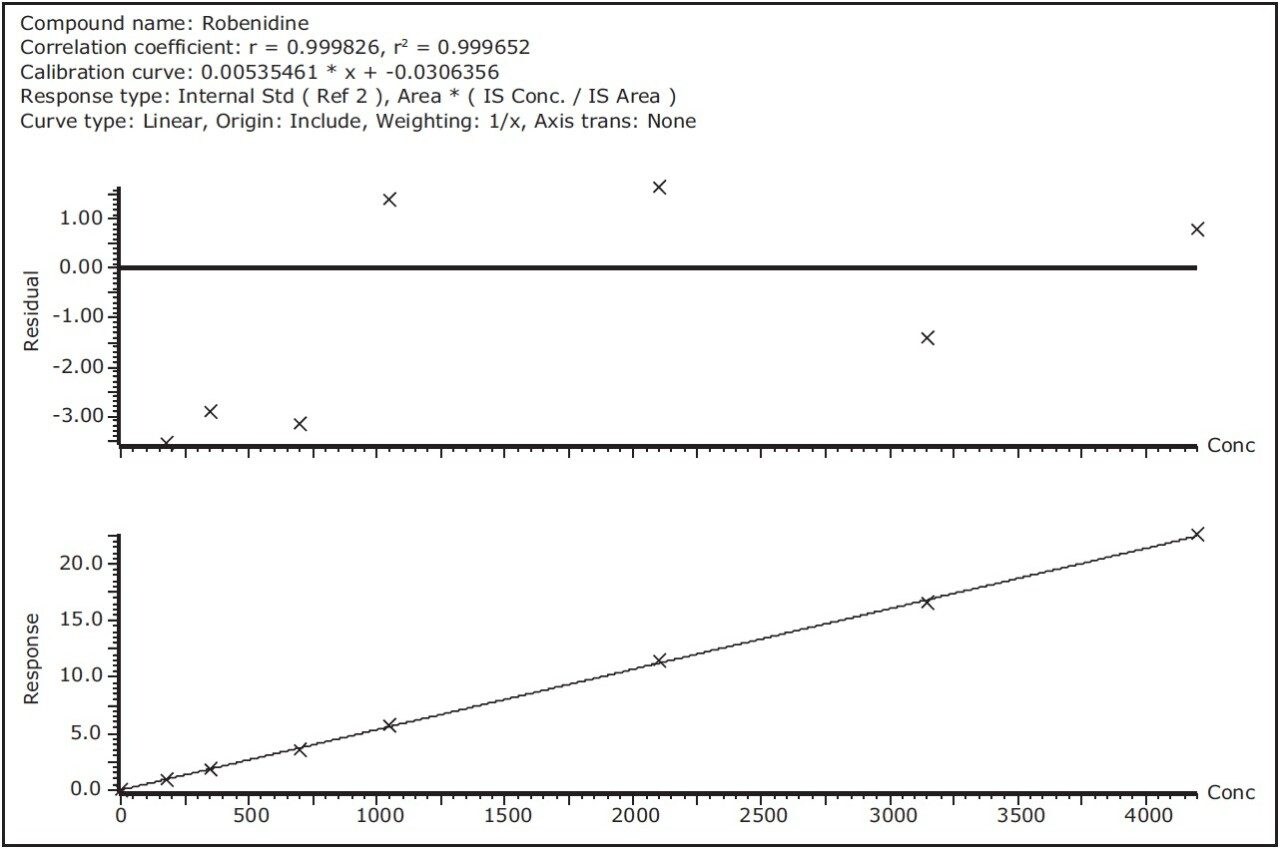
In addition feeds are very complex and diverse mixtures. In a routine environment, it is impossible to use matrix matched calibration or standard addition for each type of feed. Instead internal standards and one feed matrix are used. The method accuracy is then validated by selecting different feed matrices and performing spike recovery experiments at different levels with a quantitation of the results based on one feed matrix.

Table 1. Therapeutic dose, carry-over levels, and required LOQ for the 11 coccidiostats.

It is known that matrix components can significantly alter the response in electrospray ionization, either a signal enhancement, but most likely signal suppression. Matrix effects are minimized by reducing the absolute amount of matrix ions in the source region. One way that this can be achieved is to dilute the samples (if this method used is sensitive enough to permit this) and hence reduce the matrix loading on-column. As a consequence of this approach, when working in a routine food and feed testing laboratory, it can also be observed that the instrument will require less frequent cleaning and therefore better instrument uptime and method robustness.

This application note describes a fast, accurate, and robust UPLC/MS-MS method using Waters ACQUITY UPLC I-Class System with Xevo TQ-S for the detection of 11 coccidiostatic agents in feed at levels down to 0.25% carryover levels. The Xevo TQ-S is a highly sensitive tandem quadrupole instrument with fast positive/negative ion switching capabilities able to deal with challenging matrices.

Experimental

Sample preparation

This method was previously employed on a HPLC-MS-MS and has been transferred to appropriate conditions for UPLC, and also includes the addition of a final dilution step.

1. Weigh 5 g of ground and homogenized feed sample into a 50-mL disposable centrifuge tube.

2. Spike with 50-μL internal standard pool (50 μg/mL robenidine-d8 and nigericine, 25 μg/mL DNC-d8, 5 μg/mL diclazuril-bis and decoquinate d5).

3. Add 10 mL of a 10% Na2CO3 solution and hand shake.

4. Add 15 mL acetonitrile

5. Shake for 30 minutes.

6. Centrifuge 5 minutes at 2000 rpm (4 °C).

7. Transfer the supernatant into a 50-mL tube.

8. Repeat the acetonitrile extraction and combine both organic extracts.

9. Transfer 1 mL of extract in a glass tube and dilute the samples 50 times in initial mobile phase.

UPLC conditions

System:

ACQUITY UPLC I-Class

Column:

ACQUITY BEH C18 2.1 x 100 mm

Column Temp.:

50 °C

Sample Temp.:

10 °C

Injection:

10 μL

Mobile phases:

A Water 0.1% formic acid B Methanol 0.1% formic acid

The gradient is shown in Table 2

Time

%A

%B

Curve

0.0

50

50

0.5

50

50

6

3.0

0

100

6

5.0

0

100

6

7.0

50

50

1

MS conditions

MS system:

Xevo TQ-S

Polarity:

ES +/-

Capillary voltage (kV):

1.00 in positive ion ES and 3.00 in negative ion ES

Source temp.:

150 °C

Desolvation temp.:

500 °C

Cone gas flow:

150 L/hr

Desolvation gas flow:

1200 L/h

Compound tuning was accomplished using IntelliStart Software. IntelliStart automatically generates up to 5 MRM transitions per compound on the basis of either a compound mass or its elemental composition. The advantage is fact that multiple adducts can be selected simultaneously. This is particularly interesting for coccidiostatic agents that easily form sodium adducts. A screenshot of the IntelliStart wizard is shown in Figure 1. An extract of optimized MRM transitions for maduramycin can be found in Figure 2.

Figure 1. Screenshot of the Intellistart wizard for maduramycin with elemental composition C47H80O17 .
Figure 2. Extract from IntelliStart method development report showing optimization of cone voltage (A), optimization of collision energy for two transitions (B, C), and location of product ions (D) for the sodium adduct of maduramycin.

A separate MS function was automatically created for every individual compound. Table 3 shows an overview of all MRM transitions, including optimal cone voltage and collision energy. Two or three MRM transitions were chosen per component, except for the internal standards.

Table 3. MS method parameters for the 11 coccidiostats and their internal standards

Figure 3A shows the MassLynx MS method editor with retention time windows for each of the components. Figure 3B shows a typical function containing decoquinate and its internal standard.

Figure 3A: MassLynx MS method editor with retention time windows.
Figure 3B: MassLynx MS method function for decoquinate and its internal standard

Results and Discussion

Original HPLC-MS/MS method

An HPLC-MS/MS chromatogram of a 1% carryover sample using the original HPLC method is shown in Figure 4A.The total runtime was 16 minutes.1 There was an incomplete separation of the ionophore coccidiostats.

This method was then transferred to an ACQUITY I-Class System and the runtime was reduced without any significant effect on the spike recoveries. A typical chromatogram of a matrix-matched calibration standard at 1% carry-over level using this method is shown in Figure 4B. All 11 components eluted within a three-minute time frame. The overall method was eight minutes from injection to injection. Baseline separation was achieved for all components except for the pair lasalocid-maduramycin. There was clearly better separation of the ionophore coccidiostats.

Figure 4A. HPLC/MS-MS chromatogram of a matrix-matched calibration standard at 1% carry-over level, showing Halofuginone (1), robenidin (2), DNC (3), diclazuril (4), decoquinate (5), semduramycin (6), lasalocid (7), salinomycin (8), monensin (9), narasin (10) and maduramycin (11). 4B. UPLC-MS/MS chromatogram of a matrix-matched calibration standard at 1% carry-over level, showing halofuginone (1), robenidin (2), DNC (3), diclazuril (4), decoquinate (5), semduramycin (6), lasalocid (7), salinomycin (8), monensin (9), narasin (10) and maduramycin (11).

Chromatographic method development – RADAR

The original HPLC method was transferred from an Alliance HPLC System to an ACQUITY UPLC System. When using a UPLC method with a 3-minute gradient only, Semduramycin showed positive recoveries up to 200% in some of the feed QC samples relative to the matrix matched calibration standard. Using a 6-minute gradient, recoveries were within the acceptance criteria. By using the RADAR functionality on the Xevo TQ-S, MRM and full scan chromatograms were acquired simultaneously. As shown in Figure 5A, a matrix component is interfering at the same retention time as semduramycin, possibly giving rise to the observed matrix effect. In Figure 5B it is clear that the longer gradient time results in a better separation between semduramycin and the matrix component.

Figure 5A. MRM chromatogram of semduramycin (bottom trace) and Full scan TIC (top trace) with zoom on retention time zone of interest, showing a chromatographic interference at the retention time of semduramycin.
Figure 5B. MRM chromatogram of semduramycin (bottom trace) and full scan TIC (top trace) with zoom on retention time zone of interest, showing a chromatographic separation of the interference at the retention time of semduramycin.

Matrix effects – RADAR

We tested to find out to what extent the 50x diluted sample was susceptible to matrix effects. In the absence of matrix effects in the 50x diluted extract, it would be possible to use solvent- based calibration curves instead of matrix-matched calibration curves. In order to do this, both blank feed extract and solvent were spiked with the same concentration of coccidiostats, corresponding to the 0.25% carry-over level. An aliquot of both spike addition samples was also diluted sample 50 times. Matrix effects were then calculated for both dilution states as the ratio of the peak area of the different compounds in the extract divided by the peak area of the compound in the solvent standard. The results are described in Table 4.

Table 4. Matrix effects in undiluted and 50x diluted feed extract spiked at the 0.25% contamination level.

For the undiluted sample, matrix effects was less likely for the late eluting compounds and variedfrom virtually nothing (Narasin, Salinomycin, and DNC) to extremely high (halofuginone and maduramycin). In the case of undiluted extracts, it is clear that matrix-matched calibration curves are a must.

For the 50 times diluted samples, matrix effects were clearly reduced and all below 7%, except for the early eluting halofuginone (45%) and robenidine (12%). Lasalocid showed a 20% signal enhancement in the presence of 50 times diluted feed extract. It is therefore best to still use a matrix matched calibration curve.

As would be expected, the total ion current (TIC) in the case of the undiluted sample is significantly higher than the TIC in the chromatograms of the 50 times diluted sample. It can be concluded that matrix effects are highly reduced when the feed extracts are diluted 50 times. With the sensitivity of the Xevo TQ-S, these diluted feed samples can still be analyzed with good sensitivity. Analyzing smaller amounts of diluted samples will lead to less frequent cleaning and therefore better instrument uptime and better method robustness. 

Sensitivity

At the 0.25% carryover level, even the most challenging components (halofuginone, diclazuril, maduramycin, and Semduramycin) can still be detected with signal-to-noise values above 20. The signal-to-noise was determined using raw data and a peak-to-peak noise definition. Taken into account the extraction procedure, the 0.25% carry-over levels corresponds to amounts injected on column that are shown in Table 5. A chromatogram of a matrix-matched calibration standard at 0.25% carryover level with corresponding signal-to noise levels can be found in Figure 6.

Table 5. Absolute amounts injected on column in the 0.25% carry-over calibration standard
Figure 6. UPLC-MS-MS chromatogram of a matrixmatched calibration standard at 1% carryover level, showing Halofuginone (1), robenidin (2), DNC (3), diclazuril (4), semduramycin (5), decoquinate (6), monensin (7), lasalocid (8), maduramycin (9), salinomycin (10) and narasin (11).
Figure 7. Chromatogram of a matrix-matched calibration standard at 0.25% carry-over level with signal-to-noise values.

Spike recovery and repeatability

Eight fortified samples at 0.5% (n=1), at 1% (n=4) and at 3% (n=3) carryover level were analyzed with an eight-point matrix-matched calibration curve ranging from 0.25% to 6% carryover level of the maximum authorized content. Spike recovery and repeatability were determined and fulfill requirements of EU Decision 2002/657/CE.

For repeatability six replicates were analyzed. The results are shown in Table 6. Repeatability at the 1% carryover level was excellent with %CV values below 10% except for diclazuril (15%).

Table 6. %CV values for all 11 coccidiostats

These values are in good agreement with those obtained via the original HPLC/MS-MS method.1

For accuracy, spike recovery experiments were carried out. Recovery values are all within the acceptance criteria specified by EU Decision 2002/657/CE.

Linearity

Linearity was examined by injecting a eight-point calibration curve for all 11 compounds. Linearity was excellent and within the studied range with coefficients of determination values above 0.995. Of all 88 calibration points, deviations were within a ±10% range, except for 3 points with a maximum deviation of +14%. Examples of residual curves and calibration curves are shown in Figure 8 for robenidin, halofuginone, and diclazuril. Due to the higher ion counts of the Xevo TQ-S at the LOQ level, the accuracy and precision at these low detection levels was better compared to other instruments.

Figure 8A. Residuals curve and calibration curve for halofuginone.
Figure 8B. Residuals curve and calibration curve for robenidin
Figure 8C. Residuals curve and calibration curve for DNC.

Conclusion

A fast, robust, accurate, and sensitive method for 11 coccidiostats in feed samples was developed on an ACQUITY UPLC I-Class with Xevo TQ-S. Compared to the original HPLC-MS/MS method the feed sample extracts could be further diluted by a factor of 50, using only half the injection volume. This leads to less frequent instrument cleaning and therefore better instrument uptime and better assay robustness. RADAR provides the necessary qualitative information about possible matrix effects and is therefore a valuable tool during method development.

References

  1. PH Delahaut, G Pierret, N Ralet, M Dubois and N Gillard.Multi-residue method for detecting coccidiostats at carry-over level in feed by HPLC-MS/MS. Food Additives and Contaminants. 27: 6, 801-809, June 2010.

720004769, August 2013

맨 위로 돌아가기 맨 위로 돌아가기