• 응용 자료

Effect of Pore Size in UPLC Peptide Mapping

Effect of Pore Size in UPLC Peptide Mapping

  • Beth L. Gillece-Castro
  • Thomas E. Wheat
  • Jeffrey R. Mazzeo
  • Waters Corporation

Abstract

The enhanced chromatographic resolution associated with UltraPerformance LC (UPLC) has been demonstrated for peptide mapping. The technique improves resolution by a factor of three or more.

Introduction

The enhanced chromatographic resolution associated with UltraPerformance LC (UPLC) has been demonstrated for peptide mapping (Mazzeo, et al., Biopharm.). The technique improves resolution by a factor of three or more.

In addition, the surface chemistry of the ACQUITY UPLC BEH Technology particles has proven especially advantageous for peptide mapping; good retention and peak shape are observed with either TFA or formic acid as a modifier. The former modifier is preferred for best sensitivity with UV detection, while the latter improves signal-to-noise in electrospray MS experiments. Glycopeptides, which exhibit microheterogeneity, have also been shown to have enhanced resolution and peak shape. These benefits have been demonstrated for tryptic digests of several proteins.

The utility of UPLC peptide mapping for characterizing protein structure can be further extended by expanding the range of column chemistries available. Many peptide chromatographers prefer to use large pore packing materials for peptide separations. The Peptide Separation Technology columns for UPLC include both 130 Å and 300 Å pore size materials.

The separation of two complex peptide digests on these two pore sizes are compared here. One is a tryptic digest of phosphorylase b, a sample with a large number of smaller peptides; and the other is a LysC digest of phosphorylase b, to give a smaller number of larger peptides. Coupling UPLC chromatography to an oa-TOF mass spectrometer allows high sensitivity identification of peptides and glycopeptides by exact mass measurement.

Experimental

System Configuration

  • Standard ACQUITY UPLC System modules, including the Binary Solvent Manager and Sample Manager, were used for the separation
  • A high-sensitivity mixer for peptide analysis (p/n: 205000403) was added to the system. Separations were monitored with a TUV detector at 214 nm and with an LCT Premier oa-TOF Mass Spectrometer

Preparation of digests

Phosphorylase b (rabbit) was dissolved in aqueous ammonium bicarbonate (pH 8) to a concentration of 1 mg/mL, and RapiGest was added to a concentration of 0.1%. LysC or Trypsin was added to separate aliquots of phosphorylase b solution at an enzyme-to-substrate ratio of 1:50 (w/w), and the samples were incubated overnight at 37 °C. The digestions were terminated by addition of trifluoroacetic acid to a concentration of 0.1%, and stored at <20 °C.

Separation Method

Injection volume:

10 μL

Columns:

Waters Peptide Separation Technology ACQUITY UPLC BEH 130, 1.7 μm 2.1 x 100 mm

ACQUITY UPLC BEH 300, 1.7 μm 2.1 x 100 mm

Temperature:

40 ˚C

Flow Rate:

100 μL/min

Solvent A:

0.1% TFA in water

Solvent B:

0.08% TFA in acetonitrile

The same chromatography method was used for both digests on both columns; that is, for all four experiments.

Gradient Table

Results and Discussion

Phosphorylase b was chosen to test chromatography due to the large number of peptides that can be derived from this 97 kDa protein. 110 peptides are expected from a complete tryptic digestion, whereas an IgG protein typically forms 50 to 60 tryptic peptides.

Separations of the phosphorylase b tryptic digest are shown in Figure 1. The same sample was analyzed on both the 130 Å and the 300 Å columns. Three peptides were chosen to monitor specific changes in the chromatogram. The observed peptide maps both have a large number of reasonably well-resolved, sharp, symmetrical peaks. Retention is lower on the larger pore size material. The change in retention for the specific tracked peaks is equivalent to elution at 4 to 5% lower concentration of acetonitrile. Even with the lower retention on the 300Å column, the four-residue peptide A is easily analyzed.

Figure 1. Comparison of the separation of tryptic digest of phosphorylase b on BEH 130, 1.7 μm (top) and on BEH 300, 1.7 μm (bottom) Peptide Separation Technology Columns. 

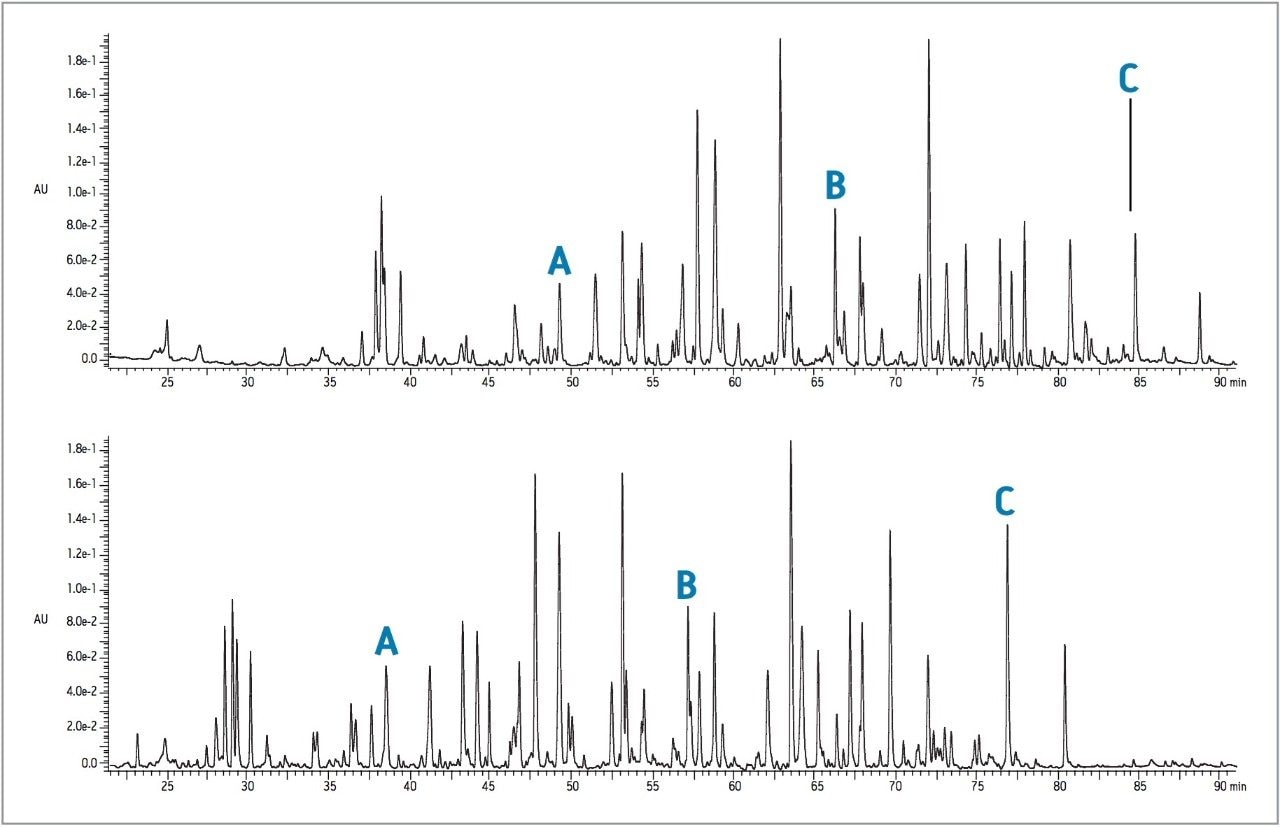
The selectivity between the two columns is similar, but not identical. For example, a similar pattern of peaks is found between 42 and 46 minutes in the 130 Å separation and between 52 and 56 minutes on the 300 Å column. Expressed as total resolving power, the calculated peak capacity for the 130Å column is about 1026 and for the 300 Å, is 1064. About 230 peaks were recognized on the smaller pore material and 240 on the larger pore.

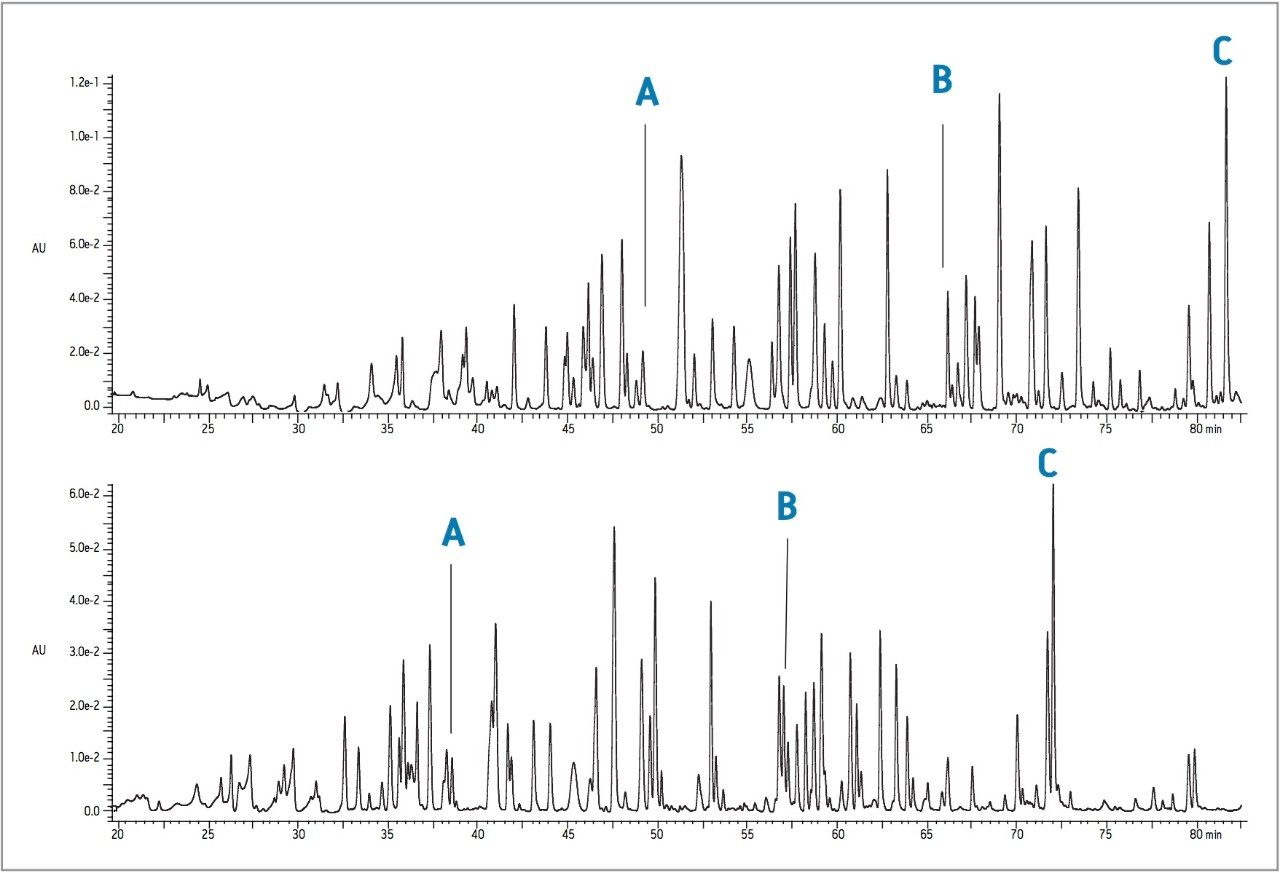
Digestion of this protein with LysC gives a smaller number of peptides including some larger species. The LysC digests were separated on both columns as shown in Figure 2. Again, peptide retention is generally lower on the larger pore size, and the selectivity is similar, but not identical. The columns, however, still share the same utility described for the separation of the tryptic digests.

The 300 Å packing would often be preferred for peptide mapping because the larger molecules are thought to diffuse more freely with larger pores. The chromatographic changes in these experiments do not obviously correlate with the molecular weight of the peptides. For example, the four-residue peptide GRIF is observed as a well-retained and resolved, symmetrical peak in all four maps. A much larger peptide, the LysC peptide representing the 36 residues with a molecular weight of 4477 Da, also elutes as a symmetrical peak from both columns. We are actively investigating the physical and chemical basis of the differences in chromatography. Both Peptide Separation Technology columns give useful separations of peptides over a wide range of sizes and chemical properties. The differences in selectivity will prove advantageous in the process of developing an optimized peptide map for a given protein.

Figure 2. Comparison of the separation of LysC digest of phosphorylase b on BEH 130, 1.7 μm (top) and on BEH 300, 1.7 μm (bottom) Peptide Separation Technology Columns. 

720001792, July 2011

맨 위로 돌아가기 맨 위로 돌아가기