• 응용 자료

Profiling and Quantitation of Metabolomic “Signatures” for Breast Cancer Cell Progression

Profiling and Quantitation of Metabolomic “Signatures” for Breast Cancer Cell Progression

  • Henry Shion
  • Irwin Kurland
  • Sumanta Goswami
  • David Kusin
  • Haitao Lu
  • Bhavapriya Vaitheesvaran
  • John P. Shockcor
  • Alan L. Millar
  • Waters Corporation
  • Albert Einstein College of Medicine of Yeshiva University
  • Yeshiva University
Cancer cell scientific 3d illustration

For research use only. Not for use in diagnostic procedures.

Abstract

In this application note, we present a metabolomics study that combines targeted and untargeted approaches for breast cancer biomarkers analysis.

Benefits

  • Quantify known small molecule biomarkers in targeted analysis with Xevo TQ MS.
  • Confirm known – and identify unknown – small molecule biomarkers in untargeted global profinlin analysis with SYNAPT G2 HDMS.
  • Targeted and untargeted approaches are complementary to each other; new pathways can be discovered using the untargeted approach.

Introduction

Breast cancer is one of the top five cancers that affect human lives seriously. Therefore, it is of great importance to discover the best ways to study this disease. Metabolic reprogramming is required both during the initial breast cancer transformation process (primary tumor) and during the acquisition of metastatic potential (metastases), shown in Figure 1. The reprogramming process includes altered flux through glycolysis and the pentose phosphate pathway (PPP), resulting in increased fatty acid synthesis needed for proliferation.

A two-step metabolic progression hypothesis
Figure 1. A two-step metabolic progression hypothesis during mammary tumor progression.1

Reactive oxygen species produced during tumor progression result in a decreased glutathione GSH (reduced)/GSSG (oxidized) redox pool, which impairs genome stability, tumor suppressor gene function, and control over cell proliferation. Continued GSH/GSSG depletion in the primary tumor may also contribute to general metastatic ability, and includes further changes in glycolysis and tricarboxylic acid cycle (TCA cycle) and increased nucleotide (PPP) flux for replication.

Staging of the metabolic reprogramming using metabolomics could pinpoint the metabolic processes that are essential for breast cancer transformation and invasiveness, which may yield biomarkers and new directions for therapeutics. In this application note, we present a metabolomics study that combines targeted and untargeted approaches for breast cancer biomarkers analysis. Figure 2 illustrates the workflow for this study.

Metabolomics biomarker analysis workflow
Figure 2. Metabolomics biomarker analysis workflow.

Experimental

Cell sample preparation

Two rodent breast cancer cell lines, MTln3 (highly metastatic) and MTC (poorly metastatic), were used and cultured in Eagle’s minimal essential medium and supplemented  with 5% fetal bovine serum (Invitrogen).

Cells were grown in 10-cm tissue culture dishes, and the media were replaced 24 h and 2 h prior to metabolite extraction. All samples were harvested at subconfluence.

Metabolism was quenched, and metabolites were extracted by aspiration of media and immediate addition of 4 mL of 80:20 methanol/water at 80 °C to simultaneously lyse cells and quench metabolism.

LC Conditions

System:

Waters ACQUITY UPLC System

Column:

ACQUITY UPLC HSS T3 Column 2.1 x 100 mm, 1.8 μm

Column temp.:

40 °C

Flow rate:

300 μL/min

Mobile phase A:

Water, 0.1% Formic Acid

Mobile phase B:

Acetonitrile, 0.1% Formic Acid

Injection vol.:

10 μL

Gradient

Time (min)

%A

%B

Curve

Initial

99

1

Initial

8.0

50

50

6

8.1

1

99

6

11.0

1

99

6

11.1

99

1

6

15.0

99

1

6

Mass Spectrometry

SYNAPT G2 HDMS for Untargeted Global Analysis

The SYNAPT G2 HDMS was operated in both positive and negative MSE modes. The capillary voltage used was 2.0 kV with the source and desolvation temperatures set at 120 °C and 400 °C, respectively.

In the MSE acquisition mode, the instrument alternates between a low and high collision energy state on alternate scans. This allows for collection of precursor and fragment ion information of all species in an analysis without the sampling bias that is introduced with other common methods, such as DDA where a specific m/z must be isolated before fragmentation.

 MSE enables collection of comprehensive precursor and product ion information
Figure 3. MSE enables collection of comprehensive precursor and product ion information for virtually every component of a mixture.

Xevo TQ MS for Targeted Analysis

The Xevo TQ MS was operated in both positive and negative MRM modes. The capillary voltage used was 2.0 kV with the source and desolvation temperatures set at 150 °C and 650 °C, respectively. The desolvation gas flow was set at 1200 L/hr and the collision gas (argon) flow 0.18 mL/min (4 x 10⁻³ mBar), with MS1/MS2 resolution at unit mass.

Results and Discussion

Targeted analysis was used to survey known metabolic pathways that are key to cancer aggressiveness, as outlined in Figure 1. Figure 4 shows many of the targeted metabolite markers that are elevated in the MTln3 cells from both the heat map (top) and relative change scale bar plot (bottom). Analysis of experimental data supports a Warburg effect cancer model.2 For highly aggressive MTln3 cells, high cytosolic NADH is indicated by a glycolytic/TCA cycle signature of an increased malate/aspartate shuttle, shown in Figure 6. High AMP levels for MTln3 cells suggest the elevated malate/aspartate shuttle cannot keep up with cellular energy needs. High levels of amino acids seen in MTln3 cells are necessary for cell growth.

 Both the heat map (top) and the relative change scale bar plot
Figure 4. Both the heat map (top) and the relative change scale bar plot (bottom) markers indicate the elevation of the metabolites in the MTLn3 cells.
 Glycolysis and TCA Cycle
Figure 5. Glycolysis and TCA Cycle.
 Targeted analysis quantitative bar charts
Figure 6. Targeted analysis quantitative bar charts for selected Glycolysis and TCA Cycle metabolites.

As shown in Figure 6, adenosine monophosphate (AMP) is extremely high in concentration. This indicates that the highly aggressive MTln3 cells require a large amount of energy. Even with a high malate/aspartate shuttle, adenosine triphosphate (ATP) production cannot keep pace.

AMP functions as an energy sensor and regulator of metabolism. When ATP production does not keep up with needs, a higher portion of a cell’s adenine nucleotide pool is made available in the form of AMP. AMP then stimulates metabolic pathways that produce ATP in the MTln3 cells.

The “signature” of high levels of malate, glutamate, aspartate, and alpha ketoglutarate (as high as 10 fold) means high cytosolic NADH must use these carriers for transport into the mitochondria to turn into ATP. Highly aggressive cancer cells, such as MTln3, have high glycolysis and need the malate/aspartate/glutamate/ alpha-ketogutarate shuttle system to satisfy the ATP needs. This shuttle cannot work fast enough because AMP is still very high.

For untargeted global profiling analysis, all the samples were run in triplicate. A QC sample was made by mixing equal volumes of each sample. 10 QC samples were injected prior to the first sample in the experiment. A QC sample was also injected every 10 sample injections.

A comparison of two typical chromatograms from the MTC and MTln3 cells
Figure 7. A comparison of two typical chromatograms from the MTC and MTln3 cells. The figure clearly shows that there is difference between these two samples.

For the data analysis, MarkerLynx XS Application Manager3 was used to integrate and align chemical and biological MS data points and convert them into Exact Mass Retention Time (EMRT) pairs. Those EMRT pairs can then be used for multivariate statistical analysis, such as principle component analysis (PCA-X), partial least-squares to latent structures data analysis (PLS-DA), and orthogonal PLS data analysis (OPLS-DA) to visualize and interpret the information-rich and complex MS data, as shown in both Figures 8 and 9.

The difference between the two sets of sample cells
Figure 8. The difference between the two sets of sample cells further demonstrated in the 3D score plot by multivariate statistical analysis using MarkerLynx XS Application Manager.
The selected markers
Figure 9. The selected markers from the S-Plot (A) can be transformed into table (B) and bar chart (C) to illustrate their contribution to the differences between the two sample cell lines. The markers can also be used for database searching for identification through in-house or online databases, such as ChemSpider. A couple of new markers, 2-dyhydropantoate and 4-hydroxymandelate were also found from the database. They are indications of increased methyl transferase activity, key to function of biosynthetic pathways. New markers (D) were found from database searching by untargeted analysis.

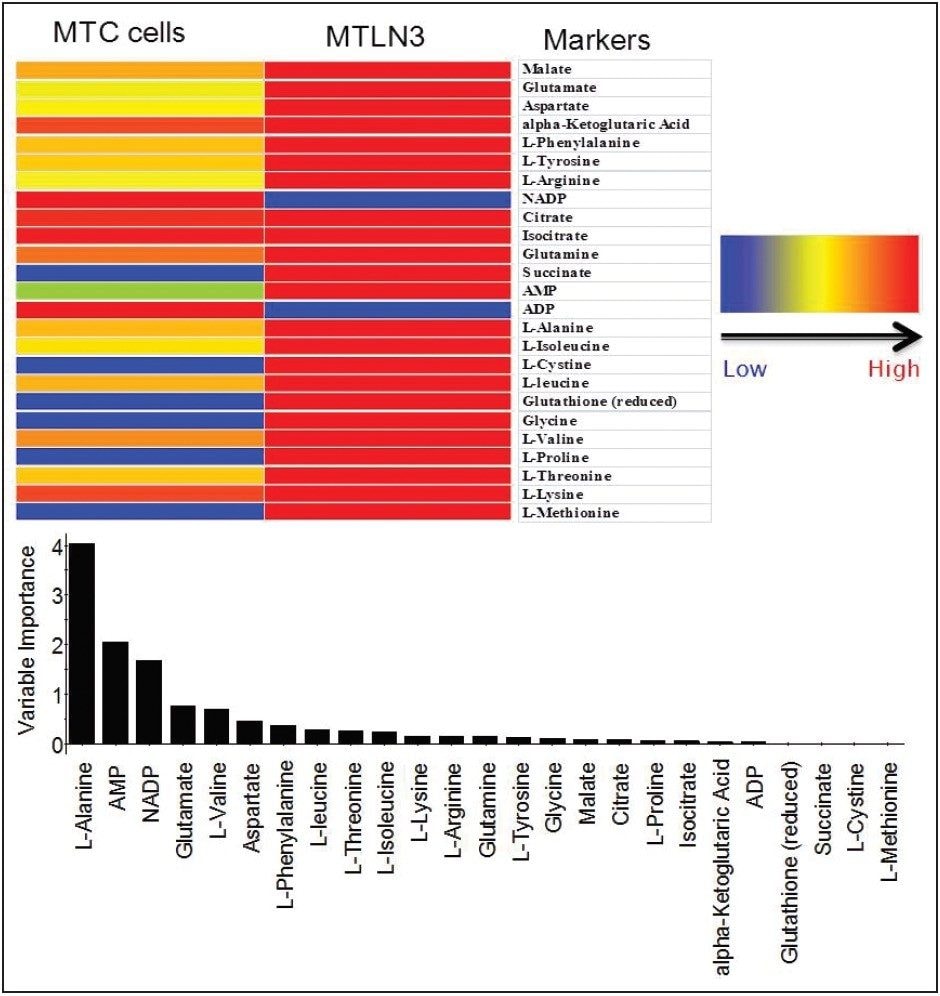
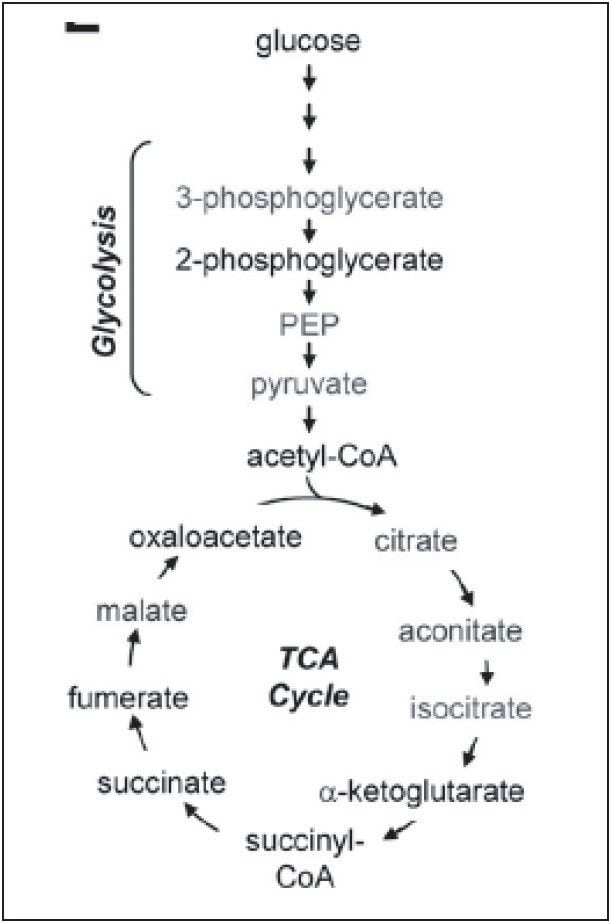
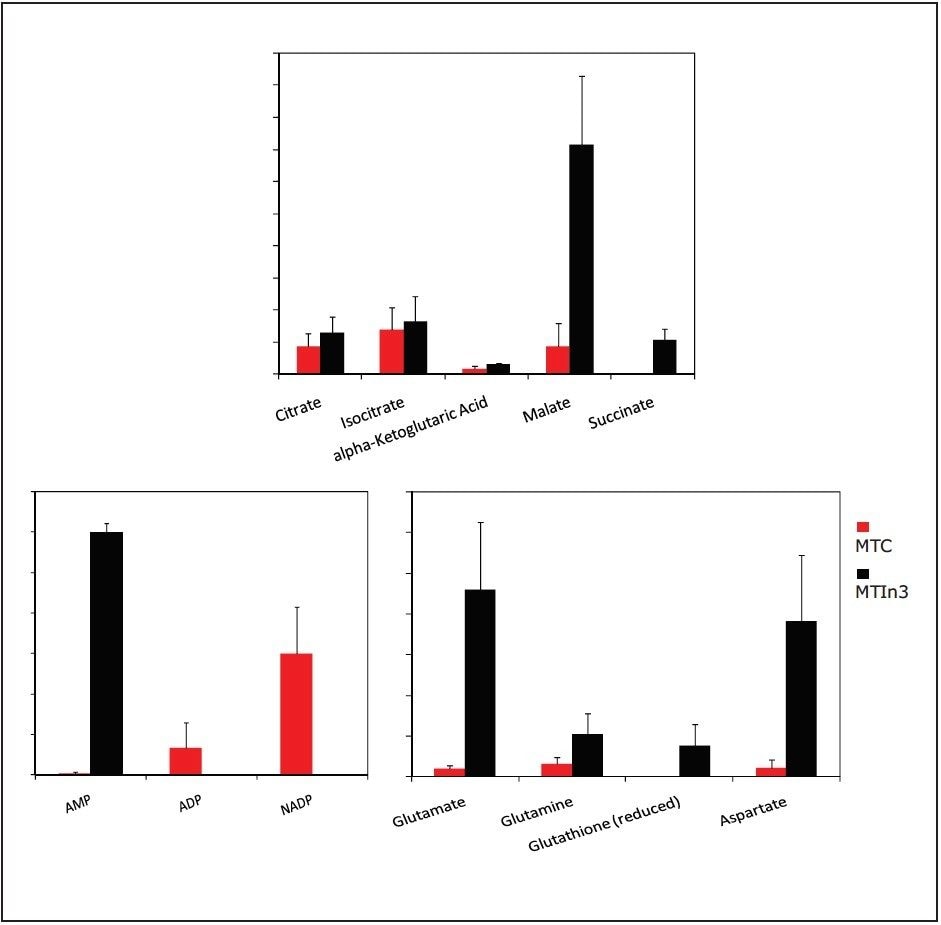
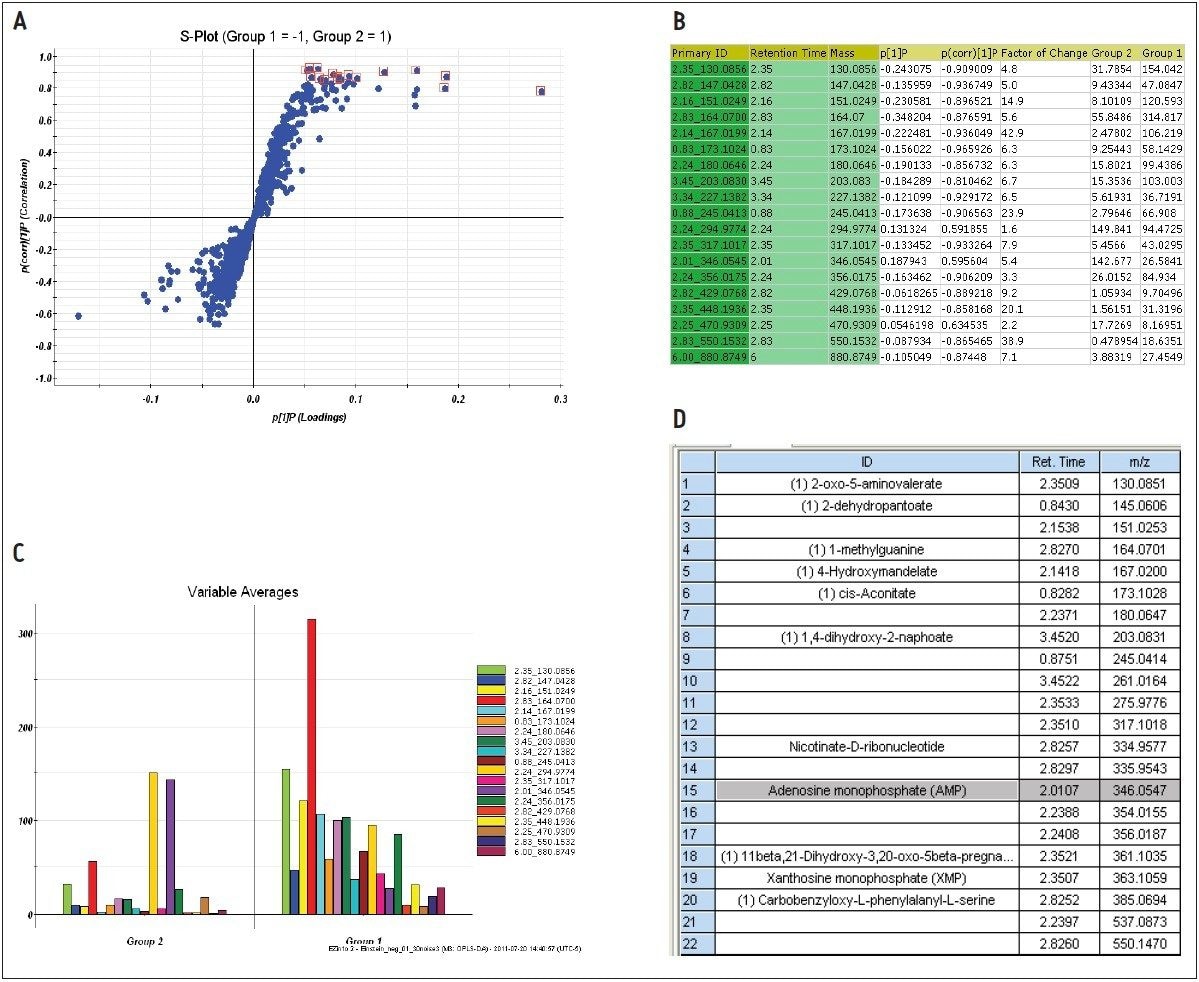
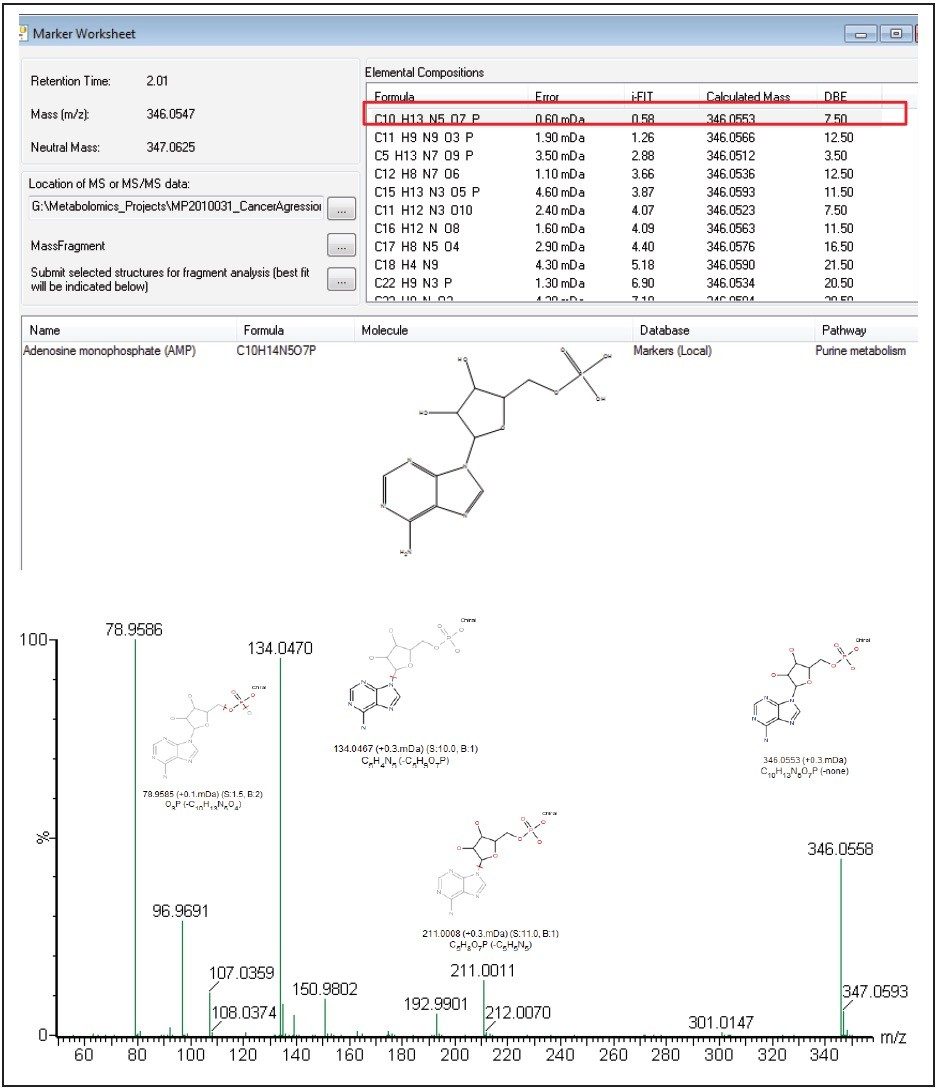
The markers from MarkerLynx statistical analysis were validated, in part, by identifying hits in pathways complementary to those found in targeted analysis, and builds belief in new untargeted hits found. For example, untargeted analysis, shown in Figures 4 and 6, indicated high AMP and phosphoenelpyruvate (PEP) along with high cis-aconitate in aggressive cells. AMP was identified from targeted analysis; cis-aconitate supports targeted analysis finding for increased flux into the TCA cycle, and PEP for increased glycolysis. Markers/carriers (malate/aspartate shuttle) for high cytosolic NADH from targeted analysis are complementary to untargeted findings of high nicotinamide-D-ribonucleotide, a step in NAD synthesis degradation product of amino acids found to be elevated by targeted analysis. Targeted analysis found high levels of aspartate, isoleucine, tyrosine, arginine, and others. Untargeted analysis showed markers for amino acid degradation with high 2-oxo-5-aminovalerate, a breakdown product of arginine; 1,4 dihydrooxy-2-naphoate, a breakdown product of tyrosine; alpha-hydroxyisovalerate, a marker for branched chain amino acid (isoleucine) breakdown; and homoserine, a breakdown product of aspartate.

Among the new markers found from database searching by untargeted analysis are 2-dehydropantoate and 4-hydroxymandelate, as shown in Figure 9D. They are indications of increased methyl transferase activity, which is key to function of biosynthetic pathways. Our results show that any of these pathways appears to be upregulated in the MTln3 cells.

The Chemspider database searching result for AMP
Figure 10. The Chemspider database searching result for AMP indicates a positive identification of the compound (top). The MS/MS spectrum for AMP from the MSE data acquisition confirms the structure of AMP (bottom). Fragmentation structures were matched using the MassFragment Software.

Conclusion

We have successfully demonstrated a metabolomics study workflow that combines targeted and untargeted approaches for breast cancer biomarker analysis.

Aggressive cell MTLn3 and non-aggressive cell MTC show dramatically different concentrations of the biomarkers, such as malate and AMP in glycolysis and TCA cycle, which indicates glycolysis is higher in MTln3 cells.

Known markers of cancer aggressiveness can be analyzed by a targeted approach using Xevo TQ or Xevo TQ-S.

Hits are validated by identifying hits in pathways complementary to those found in targeted analysis using SYNAPT G2; this builds belief in new untargeted hits identified/discovered.

New markers and thereby new pathways can be discovered by untargeted SYNAPT G2 analysis. One example would be 2-dehydropantoate and 4-hydroxymandelate, which are markers for increased methyl transferase activity. Methyl transferase activity is key to the function of biosynthetic pathways.

References

  1. Lu X, Bennet B, Mu E, Rabinowitz J, and Kang Y; JBC, 285, NO. 13, 9317–9321, 2010.
  2. Warburg O; “On the Origin of Cancer Cells” Science, 123 (3191): 309–314, 1956.
  3. Shion H; “The Metabolomic Analysis of Simvastatin Dosed Rat Plasma by GC/TOF/MS”, Waters application note, 720003119en, 2009.

720004106, October 2011

맨 위로 돌아가기 맨 위로 돌아가기