• 응용 자료

Rapid and Sensitive Targeted TOF Screening for Pesticides in Environmental Waters

Rapid and Sensitive Targeted TOF Screening for Pesticides in Environmental Waters

  • Eleanor Riches
  • James Morphet
  • Paul Silcock
  • Peter Hancock
  • Hilary J. Major
  • Waters Corporation

Abstract

This application note describes the multi-residue broad-scope pesticide screening of environmental waters using Oasis HLB Cartridges for SPE cleanup and pre-concentration, followed by analysis using ACQUITY UPLC System, coupled with Xevo G2 QTof. Data were processed with POSI±IVE TOF Screening Software.

Benefits

  • Streamlines the TOF screening workflow through the use of POSI±IVE Software and Waters Chemical Analysis TOF Screening Database.
  • Reliable and reproducible exact mass across a peak enables the application of narrow chromatographic extraction windows to help reduce false positives.
  • MSE data acquisition allows the simultaneous acquisition of both low energy precursor ion (MS) data and high energy fragment ion (MSE) data in a single injection, for unequivocal compound identification.

Introduction

In the environmental monitoring arena the use of Time-of-Flight (TOF) screening approaches has steadily increased. This technique offers particular benefits including the acquisition of full scan data, and the ability to re-interrogate historical data for unexpected compounds.

Screening of environmental waters is especially important because in recent times the use of pesticides, herbicides, and fungicides has proliferated in an effort to meet global food demands. A percentage of such chemicals applied to crops will inevitably end up leaching into the surrounding soil and waterways. Strict environmental monitoring is mandated, 1, 2 which endeavors to safeguard the environment, plants, and wildlife from harm as a result of exposure to these types of chemicals.

In response to water quality requirements3 and to ensure protection of the aquatic ecosystem, analysts require a complete picture of the components present in the water under investigation. A TOF screening approach is ideally suited to this type of analysis; however, confidence in the correct identification of contaminant compounds is vital. The use of narrow mass extraction windows when analyzing data can reduce the possibility of peak misidentification and minimize the risk of errors. In addition, many key compounds of interest are likely to be present at trace levels at the same time as other naturally occurring compounds at very high concentrations, such as humic and fulvic acids – formed from plant material decomposition. This means that the TOF instrumentation must be sufficiently sensitive and accurate to ensure that hazardous materials are correctly detected and identified, while at the same time maintaining exact mass accuracy for components at very low concentrations.

This application note describes the multi-residue broad-scope pesticide screening of environmental waters using Oasis HLB Cartridges for SPE cleanup and pre-concentration, followed by analysis using ACQUITY UPLC System, coupled with Xevo G2 QTof. Data were processed with POSI±IVE TOF Screening Software.

Experimental

SPE sample preparation

A sample of sewage effluent was collected at the point of discharge into a UK river. A 200 mL aliquot of this sewage effluent was extracted using Oasis HLB SPE Cartridges and enriched with a suite of 105 commonly used pesticides. A 200x concentration was achieved.

A similar procedure was carried out with surface water, also collected from a UK river.

Sample preparation conditions

Cartridge:

Oasis HLB 30 μm 60 mg/3 cc

Condition:

2 x 1 mL methanol

Equilibrate:

2 x 1 mL water

Load:

200 mL sewage effluent sample (< 10 mL/min)

Wash:

2 x 1 mL 5% methanol in water

Elute:

2 x 1 mL methanol

Evaporate:

Under nitrogen – reduce 2 mL to 1 mL volumetrically

LC conditions

LC system:

ACQUITY UPLC System

Runtime:

2.0 min or 5.0 min

Column:

ACQUITY BEH C18 1.7 μm, 2.1 x 50 mm

Column temp:

45 °C

Mobile phase A:

10 mL of 1 M aqueous ammonium acetate solution and 990 mL water

Mobile phase B:

10 mL of 1 M aqueous ammonium acetate solution and 990 mL methanol

Flow rate:

0.6 mL/min

Injection volume:

3.0 μL

UPLC gradients are detailed in Table 1 and Table 2.

ACQUITY UPLC gradient for 2-minute rapid screening run
Table 1. ACQUITY UPLC gradient for 2-minute rapid screening run.
ACQUITY UPLC gradient for 5-minute standard screening run
Table 2. ACQUITY UPLC gradient for 5-minute standard screening run.

MS conditions

MS system:

Xevo G2 QTof

Ionization mode:

ESI positive

Analyzer:

Resolution mode

Scan time:

0.1 s

Capillary voltage:

1.0 kV

Sampling cone:

30

Source temp:

120 °C

Desolvation temp:

550 °C

Desolvation gas:

1000 L/hr

Cone gas:

50 L/hr

Mass range:

50 – 1000 m/z

MSE conditions

Low energy:

6.0

High energy ramp:

25.0 – 35.0

LockSpray conditions

Compound:

Leucine enkephalin

Masses:

m/z 556.2771 and m/z 278.1141

Flow rate:

20 μL/min

Capillary voltage:

3.0 kV

Collision energy:

21.0

Results and Discussion

The generic screening methods given above were used to acquire data and screen sewage effluent that had been collected at the point of discharge into a UK river. This approach was also used to screen a sample of surface water taken from the same UK river.

The TOF screening workflow is shown in Figure 1. Sample extraction followed by non-targeted data acquisition was employed, with subsequent targeted qualitative and quantitative data processing.

TOF screening workflow
Figure 1. TOF screening workflow showing non-targeted MSE data acquisition (all of the data all of the time) and targeted data processing using POSI±IVE Software.

Data acquired using the 5-minute standard screening run were processed using POSI±IVE Software. A targeted ChromaLynx XS method was used along with a generic TargetLynx method, which are utilized with POSI±IVE TOF Screening Software. Waters Chemical Analysis TOF Screening Database was used as the target file, enabling the positive ion data to be screened for over 630 compounds.

POSI±IVE Software enables TOF screening data to be qualitatively and quantitatively reviewed in a single pass, delivering important semi-quantitative results for positively detected components. Only those components that are positively or tentatively identified in the qualitative screening phase are transferred to the quantitative phase. This approach greatly reduces the amount of time for data processing and review, providing valuable timesaving to the user.

From the processing of these data, Figure 2 shows an example of a TargetLynx Results Browser, illustrating the quantitative aspect of the workflow. Figure 3 shows an example of a ChromaLynx XS Identify Browser, which illustrates the qualitative output. The related ChromaLynx XS data can easily be accessed from the TargetLynx Browser by clicking on the toggle button highlighted with a red circle in Figure 2. This transfers the analyst to the qualitative screening data for the individual compound shown in the quantitative TargetLynx Browser, allowing a streamlined approach to data evaluation with minimal user intervention.

Example quantitative TargetLynx Browser from POSI±IVE Software
Figure 2. Example quantitative TargetLynx Browser from POSI±IVE Software processing of sewage effluent, with the qualitative ChromaLynx XS toggle button highlighted with a red circle.

In Figure 3, the ions used to positively identify the presence of pirimiphos-ethyl are highlighted in blue in the Spectrum View window. The precursor ion, [M+H]+, had a measured exact mass of 334.1348 Da, compared with a calculated exact mass of 334.1354 Da. This ion had a ΔM of only 0.6 mDa, even when measured in a highly complex matrix such as sewage effluent. The fragment ion (Function 2 in the Spectrum View window), used for additional confidence in confirming the presence of this compound, had a measured exact mass of 182.1285 Da, and a calculated exact mass of 182.1293 Da, showing that the confirmatory fragment ion had a ΔM of 0.8 mDa.

Example ChromaLynx XS Browser from POSI±IVE Software
Figure 3. Example ChromaLynx XS Browser from POSI±IVE Software processing of sewage effluent.

Further interrogation of the data illustrates the reliability and accuracy of the exact mass values for pesticides fortified at levels below that of the typical EU drinking water limit of 100 ng/L, even in a challenging sewage effluent matrix. Figure 4 shows the ions formed for three different low mass compounds that coelute with high levels of background matrix ions, such as humic and fulvic acids, typically found in surface waters. The compounds shown in Figure 4 were components in a mix of 105 pesticides fortified at 50 ng/L in sewage effluent. These data were acquired using the very rapid 2-minute screening gradient. Table 3 shows a summary of the calculated and the acquired exact masses for the examples in Figure 4.

Examples of a single MS scan
Figure 4. Examples of a single MS scan for three different compounds fortified at 50 ng/L in sewage effluent.
Exact mass differences
Table 3. Exact mass differences for three pesticide compounds fortified at 50 ng/L in sewage effluent.

The ability to maintain this high level of exact mass accuracy, even at low levels in challenging complex matrices, means that greater confidence can be placed on reported results. Stable, reliable, and reproducible exact mass values allow the use of narrower chromatogram mass extraction windows, which reduces the detection of false positives.

Data were acquired using the rapid 2-minute screening gradient. Figure 5 illustrates the benefits of applying increasingly narrow mass extraction windows for one compound, fenuron (m/z 165.1028 Da), in the mix of 105 pesticides fortified at 100 ng/L in sewage effluent. Narrowing the mass extraction window reduces the number of peaks in the extracted ion chromatogram, thus simplifying the unequivocal identification of fenuron in this sample.

The applied benefits
Figure 5. The applied benefits of using increasingly narrow chromatogram extraction windows, illustrated by fenuron fortified at 100 ng/L in sewage effluent.

As databases for TOF screening grow increasingly larger, there are inevitably more compounds that form precursor or fragment ions with similar exact masses. Figure 6 shows an example of potential false positives, depending on how the data are extracted and processed.

False positives can be reduced by using narrow chromatogram extraction windows
Figure 6. False positives can be reduced by using narrow chromatogram extraction windows.

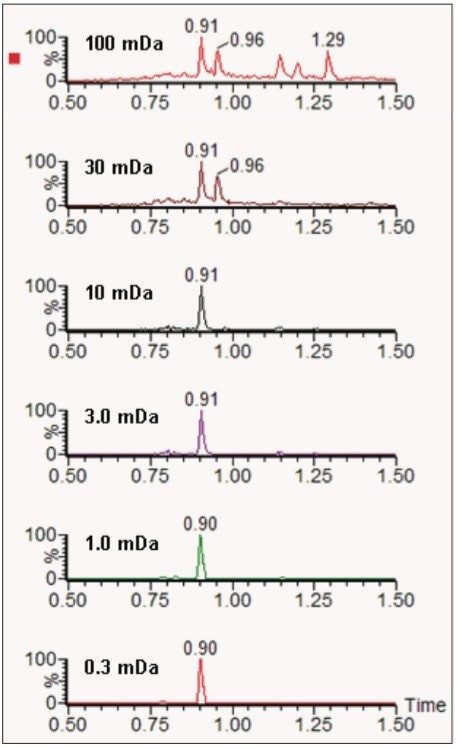
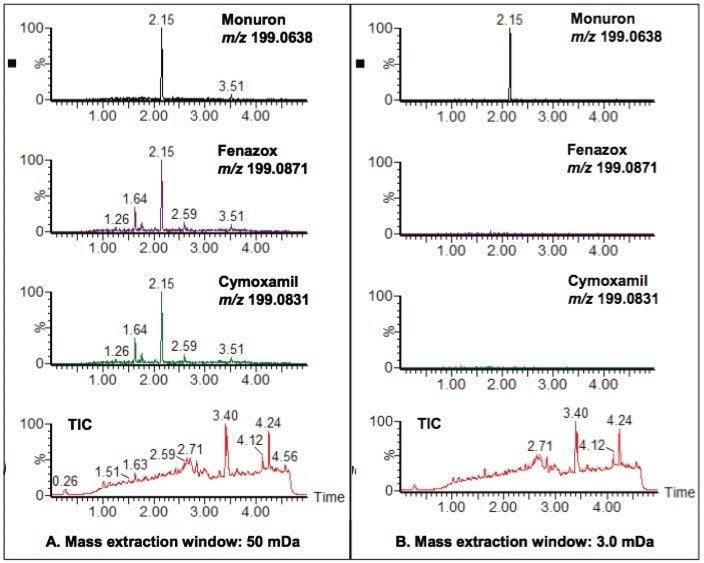
Three compounds in the TOF screening database, cymoxanil, fenazox and monuron, have very similar exact mass precursor ions: m/z 199.0831, m/z 199.0871, and m/z 199.0638 respectively. Figure 6A shows the chromatograms obtained if the extraction window used is 50 mDa. The chromatogram for each of these compounds contains peaks, which suggests that all three compounds may be present in the pesticide mix used to fortify the sewage effluent sample. However, if the chromatogram extraction window is narrowed to 3.0 mDa, as shown in Figure 6B, then it becomes clear that cymoxanil and fenazox were false positives when the 50 mDa extraction window was used, and that the only one of the three compounds definitely present in the sample was monuron. Cymoxanil and fenazox were not in the mix of 105 pesticides used to fortify the sewage effluent sample, whereas monuron was present in the mix.

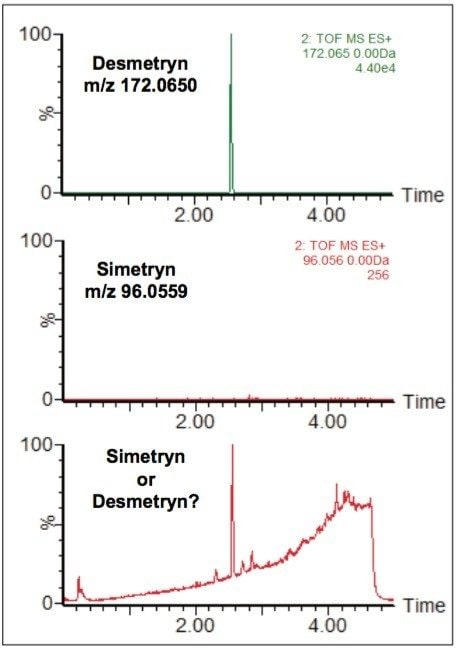
Further reduction in false positives and greater confidence in reported results can also be brought about by utilizing MSE data, which are routinely acquired within an acquisition run. MSE is a patented data-independent acquisition technique that provides a simple, unbiased, parallel route to deliver exact mass low energy precursor ion (MS), and high energy fragment ion (MSE) information from every detectable component, without the need for multiple injections.

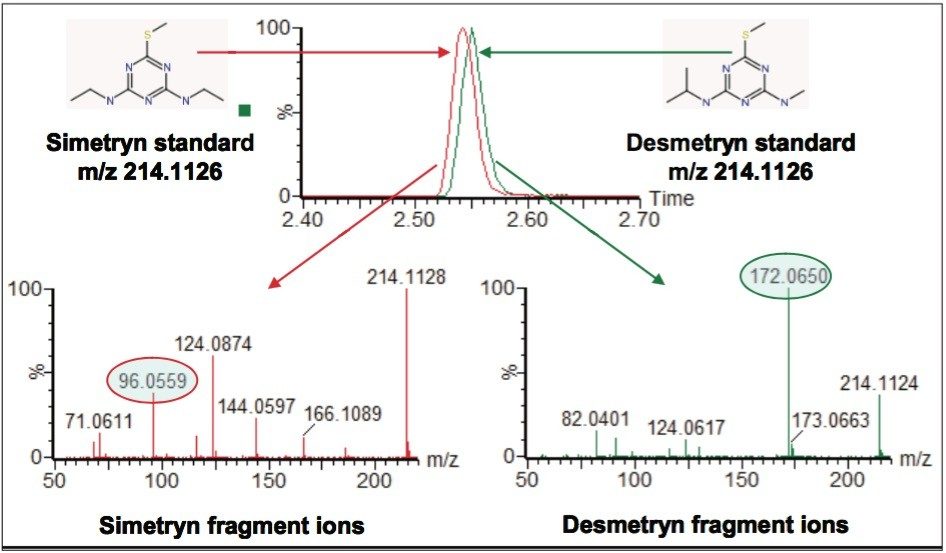
There are a number of cases, especially within pesticides analyses, where MS resolution alone is not sufficient to unequivocally identify a compound. Many active compounds are structural or optical isomers and, as a consequence, they are completely isobaric. In many cases, high-resolution chromatography may separate the isobaric components; however, even with UPLC baseline resolution may not be achieved.

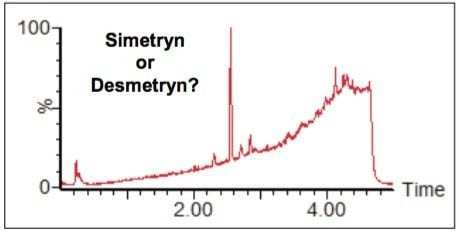
Figure 7 shows the TIC acquired for a river water sample spiked with a single component, either simetryn or desmetryn. The data were acquired using the standard 5-minute screening run. Screening data for individual solvent standards for each of the compounds, simetryn and desmetryn, were also acquired using the standard 5-minute screening gradient.

TIC of river water
Figure 7. TIC of river water spiked with either simetryn or desmetryn.

Figure 8 shows extracted ion chromatograms (XICs) for the two solvent standards overlaid on the same axis. This illustrates that even using UPLC the structures are so similar that they are not chromatographically resolved. Also shown in Figure 8 are the fragment ion spectra for the two different compounds. Even the very small structural difference between the two isomers gives rise to different fragment ions. We can see that certain fragments are uniquely associated with either simetryn or desmetryn, for example, the two ions circled in Figure 8. This phenomenon can be applied to MSE data to differentiate between the two compounds, where mass resolution and chromatography had previously failed.

Extracted ion chromatograms (XICs) for the two solvent standards
Figure 8. Simetryn and desmetryn are isobaric and coelute, but have unique MSE fragment ions that can be used to unequivocally identify them (circled).

Figure 9 shows the application of unique MSE fragment ion information to the sample shown previously in Figure 7. This demonstrates that the component causing this peak, which is one of two possible compounds, can be unequivocally identified as desmetryn. Only a single injection is required to achieve this final outcome, as both precursor ion data and fragment ion data are both acquired in the same run. The MSE functionality provides significant workflow streamlining and timesaving to the analytical laboratory.

MSE fragment ion data
Figure 9. MSE fragment ion data can unequivocally identify the spiked compound in river water as desmetryn.

Conclusion

  • The MSE functionality of Xevo G2 QTof enables the acquisition of both low energy (precursor ion) and high energy (fragment ion) data in a single, rapid screening run.
  • MSE fragment ion data can be used to help reduce false positives and provide unequivocal identification of detected compounds.
  • The highly reproducible and precise exact mass data affords increased confidence in the accuracy of the results.
  • False positives can also be reduced by employing narrow chromatogram extraction windows due to the stability of exact mass data across chromatogram peaks.
  • POSI±IVE Software provides a powerful combined qualitative and quantitative data processing approach for pesticide screening, and unequivocal compound identification.
  • Xevo G2 QTof with POSI±IVE Software for contaminant screening in water analysis offers a rapid and reliable screening approach, with reduced user intervention and streamlining of the screening workflow, providing valuable time saving benefits.

References

  1. Website: http://eur-lex.europa.eu/LexUriServ/LexUriServ.do?uri=CELEX:32000L0060:EN:HTML
  2. Website: http://www.waterboards.ca.gov/laws_regulations/docs/fedwaterpollutioncontrolact.pd
  3. Website: http://www.who.int/water_sanitation_health/dwq/GDWQ2004web.pdf

Acknowledgements

The authors would like to thank Chris Hunter and Alan Wainwright of the Environment Agency – National Laboratory Services (NLS), UK, for providing water samples.

720003671, August 2010

맨 위로 돌아가기 맨 위로 돌아가기