• 응용 자료

Monitoring Deamidation Progression in an Antibody Tryptic Digest using UPLC-MSE with BiopharmaLynx and a Xevo QTof MS System

Monitoring Deamidation Progression in an Antibody Tryptic Digest using UPLC-MSE with BiopharmaLynx and a Xevo QTof MS System

  • Hongwei Xie
  • Martin Gilar
  • Asish B. Chakraborty
  • Weibin Chen
  • Scott J. Berger
  • Waters Corporation

Abstract

In this application note, we demonstrate the use of UPLC-MSE and BiopharmaLynx for fast and effective monitoring of deamidation in an accelerated stability study of a monoclonal antibody tryptic digest. In vitro deamidations were introduced by exposing the peptide digest to elevated temperature (60 °C) and alkaline pH (~ 9). Deamidation changes over time were monitored by UPLC-MSE analysis using a Xevo QTof MS System coupled with an on-line ACQUITY UPLC peptide mapping system. The collected LC-MSE data were analyzed using BiopharmaLynx 1.2 Software to identify and quantify the levels of various deamidated peptides.

Introduction

Monoclonal antibodies (mAb) represent roughly half of all therapeutic proteins in clinical and preclinical development. While overall antibody stability is an attractive feature of this class of biotherapeutics, they are subjected to a variety of chemical degradations that can occur during production and upon extended storage. Deamidation of asparagine (N), and to a lesser extent glutamine (Q), residues is a common pathway for mAb degradation. Efficient detection and sensitive monitoring of deamidation level and sites has become a routine challenge for bioanalytical scientists.

In previous studies,1-2 we have demonstrated that peptide mapping with UPLC-MSE is capable of the separation and identification of peptides and their deamidated variants. Specifically, UPLC resolves the two common N-deamidated peptide products (where asparagine is converted to isoaspartic (isoD) or aspartic (D) acid) in addition to resolving a succinimide intermediate of the deamidation reaction. Using accurate mass UPLC-MSE analysis, these modification sites can be unambiguously identified and quantified.

Furthermore, the processing and interpretation of this complex mapping data can be automated using BiopharmaLynx, an informatics tool developed for analysis of peptide mapping and intact protein data from therapeutic proteins.3 This overall workflow allows annotation and quantitation of peptide maps with greater speed and confidence than manual data analysis or analysis with bioinformatics tools designed for proteomic investigations.

In this application note, we demonstrate the use of UPLC-MSE and BiopharmaLynx for fast and effective monitoring of deamidation in an accelerated stability study of a monoclonal antibody tryptic digest. In vitro deamidations were introduced by exposing the peptide digest to elevated temperature (60 °C) and alkaline pH (~ 9). Deamidation changes over time were monitored by UPLC-MSE analysis using a Xevo QTof MS System coupled with an on-line ACQUITY UPLC peptide mapping system. The collected LC-MSE data were analyzed using BiopharmaLynx 1.2 Software to identify and quantify the levels of various deamidated peptides.

Experimental

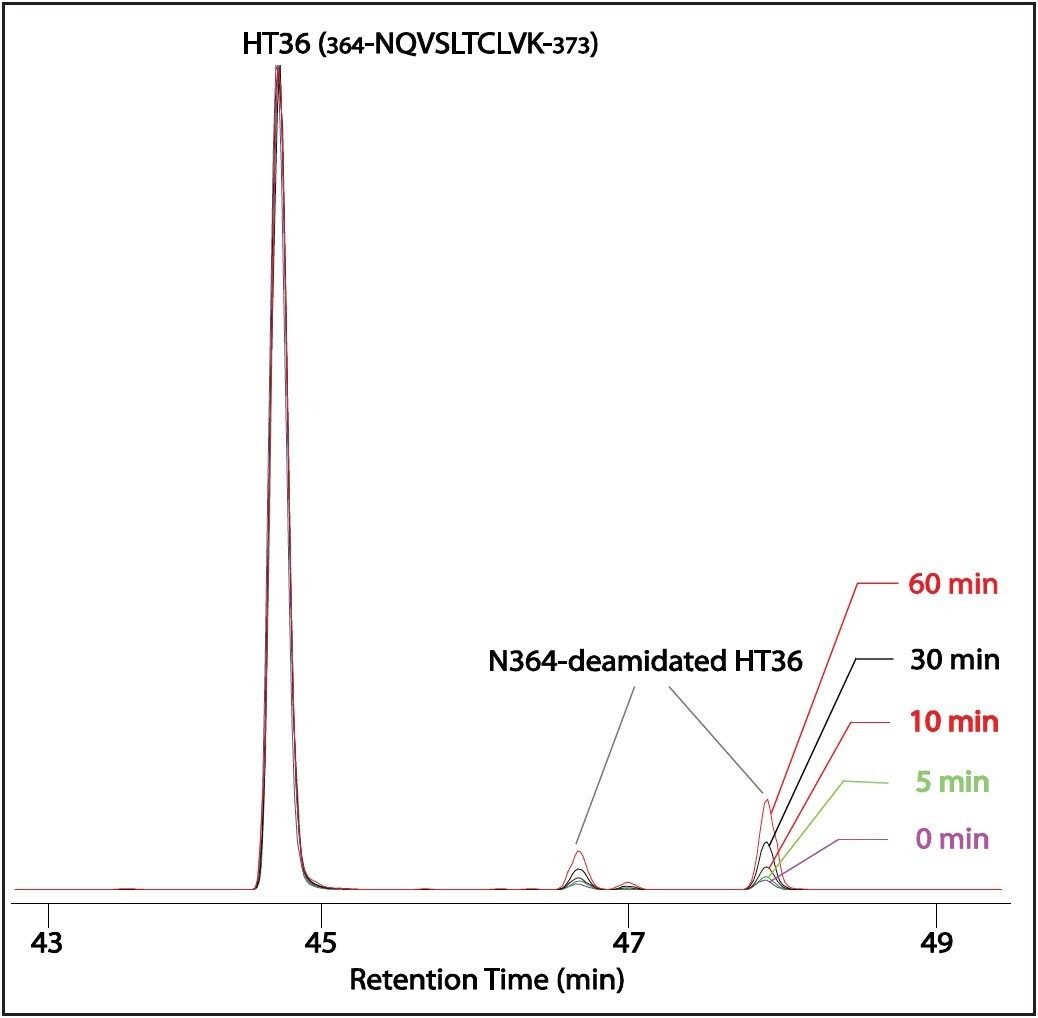
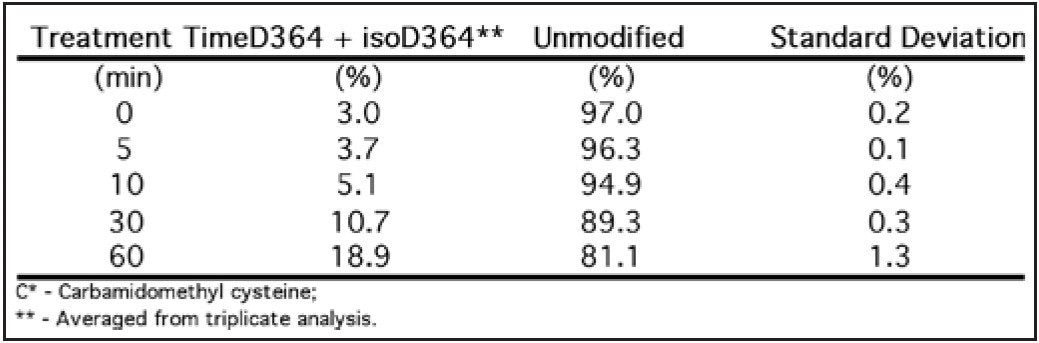
The detailed tryptic digestion procedure has been described previously.2 Briefly: at presence of 0.05% RapiGest SF, the mAb was digested with trypsin for 4 hours after reduction with dithiothereitol and alkylation with iodoacetamide. The pH of the resulting digest was then adjusted to ~ 9 with 1 M NH4OH. Aliquots of the alkalized digest were incubated at elevated temperature (60 °C) for 0, 5, 10, 30, and 60 min, respectively. Following incubation, each aliquot was diluted (to 1.5 pmol/μL) with 0.1% formic acid (FA) in 5% acetonitrile, and analyzed by LC-MSE peptide mapping experiment.

LC-MSE studies were performed using a Xevo QTof MS System coupled with an on-line ACQUITY UPLC System. It was configured with a 1.7-μm Peptide Separation Technology (PST) BEH300 C18 Column, 2.1 x 150 mm. Peptides were eluted with a 90-min gradient (1 to 40% acetonitrile in 0.1% FA) at a flow rate of 0.2 mL/min and 60 °C column temperature.

MSE data were acquired at 1 Hz in ESI positive ion mode, with collision cell energy alternating between low energy (4 V) to collect peptide precursor (MS) data and elevated energy (ramping from 15 to 45 V) to obtain peptide fragmentation (MSE) data. A capillary voltage of 3.0 kV, source temperature of 105 °C, cone voltage of 25 V, and cone gas flow of 10 L/h were maintained during the analyses. Sampling of the LockSpray channel (100 fM GFP in 50:50 acetonitrile/water containing 0.1% FA) was performed every 1 min to ensure mass accuracy. The analyses were completed in triplicate.

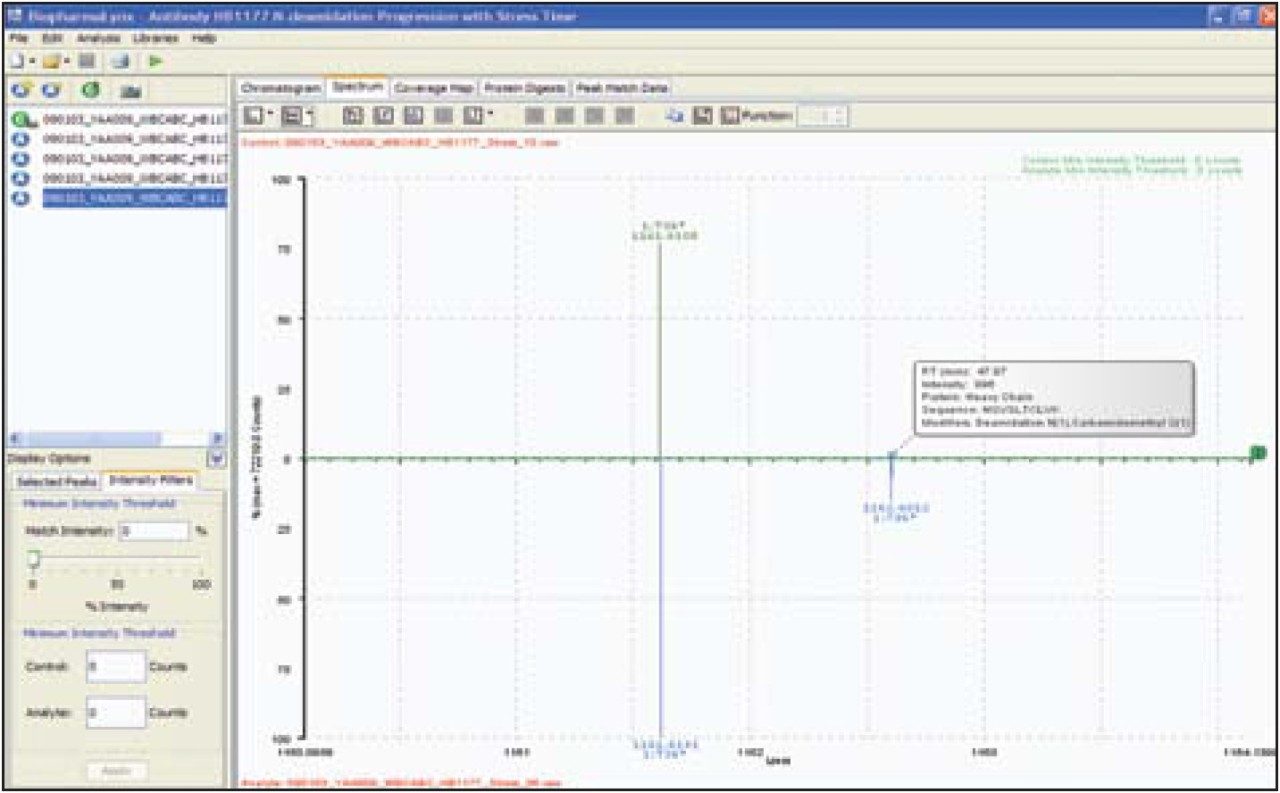
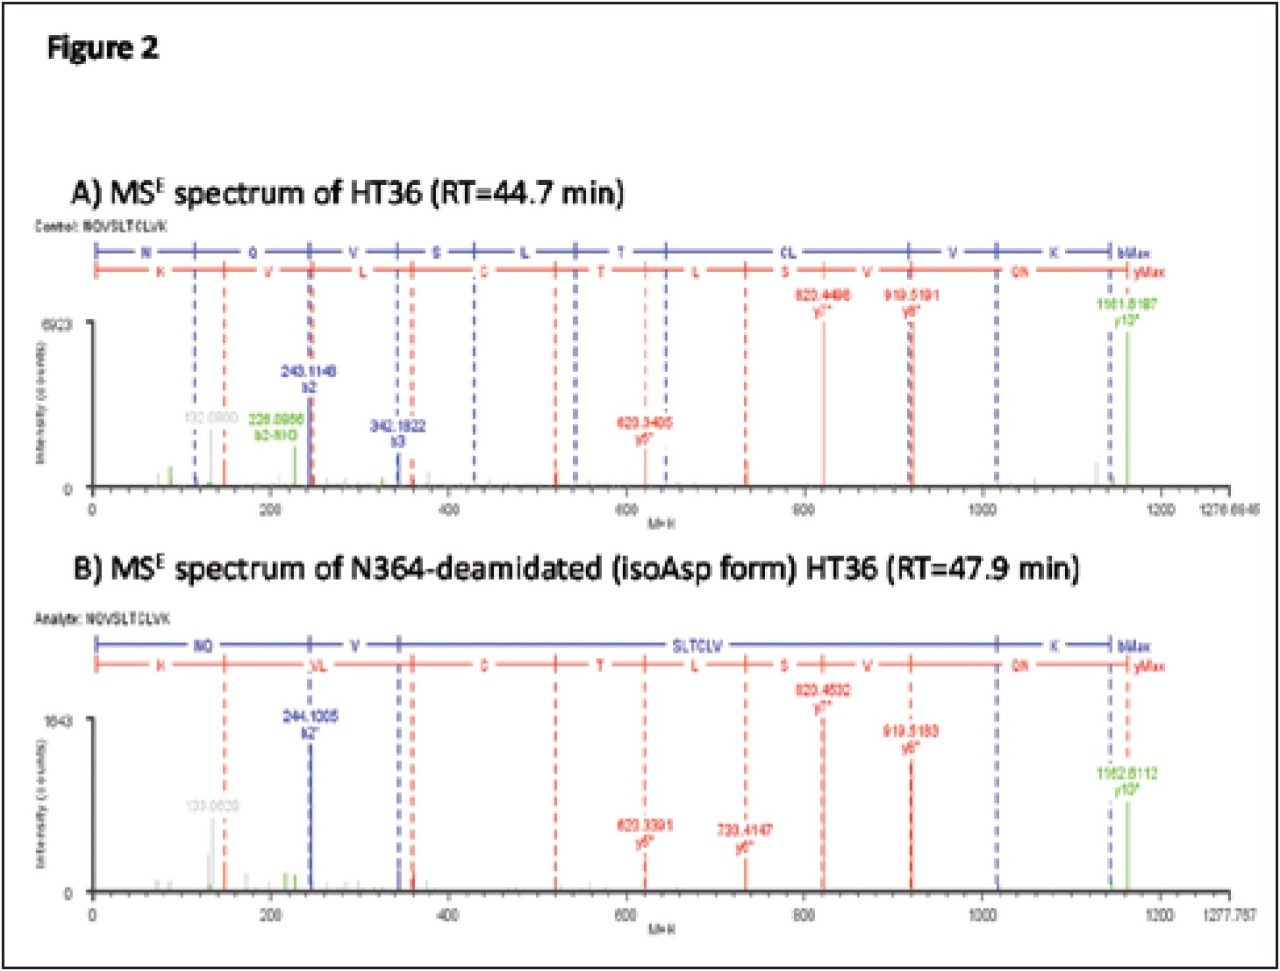
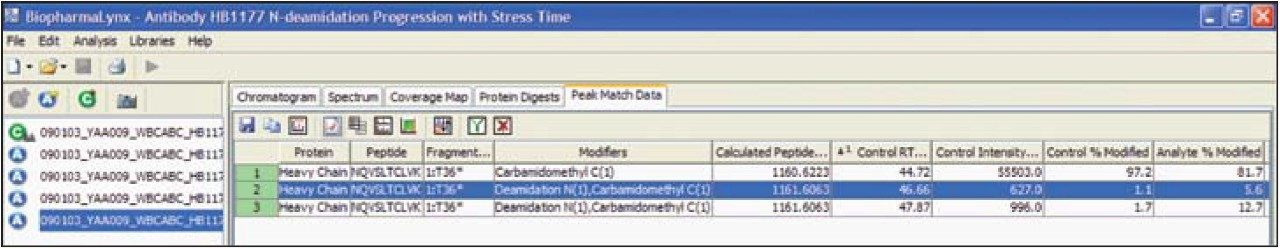
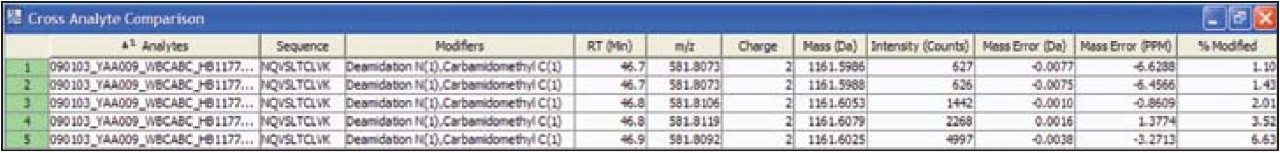
Peptide mapping data were batch-processed by BiopharmaLynx 1.2, an application manager for MassLynx Software, using traditional tryptic cleavage rules and setting cysteine carbamidomethylation as a fixed modification and N-deamidation as a variable modification. Additional BiopharmaLynx method parameter settings were detailed in a previous publication.3 Identifications of N-deamidated peptides were confirmed using the MSE fragmentation data that also enabled the peptide deamidation sites to be determined. The concentration of deamidations was calculated using reliably measured MS signal intensities.

Results and Discussion

BiopharmaLynx processing of the UPLC-MSE data acquired from the accelerated mAb degradation study identified 13 N-deamidation sites located within 10 tryptic peptides. Among them, three -NG- sequence motifs were observed to be hypersensitive to deamidation, with nearly 100% conversion following 10 min treatment. In contrast, two sites with a -NX- motif, where X is an aromatic amino acid, showed slow deamidation (< 10% even after 60 min treatment). Intermediate deamidation sensitivity was observed for the other detected sequence motifs (-NT- (2), -NN- (2), -NQ-, -NA-, -NH- and -NS-). These results are consistent with previous published studies.4

We choose a tryptic peptide NQVSLTCLVK (annotated as heavy chain tryptic peptide or HT36) with intermediate sensitivity to deamidation as an example to demonstrate the application of BiopharmaLynx 1.2 for monitoring peptide deamidation progression.

Figure 1 contains a comparison of HT36 between two digests subjected to 0 (top panel) or 60 (bottom panel) minutes of the stress condition. The major and minor peaks represent the processed (deisotoped, charge-reduced, and centroided) mass and intensities of tryptic peptide HT36 before (1161.62 Da) and after (1162.60 Da) deamidation. The MS intensity of deamidated HT36 peptide is about 500 times higher in the 60 min treatment condition than in the control digest. This graphical view readily provides information on:

  • The identification of the peptide and its deamidated form
  • The relative amount of deamidated peptide in each digest
  • The different levels of deamidation in the two samples.
Figure 1. Comparative processed spectra display for HT36 and N364 deamidated HT36 from an antibody digest exposed to 0 (top) and 60 min (bottom) of incubation under stress (60 °C and pH ~ 9).

MSE spectra of the unmodified and deamidated peptides (Figure 2) confirm the proper assignment of the ions by BiopharmaLynx. The 1 Da mass difference observed for the y10 and b-series ions in the MSE spectra, before and after N-deamidation, allows unambiguous determination of the modified asparagine. By clicking on each sample listed in the left panel of BiopharmaLynx, comparable information can be generated for each sample compared to the control digest.

Figure 2. MSE spectra confirmation for peptide HT36 and its N364-deamidated variant.

BiopharmaLynx can also present a tabular view to display the identified HT36-related peptides. Figure 3 tabulates the identification of alkylated HT36 peptide (RT 44.72 min) and two deamidated products (RT 46.66 and 47.87 min, representing two isoforms of N-deamidation – isoD and D, respectively). An additional peak at 47.0 min was also observed for the 60 min treated digest (data not shown) showing 1-Da mass increase compared to unmodified HT36, and was due to deamidation of the glutamine adjacent to the N-terminal asparagine. At shorter treatment time, the Q-deamidation species was below the limit of MS detection.

Figure 3. Comparative tabular view of peptide HT36 and its deamidated products from the 0 min (control) and 60 min (analyte) stress samples.

A Cross Analyte Comparison Table (available by clicking on each tabular identification in BiopharmaLynx) is available to track the absolute (in Counts) and relative (in percent of Total Counts) amounts across the samples collected from the whole stability study. For example, the Cross Analyte Comparison Table for the N-deamidated HT36 eluting at 46.66 min is shown in Figure 4. This identification and quantification was fully consistent with the results from manually obtained extracted ion chromatograms (Figure 5).

Figure 4. Cross Analyte Comparison Table for N364-deamidated HT36 showing increasing deamidation in response to increasing exposure to the stress condition.
Figure 5. Extracted ion chromatograms (XIC) of peptide HT36 and deamidated products for samples from 0 to 60 min of stress.

By combining BiopharmaLynx results for the unmodified HT36 peptide and both deamidated products from triplicate injections of each treatment condition, we determined the profile of N-deamination across the treatment time course (Table 1). Using BiopharmaLynx, these results were generated in minutes after the data were acquired.

Table 1. Summary of HT36 (364 NQVSLTC*LVK-373) N364-deamidation from increasing exposure to the stress condition.

Conclusion

UPLC-MSE analysis has been shown as a sensitive and effective approach for detection and characterization of protein modifications on therapeutic proteins, including challenging modifications such as deamidation. The desire to detect low levels of multiple deamidated peptides differing by only one Dalton requires the combination of superior chromatography, sensitive and accurate mass spectrometry, and informatics capable of properly interpreting the resulting complex data. The workflow combination of UPLC, PST column chemistry, Xevo QTof, and BiopharmaLynx 1.2 has been shown to excel for this task.

Data analysis has typically been the limiting factor in these studies, and the addition of MSE fragmentation processing in BiopharmaLynx 1.2 has enabled the interpretation of such data with greater speed and confidence. Automated processing and analysis of the large volume of LC-MSE peptide mapping data using BiopharmaLynx enabled efficient identification of deamidated peptides, localization of individual deamidation sites, and monitoring of the extent of deamidation across this accelerated degradation study.

References

  1. Xie H W, Gilar M, Gebler JC. Analysis of Deamidation and Oxidation in Monoclonal Antibody using Peptide Mapping with UPLC-MSE. Waters Application Note. 2009: 720002897en.
  2. Xie H, Gilar M, Gebler JC. Characterization of protein impurities and sitespecific modifications using peptide mapping with liquid chromatography and data independent acquisition mass spectrometry. Anal Chem. 2009 Jul 15;81(14):5699–708.
  3. Ahn J, Gillece-Castro B, Berger S. BiopharmaLynx: A New Bioinformatics Tool for Automated LC-MS Peptide Mapping Assignment. Waters Application Note. 2008: 720002754en.
  4. Robinson NE, and Robinson AB. Molecular Clocks: Deamidation of Asparaginyl and Glutaminyl Residues in Peptides and Proteins. Athouse Press: Cave Junction, OR, 2004.

720003168, August 2009

맨 위로 돌아가기 맨 위로 돌아가기