• 응용 자료

The Measurement Of Plasma Free Metanephrines Using Automated On-Line SPE HPLC-Tandem Mass Spectrometry

The Measurement Of Plasma Free Metanephrines Using Automated On-Line SPE HPLC-Tandem Mass Spectrometry

  • Kendon S. Graham
  • Jan v. d. Molen
  • Gerrie Stob
  • Donald P. Cooper
  • Michael Morris
  • Brian Keevil
  • Ido Kema
  • Waters Corporation
  • University Medical Center Groningen
  • Wythenshawe Hospital

For research use only. Not for use in diagnostic procedures.

Abstract

This application note demonstrates the use of the Spark Holland Symbiosis Pharma System in conjunction with a Waters Quattro micro to provide a completely automated on-line solid-phase extraction–liquid chromatography–tandem mass spectrometry (XLC-MS/MS) method for the determination of metanephrine (M) and normetanephrine (NM) in plasma for the diagnosis of pheochromocytoma. 

Introduction

Pheochromocytoma is a rare, catecholamine-producing tumour of the adrenal medulla1 and its presence must be considered in many patients with hypertension, the latter representing a quarter of the adult population in Western countries.2 The clinical hallmark is sustained or intermittent hypertension often associated with paroxysmal symptoms. Pheochromocytoma should also be considered if a patient presents with labile hypertension that is resistant to anti-hypertensive therapies.4

Many analytes in the catecholamine metabolic pathway have been used to assess the presence of pheochromocytoma in a variety of biological fluids,3 although the diagnosis of pheochromocytoma depends crucially on the demonstration of excess catecholamine production. This step is problematic with respect to false-negative/positive results due the inadequate specificity and sensitivity of the various biochemical tests.5

A number of recent studies have demonstrated the higher diagnostic efficacy of plasma free metanephrines (PFM).2,5-9 The majority of PFM assays are performed with HPLC using electrochemical detection (HPLC-ECD) that are generally labour-intensive and time-consuming with long run times. Co-eluting interferences from co-prescribed medications are also known to complicate data interpretation.

Enzymatic immunoassays also suffer from interferences and are susceptible to artifacts caused by non-specific binding as well as cross-reactivity. Gas chromatography – mass spectrometry methods address many of these shortcomings however, arduous sample preparation coupled with poor sensitivity means that there still remains a need for an alternative method of analysis.

A liquid chromatography – tandem mass spectrometry method using off-line solid-phase extraction has been published.10 This method uses relatively large volumes of plasma and a labour-intensive, relatively non-selective sample preparation protocol.

The work presented here describes the use of the Spark Holland Symbiosis Pharma System in conjunction with a Waters Quattro micro to provide a completely automated on-line solid-phase extraction–liquid chromatography–tandem mass spectrometry (XLC-MS/MS) method for the determination of metanephrine (M) and normetanephrine (NM) in plasma for the diagnosis of pheochromocytoma. 

The Spark Holland Symbiosis Pharma On-Line Solid-phase Extraction System.
The Quattro micro Tandem MS System.

Experimental

Patient Samples

Plasma samples from 6 healthy volunteers were provided by Medeval Laboratories (Manchester, UK). These samples were used to assess the performance characteristics of the assay and to prepare calibrators. A further 102 plasma samples were used in the preliminary investigation of reference ranges for M and NM. These were collected from patients assumed to be healthy and were provided by UMC Groningen (Groningen, The Netherlands).

Standards, Calibrators & QCs

M and NM were purchased from Sigma Aldrich Ltd (Poole, UK) as D,L-metanephrine.HCl and D,L-normetanephrine.HCl. The deuterated internal standards α,α,β-d3-metanephrine.HCl and α,α,β-d3-normetanephrine.HCl were purchased from Cambridge Isotopes Inc. (Andover, MA, USA) and Medical Isotopes Inc. (Pelham, NH, USA), respectively. Calibrators were prepared by spiking 1 mL plasma samples with M and NM (10 μL) made up in 0.1M HCl prior to thorough mixing. QC samples were prepared in a similar manner using stock solutions of M and NM that were independent of the those used to prepare the calibrators.

Mass Spectrometry

A Quattro micro Tandem Mass Spectrometer with a ZSpray ion source was used for all analyses (Waters Corporation, Manchester, UK). This instrument was operated in positive ionisation mode and was coupled directly to a Symbiosis Pharma (Spark Holland, Emmen, The Netherlands) on-line solid-phase extraction–liquid chromatography system. MS System control and data acquisition was performed using MassLynx v4.0 Software with automated data processing by the QuanLynx Application Manager. Control of the Symbiosis System was performed using SparkLink v3.0 Software.

In positive ionisation mode, M and NM are protonated to produce ions of the form [M+H]+ of m/z 198 and m/z 184, respectively. These ions are known to undergo a facile loss of water10 and the ion source conditions were optimised for these resulting ions (M = m/z 180; NM = m/z 166) of the form [M+H-H2O]+. Upon collision induced dissociation (CID), these precursor ions produced characteristic product ions of m/z 148 and m/z 134 for M and NM, respectively (Figure 1). Using the information from these experiments, the MS method shown in table 1 was used to monitor M, NM & their deuterated analogues in MRM mode using a dwell time of 0.07 seconds.

MS Conditions

Instrument:

Quattro micro

Polarity & Ion mode:

ESI+

Capillary:

0.8kV

Source temp:

140 °C

Desolvation temp:

450 °C

Desolvation gas:

1000 L/hr

Cone gas:

50 L/hr

Data collection:

ESI+ MRM

Dwell time:

70 ms

Inter scan delay:

20 ms

Inter channel delay:

20 ms

MRM Transitions

The MRM transitions with associated cone voltages and collision energies for each of the analytes and their deuterated internal standards are shown in Table 1.

On-line Solid-phase Extraction

Sample volume:

40 μL (1:1 dilution of plasma with aqueous IS solution)

Cartridge:

10 mm x 1 mm Oasis WCX

Solvation:

1 mL Acetonitrile 5 mL/min

Equilibration:

1 mL Water 5 mL/min

Sample loading:

1 mL Water 2 mL/min

Wash 1:

1 mL Water 5 mL/min

Wash 2:

1 mL Acetonitrile 5 mL/min

Elution duration:

2 minutes with LC mobile phase

Extraction time:

2 minutes 55 seconds including valve wash

Total cycle time:

7 min 40 seconds per sample

LC Conditions

Column

2.1 mm x 50 mm HILIC; 3 μm

Mobile phase A:

Acetonitrile

Mobile phase B:

100 mM Ammonium Formate @ pH 3

Gradient

Time(m:ss)

Flow(mL/min)

%A

%B

0:00

0.3

95

5

0:05

0.3

95

5

4:10

0.3

80

20

4:40

0.3

80

20

4:41

0.3

95

5

7:15

0.3

95

5

Results and Discussion

Figure 2 shows the MRM chromatogram resulting from the injection of a raw plasma sample containing 0.16 nmol/L M and 0.38 nmol/L NM. The expanded region of the baseline is shown in order to estimate the signal-to-noise ratios of the responses for M and NM. The retention provided by HILIC chemistry is far greater than a reverse-phase chemistry allowing the analytes of interest to elute away from any matrix-borne interferences that might result if elution was close to the void volume.

Figure 2. The MRM chromatograms for a plasma sample containing 0.16 nmol/L M (bottom right) and 0.38 nmol/L NM (bottom left).

The lower limits of quantification (signal-to-noise ≥10 ) for M and NM were calculated by extrapolation of signal-to-noise measurements and found to be 0.04 nmol/L and 0.16 nmol/L, respectively. Using the Automatic Method Development (AMD) function of the Symbiosis Pharma System, recoveries for both M and NM from plasma samples were found to be >90%. Carryover was assessed by spiking a plasma sample with the deuterated internal standards and measuring any response seen from the injection of a non-spiked plasma sample in the appropriate MRM channels. No appreciable carryover was observed.

Calibration lines for M and NM are shown in Figure 3. These were found to be linear up to approximately 25 nmol/L for each analyte with r2 >0.999 using an internal calibration and 1/x weighting.

Figure 3. The calibration lines for M and NM showing linearity of response to approx. 25 nmol/L (r>0.999)

Intra-assay precision was calculated using QC samples at three levels as described in Table 2. Intra-assay precision was found be <6% at all levels. Inter-assay precision was determined using the same QC samples in 10 separate assays over 8 consecutive working days and found to be ≤15% for both analytes. Results for plasma samples obtained from 6 ‘normal’ patients were also used to assess the precision of the assay over seven separate assays (Table 3). The assays (n=7) were carried out using several different sets of calibrators prepared from different stock solutions of M and NM to represent variations that might occur on a day-to-day basis in a routine laboratory. All results fall within previously specified reference ranges10 for M and NM with CV ≤15%.

Provisional estimation of suitable reference intervals for M and NM in the plasma of healthy patients was provided by the analysis of 102 patient plasma samples that were collected at random. These patient samples were analysed in a single run that comprised of a calibration series followed by single QCs placed at intervals of every ten patient samples. The total analysis time for all of these samples was less than 15 hours and the data processing time was negligible.

The reference intervals were calculated using the mean concentrations of M and NM in the 102 patient samples ±2 standard deviations (Figure 4). Using this small dataset, reference intervals for M and NM can be estimated by 0.02–0.31 nmol/L and 0.16–1.16 nmol/L, respectively.

Figure 4. The run plots for a) metanephrine and b) normetanephrine concentrations in a batch of 102 plasma samples from patients assumed to be healthy. Estimated reference intervals are shown by lines corresponding to Mean ±2 SD.

In addition to the run plots shown in Figure 4, further statistical analyses were carried out on these data to generate histograms, lag-time plots and normal probability plots for M and NM (Figure 5).

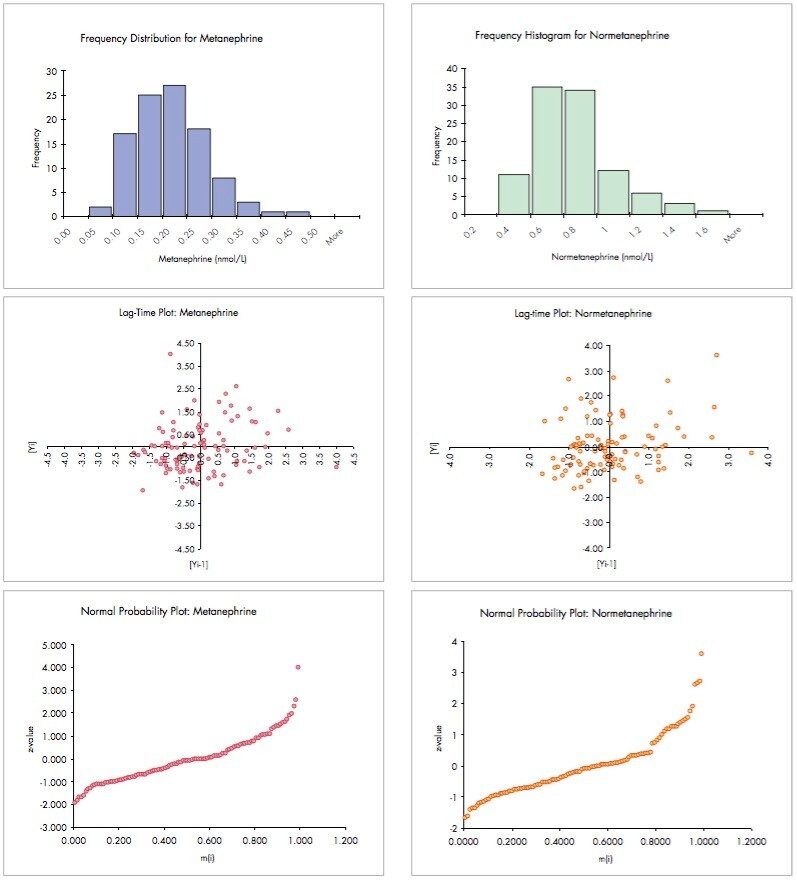
The frequency histograms for both M and NM show the expected non-gaussian distribution of levels in this group of patients. This phenomenon is more clearly demonstrated in the normal probability plots for these analytes – normal, gaussian distributions would have symmetrical frequency histograms and approximately linear normal probability plots.

A lag-time plot is intended to verify whether a data set or time series is random or not. If data appear to have no detectable pattern in a lag-time plot, as shown above, they may be regarded as being random. Detectable patterns in lag-time plots, such as rings, may indicate sinusoidal variation or a drifting of results during an analysis that warants further investigation.

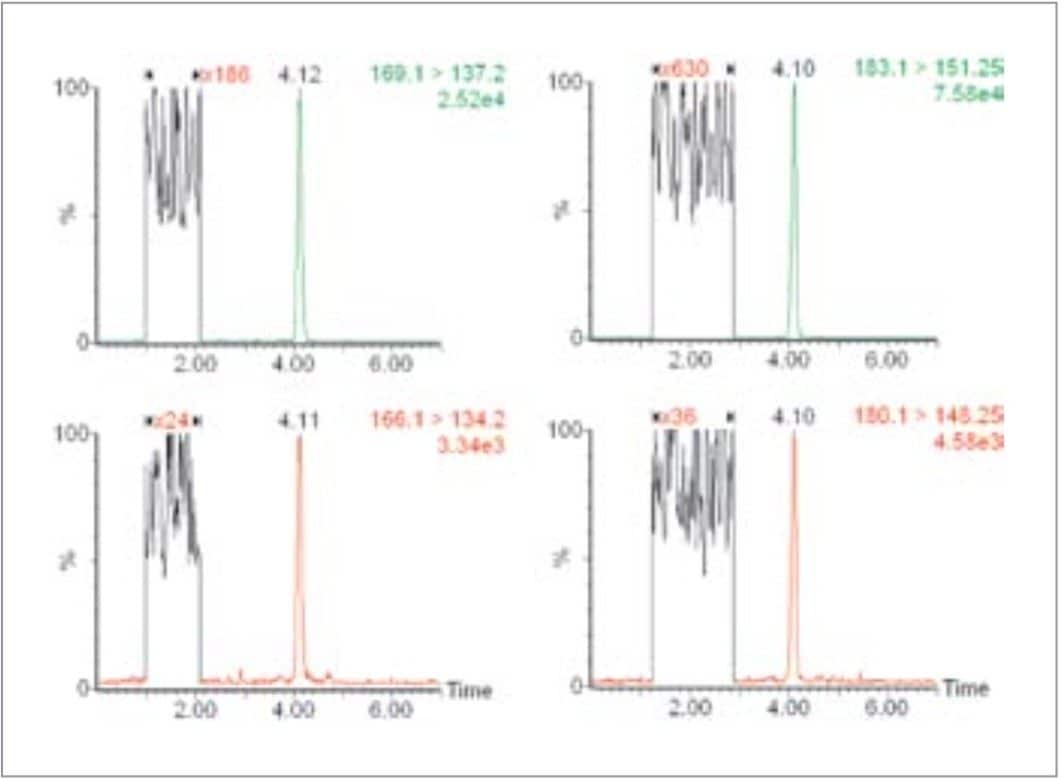
The use of on-line solid phase extraction technology coupled to LC-MS/MS has been shown to provide a plasma free metanephrines assay with improved sensitivity, selectivity and vastly reduced sample handling. Simple dilution of plasma samples with water containing deuterated internal standards followed by centrifugation can now be used to replace tedious off-line extraction methods.

A highly-selective extraction process is achieved using weak cation exchange (WCX) media. Traditionally, strong bases are extracted using strong cation exchange (SCX) media where the base must be eluted via neutralization. In the case of quarternary amines, this is often not possible and, more commonly, the stabilities of the basic analytes are compromised. Using Oasis WCX cartridge, strong bases bind to the carboxyl ion-exchanger at pH >5 permitting the cartridge to be washed with water and 100% acetonitrile without elution of the analytes of interest. Elution of the cartridge is then carried using the acidic mobile phase used in the chromatographic method and passed directly to the analytical column. The ability to wash the Oasis WCX extraction cartridge with 100% organic solvent whilst maintaining retention of the analytes of interest allows known ion-suppressing and non-polar species such as phospholipids to be removed prior to chromatographic analysis. This leads to a significant reduction in the likelihood of interferences and matrixdependent effects upon the assay.

The use of HILIC chemistry for the analysis of polar bases provides LC-MS/MS assays with higher sensitivities than traditional reversed-phase methods when using electrospray ionisation. The analytes of interest elute in high concentrations (circa 75%) of organic solvent where the desolvation process is more efficient. Using reverse-phase stationary phases, the metanephrines exhibit exceptionally poor retention and require the use of mobile phases of near 100% aqueous content or MS-unfriendly buffers.

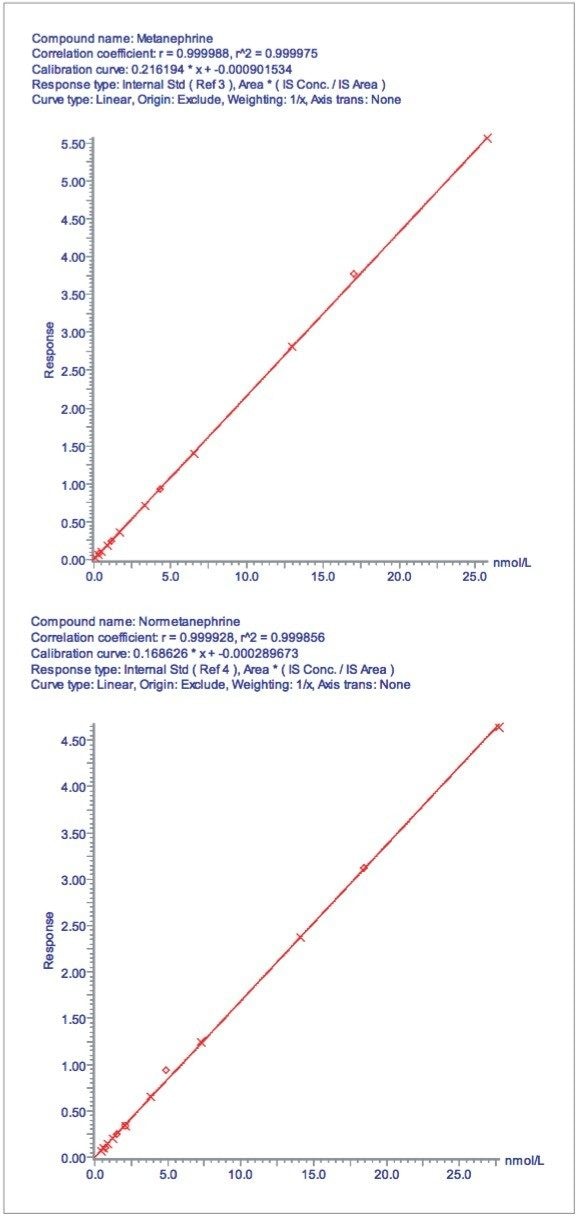
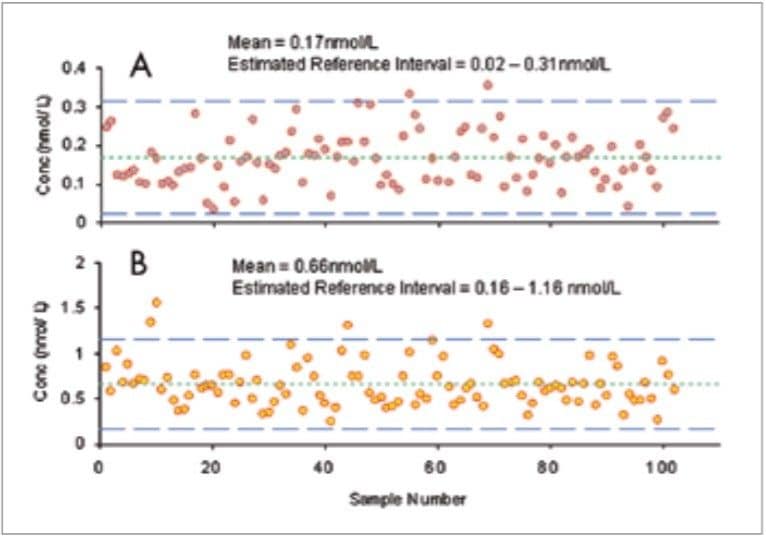
As a preliminary indication of the validity of the assay, the M and NM levels in the small group of patient samples (n=102) was used to calculate estimated reference intervals (Figure 4). These were found to be in close agreement with those in a previous study10 that suggests reference intervals of 0.05–0.47 nmol/L and 0.12–1.2 nmol/L for M and NM, respectively. Statistical treatment of these data has shown the data set to be random with a nongaussian distribution which is consistent with the expected results.

It should be noted that specimen collection strategies may have important consequences on the M and NM levels, particularly the position of the patient when blood samples are obtained. Since this information is not known for the samples used in this study, a more controlled study should be undertaken using a larger group of patients to provide reference intervals with greater credibility.

During the course of this study, heparinised and EDTA plasma samples were obtained from one patient to investigate the influence of two common anti-coagulants on M and NM results. No appreciable difference in the results was seen between the two samples when analyzed using this method. It is anticipated that the use of heparinised plasma sample may lead to sample stability issues owing to the formation of micro-clots in collected samples. Owing to the greater selectivity offered by XLC-MS/MS, the influence of sample matrix on the results should be reduced significantly.

Conclusion

The measurement of metanephrine and normetanephrine in raw human plasma with minimal sample pre-treatment using the Spark Holland Symbiosis Pharma and Waters Quattro micro Systems has been demonstrated. Considerable improvements in the sensitivity, selectivity and speed of the plasma free metanephrines assay have been provided when compared to previously published methods. The use of Oasis WCX extraction cartridges has been shown to provide a selective sample clean up for highly basic analytes in a complex matrix such as human plamsa. The combination of this selective clean up and Waters HILIC chemistry can provide a sensitive method of analysis for low levels of highly polar, basic analytes.

References

  1. Parmer RJ and Zinder O. “Catecholaminergic Pathways, Chromaffin Cells and Human Disease” Ann NY Acad Sci., 2002; 971: 497–505
  2. Lenders JWM, Pacak K, Walther MM, et al. “Biochemical Diagnosis of Pheochromocytoma: Which Test is Best?” JAMA 2002; 287: 1427–1434
  3. Peaston RT and Weinkove C. “Measurement of Catecholamines and their Metabolites” Ann Clin Biochem., 2004; 41: 17–38
  4. Young Jr WF. “Pheochromocytoma: 1926 -1993” Trends Endocrinol Metab 1993; 4: 122–127.
  5. Lenders JWM, Pacak K and Eisenhofer G. “New Advances in the Biochemical Diagnosis of Pheochromocytoma: Moving Beyond Catecholamines” Ann NY Acad Sci., 2002; 970: 29–40
  6. Kudva YC, Sawka AM and Young WF. “The Laboratory Diagnosis of Adrenal Pheochromocytoma: The Mayo Clinic Experience” J Clin Endocrinol Metab 2003; 88: 4533–4539.
  7. Raber W, Raffesberg W, Bischof M et al. ” Diagnostic Efficacy of Unconjugated Plasma Metanephrines for the Detection of Pheochromocytoma“ Arch Intern Med 2000; 160: 2957–2693
  8. Lenders JWM, Eisenhofer G, Armando I, Keiser HR, Goldstein DS, Kopin IJ. “Determination of Metanephrines in Plasma by LC-ECD” Clin Chem 1993; 39:97–103.
  9. Pallant A et al. “ Determination of Plasma Methoxyamines” Clin Chem Lab Med 2000; 38: 513–7
  10. Lagerstedt SA et al. “ Measurement of Plasma Free Metanephrine and Normetanephrine by LC-MS/MS for the Diagnosis of Pheochromocytoma” Clin Chem 2004; 50: 603–611

Featured Products

720001943, August 2007

맨 위로 돌아가기 맨 위로 돌아가기