• 응용 자료

A High Throughput UPLC-MS Method in Support of Cleaning Validation Studies

A High Throughput UPLC-MS Method in Support of Cleaning Validation Studies

  • Kenneth J. Fountain
  • Marleen van Wingerden
  • Diane M. Diehl
  • Waters Corporation
Woman working at drug factory, selection of pills on a production line

Abstract

This work highlights the use of UPLC-MS employing a short, 30 mm UPLC column along with a fast-scanning single quadrupole mass detector in order to support the cleaning validation procedures for eight APIs.

Introduction

During the manufacturing and packaging of active pharmaceutical ingredients (APIs), the removal of drug residues from the equipment is usually performed by a series of cleaning procedures. It is imperative that the production equipment used in this process be properly cleaned in order to avoid cross-contamination of drug products.1-3

The safety acceptance criteria for API residues vary with drug substance. More potent compounds will require a lower acceptance limit. In general, most processes aim to have a lower safety limit in the 10 ppb–1 ppm range (10 ng/mL–1 μg/mL). In order to achieve these limits, sensitive analytical techniques are required. 

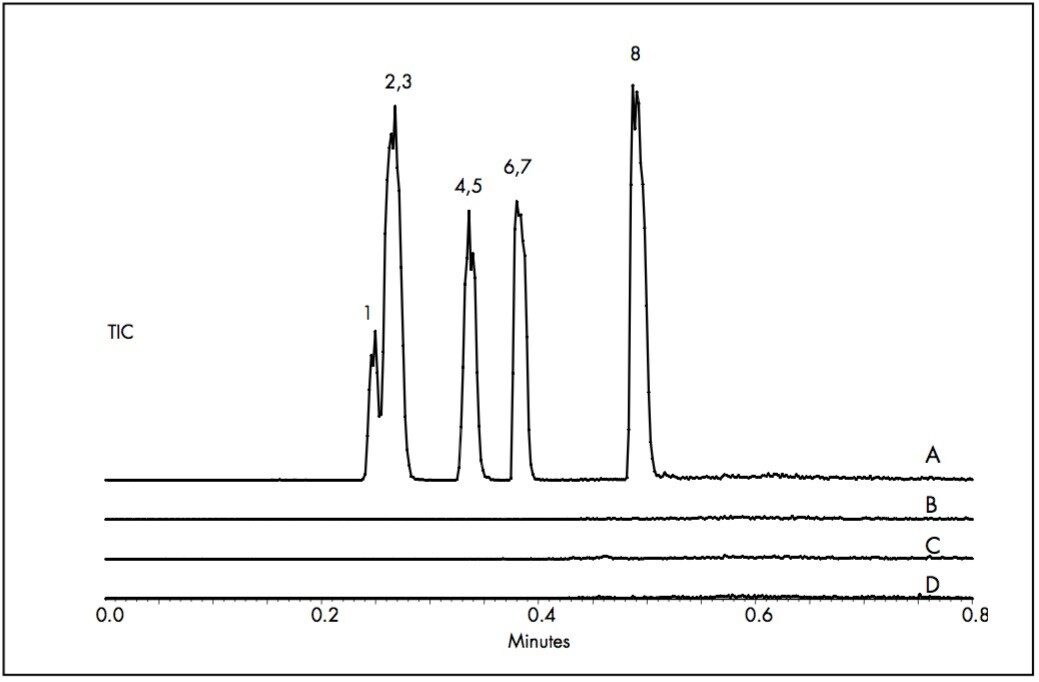
UltraPerformance Liquid Chromatography (UPLC Technology) in conjunction with ultra-violet (UV) detection can provide a high degree of assurance that the API residue is below the safety acceptance limit in a relatively short period of time (less than 5 minutes analysis time). In cases where UV is not sensitive enough, mass spectrometry (MS) is a useful addition for detecting low levels of residual drug substances.

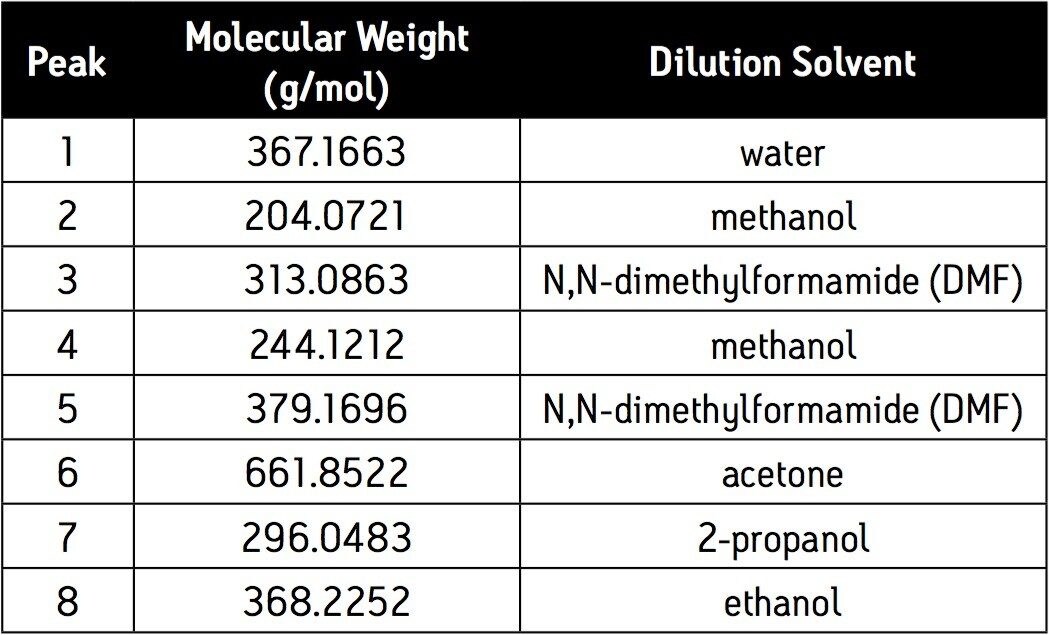
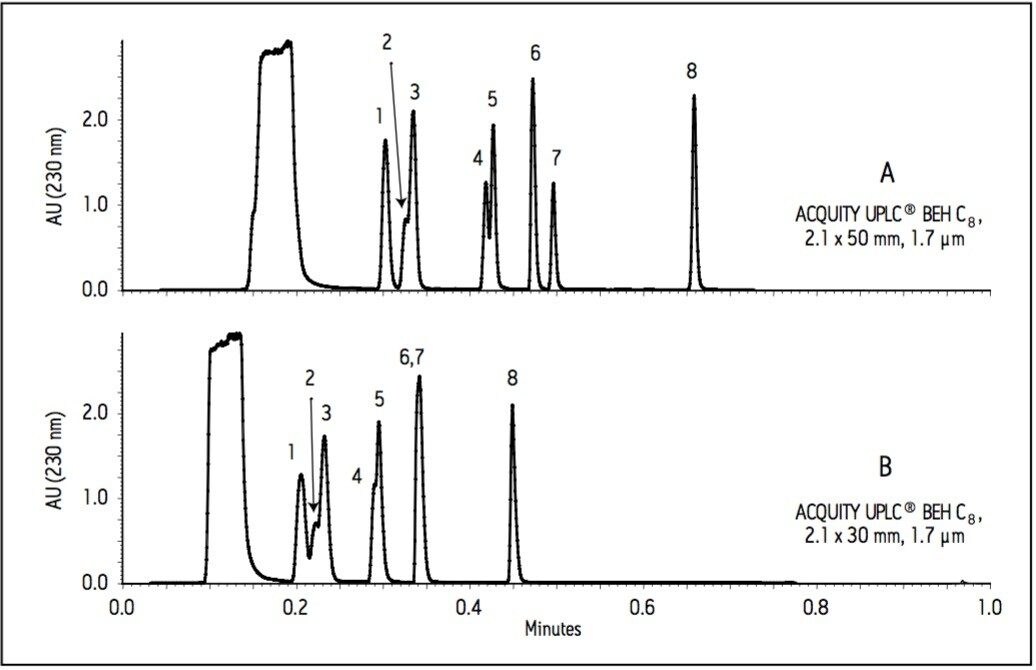
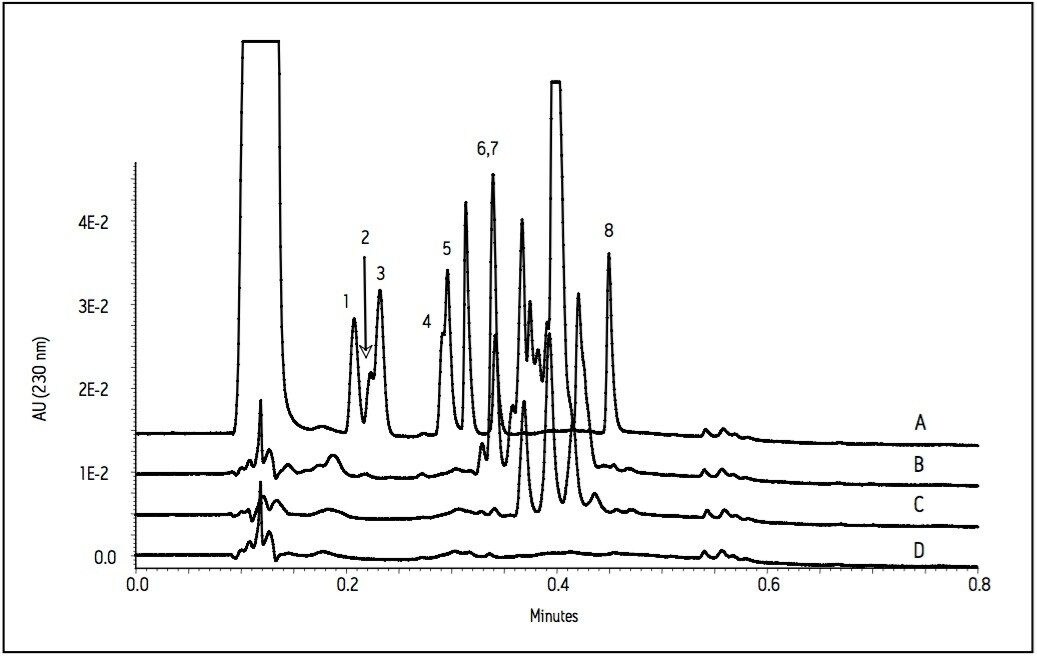
The current work highlights the use of UPLC-MS employing a short, 30 mm UPLC column along with a fast-scanning single quadrupole MS detector in order to support the cleaning validation procedures for eight APIs (Table 1). The customer desired a single UPLC analysis for all 8 compounds with a cycle time of less than 2 minutes. Previously, the customer had been using 8 different HPLC methods to measure drug residue levels after reactor vessel cleaning. This represents a significant reduction in quality control (QC) laboratory operating costs (i.e., less mobile phase preparation, less instrument down time), and an overall increase in productivity.

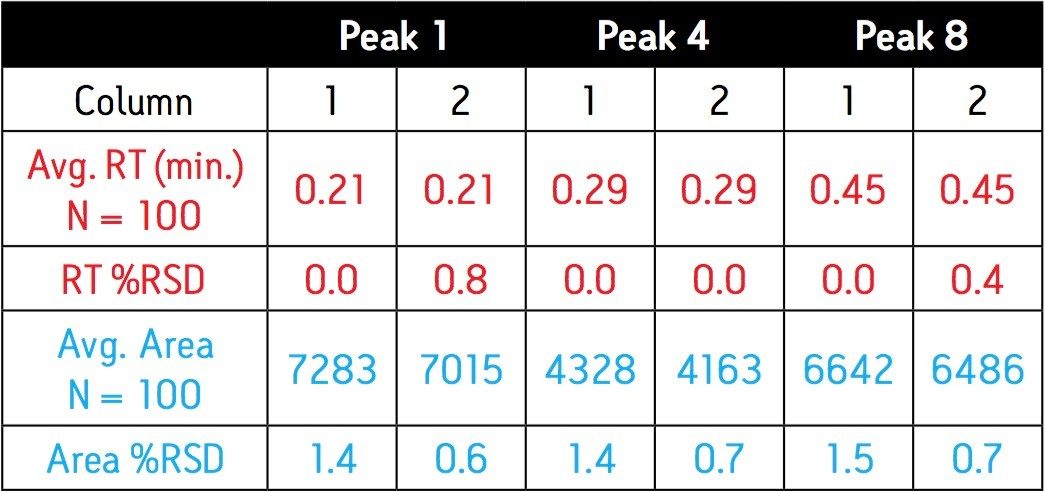
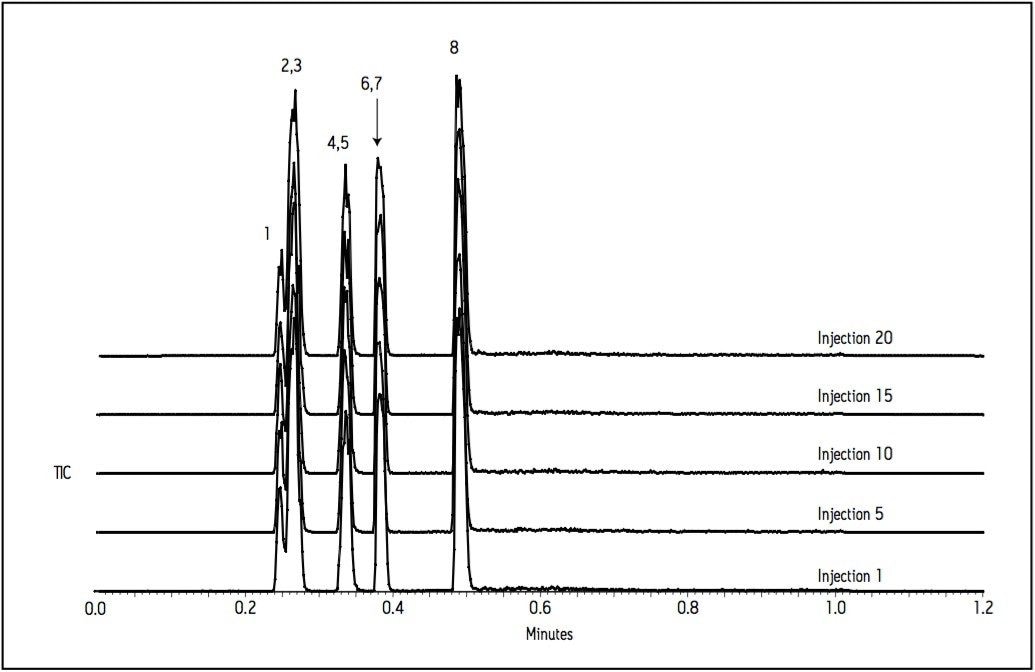
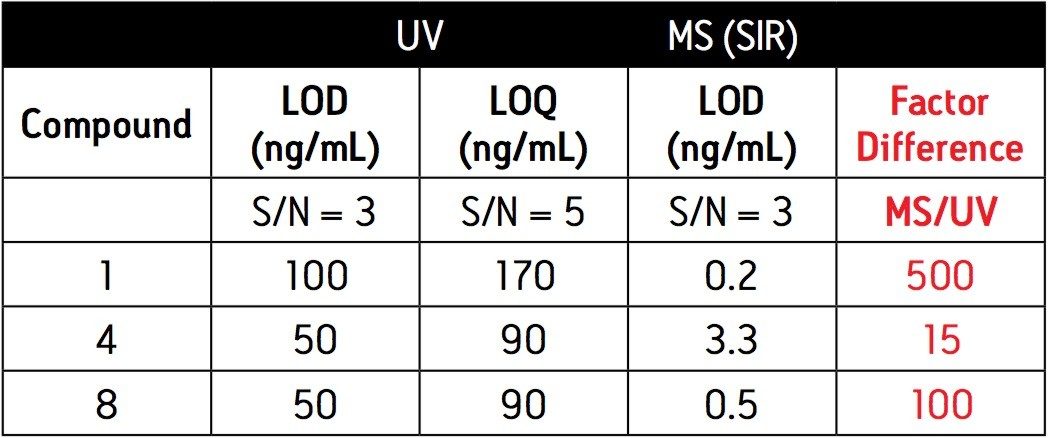
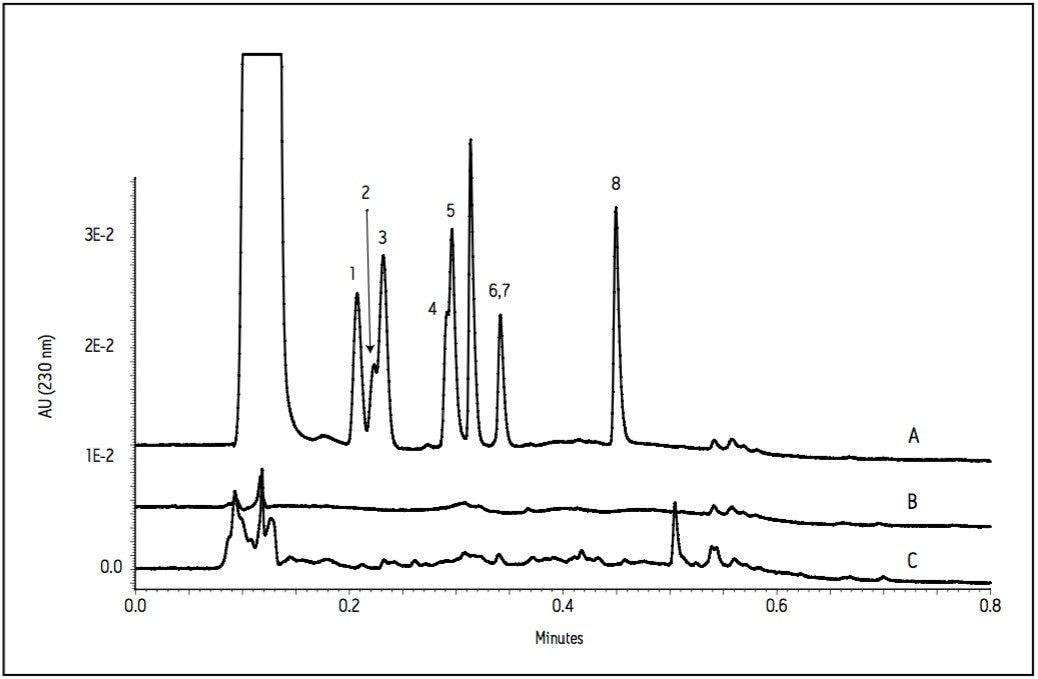
Since these APIs are synthesized individually, it is not necessary to resolve all compounds from each other in a single run. Repeatability in UV and MS must be determined, as well as the limit of detection (LOD) and limit of quantitation (LOQ). Finally, interferences from solvents and swabs used during cleaning of reactor vessels must be minimized in order to accurately measure API residue levels.

Selected compounds with molecular weight
Table 1. Selected compounds with molecular weight and dilution solvent. Compounds are listed in order of elution. 

Experimental

ACQUITY UPLC Conditions

System:

ACQUITY UPLC System with PDA detector

Column:

ACQUITY UPLC BEH C8 Column, 2.1 x 30 mm, 1.7 μm

Part Number:

186003910

Column temp.:

50 °C

Flow Rate:

0.8 mL/min

Mobile Phase A:

10 mM NH4HCO3, pH 10.0

Mobile Phase B:

Acetonitrile (ACN)

Gradient:

35-100 % B in 0.3 minutes

Injection Volume:

2 μL

Injection Mode:

Partial loop overfill (5 μL loop size)

Weak Wash Solvent:

95/5 (H2O/ACN)

Strong Wash Solvent:

10/90 (H2O/ACN)

MS Conditions

MS System:

ACQUITY SQ detector

Ionization Mode:

Electrospray positive

Capillary Voltage:

3500 V

Cone Voltage:

30 V

Desolvation temp.:

500 °C

Desolvation Gas:

800 L/Hr

Source temp.:

150 °C

Acquisition Range:

150–750 m/z

Scan Rates:

Full scan- 0.06 s scan, 0.05 s delay

SIR- 0.005 s dwell, 0.05 s delay

Results and Discussion

UPLC Separation

Initial screening of conditions for separation of the 8 compounds was performed on an ACQUITY UPLC BEH C18 Column (2.1 x 50 mm, 1.7 μm, p/n :186002350) at both pH 3.0 and pH 10.0. Results indicated that peak shapes were superior using pH 10 mobile phases (data not shown). However, due to the retention characteristics of these compounds at this pH, a less retentive phase (ACQUITY UPLC BEH C8 Column, 2.1 x 50 mm, 1.7 μm) and strong organic modifier (ACN) were chosen. The UPLC separation of the 8 compounds of interest can be seen in Figure 1. All compounds elute within the gradient window on the 50 mm, C8 Column (Fig. 1A). To further reduce run time, a 30 mm column was used, and the gradient scaled proportionally (Fig. 1B). As a result, a 40% reduction in run time was achieved, and all compounds were analyzed in less than 0.5 minutes. Mass spectrometry analysis using the SQ detector confirmed the elution order of the APIs without the need for individual injections.

Separation of 8 APIs
Figure 1. Separation of 8 APIs on a 50 mm (A) and a 30 mm (B) length column. The large peak in the void is due to the presence of 10 % DMF in the sample. Refer to Table 1 for peak identification. 

Method Repeatability

Repeatability of the UPLC separation for the 8 APIs was determined using a mixture of only 3 selected compounds, since baseline resolution of all 8 components was not achieved in the 0.3-minute separation window. Compounds 1 (most hydrophilic), 4, and 8 (most hydrophobic) were chosen due to their baseline resolution  from each other under the method conditions. To determine reproducibilityof the separation, a mixture containing 50 ppm (μg/mL) of each compound was injected 100 times. Statistics for repeatability of retention times and peak areas in UV (230 nm) were then calculated on two different 30 mm columns. Results from this experiment can be found in Table 2. Retention time RSD values for all three compounds are less than 1.0%, and area count (UV 230 nm) RSD values were less than 1.5%. Comparing column-tocolumn variability, no difference was seen in the average retention times of all 3 compounds. Area counts differed by less than 4%.

Repeatability of retention times and peak areas
Table 2. Repeatability of retention times and peak areas (UV 230 nm) using two different 30 mm length C8 columns. 

The MS response variability of the method was tested by 20 consecutive injections of a 1 μg/mL mixture of all 8 APIs. From Figure 2, it is clear that the MS signal is consistent in full scan mode.

 Reproducibility of MS response
Figure 2. Reproducibility of MS response for a 1 μg/mL mixture of 8 APIs. 

Linearity and LOD/LOQ

The responses of compounds 1 (λmax = 227 nm), 4 (λmax = 241 nm), and 8 (λmax = 250 nm) were tested for linearity using UV detection in the concentration range of 0.05–50 μg/mL. Correlation coefficients (R2) for all three calibration curves were greater than 0.9999 (data not shown). Calculated concentrations of all standards based on the calibration curves were within 10 % of the theoretical values.

Limits of detection and quantitation (LOD/LOQ) were calculated from the data obtained during the linearity experiments. For each of the three compounds, the signal-to-noise (S/N) ratio was determined for the two lowest standards (50 and 100 ng/mL). The LOD was defined as a signal having a S/N of 3, and the LOQ was defined as a signal having a S/N of 5.

For MS, the three-compound mixture was analyzed at concentrations of 1.0, 0.1, 0.01, and 0.001 μg/mL in single ion recording (SIR) mode. Again, the S/N ratio of each compound was determined at the two lowest levels. Table 3 summarizes the LOD/LOQ determinations using both UV and MS for the three compounds tested.

It is clear from these data that MS is capable of detecting much lower levels of API than UV. In the most dramatic case, a 500-fold difference in detection limit was observed. For quantitation purposes, the LOQ using UV is generally in the 100–200 ng/mL range, which is suitable for most pharmaceutical cleaning verification studies.

LOD/LOQ data
Table 3. LOD/LOQ data (UV and MS) for three selected compounds. 

Cleaning Solvent/Swab Extraction Interferences

After large-scale synthesis of a pharmaceutical compound is complete, the reactor vessel is then cleaned and a swab is used to wipe the vessel surface. The swab is then extracted, and the extract is analyzed for drug residue. This process is a critical step in verifying safety acceptance limits of cleaning procedures in the pharmaceutical manufacturing and packaging process.

Interferences eluting in the separation window can complicate accurate quantitation and identification of residual drug product after vessel cleaning. The current UPLC-MS method was evaluated for the presence of interferences originating from cleaning solvents and swab extractions in both UV and MS.

Figure 3 shows the UV traces for injection of the standard mixture (1 μg/mL) and three commercially available solvents. The technical grade ethanol has impurities that are detected in UV, but these contaminants do not elute at the same retention time as any of the 8 compounds of interest. MS analysis of these peaks revealed that they are related to contamination from polyethylene glycol (PEG). The technical grade methanol contains an impurity which co-elutes with peaks 6 and 7. HPLC grade methanol contains no impurities that are detected by UV. Figure 4 shows the same analysis with mass spectrometry detection. No interferences are observed in the total ion chromatogram (TIC) for any of the solvents analyzed. The results of this experiment demonstrate that solvent quality is crucial to accurate determination of API residues after reactor vessel cleaning. Further, the SQ detector can be used to identify contaminants found in common solvents for pharmaceutical compounds.

UV overlay
Figure 3. UV overlay of a 1 μg/mL standard compound mixture (A) with technical grade methanol (B), technical grade ethanol (C), and HPLC grade methanol (D). 
 Impact of cleaning solvents on MS response
Figure 4. Impact of cleaning solvents on MS response. 1 μg/mL standard compound mixture (A), technical grade methanol (B), technical grade ethanol (C), and HPLC grade methanol (D). 

Three types of swabs extracted with water, HPLC grade methanol, and DMF were evaluated for interferences in both UV and MS. Briefly, each swab was submerged in 20 mL of each of the three extraction solvents and allowed to sit at room temperature for 3 hours. 1 mL of each extraction was then filtered using a 0.2 μm GHP (hydrophilic polypropylene) syringe filter, and 2 μL was used for injection.

For both the water and methanol extractions, no UV interferences were observed in the elution window of interest (Fig. 5). Similarly, no interferences from the water- and methanol-extracted swabs were observed in MS when analyzing one of the APIs in SIR mode (data not shown).

 UV overlay
Figure 5. UV overlay of a 1 μg/mL standard mixture (A), Texwipe swab extracted with water (B), and Zelletten swab extracted with methanol (C). 

Swab extraction with DMF presents an additional challenge. Since DMF has strong absorption in UV, it completely masks the signal of low levels of APIs in the chromatogram (Fig. 6A). However, when analyzing the same extracts using the SQ detector, the interferences are eliminated, and accurate detection of API residues is possible in the ng/mL range (Fig. 6B).

Comparison of UV and MS responses for DMF-extracted samples
Figure 6. Comparison of UV and MS responses for DMF-extracted samples. (A) UV overlay of a 1 μg/mL standard mixture and DMF solvent; (B) SIR traces of compound 4 for a 1 μg/mL standard mixture and a Regal swab extracted with DMF. 

Conclusion

A single UPLC-MS method was developed in support of cleaning validation procedures for 8 APIs. Cycle time of the method is 1.2 minutes, which is suitable for high throughput analyses. The method is reproducible and linear over a concentration range of 0.05–50 μg/mL. Limits of detection were 50–100 ng/mL for UV and 0.2–4 ng/mL for MS in SIR mode. Minimal interferences were observed in UV or MS from HPLC grade solvents and swab extractions. In cases where UV detection does not allow for accurate determination of low levels of active pharmaceutical ingredients (i.e., swab extractions with DMF), mass spectrometry can be used as a more sensitive alternative.

This work demonstrates that UPLC-MS can significantly improve the efficiency and productivity of a pharmaceutical QC laboratory for cleaning verification studies. The method shown in this application has the ability to separate many compounds in less than 0.5 minutes, thereby increasing sample throughput and minimizing costs associated with mobile phase consumption and waste disposal. The presence of the SQ mass detector eliminates the error associated with peak identification, since the m/z value can be obtained for each peak eluting in the chromatogram.

References

  1. Guidance for Industry: Manufacturing, Processing, or Holding Active Pharmaceutical Ingredients, FDA Draft, March 1998.
  2. Cleaning Validation in Active Pharmaceutical Ingredient Manufacturing Plants, APIC, September 1999.
  3. Guidance on Aspects of Cleaning Validation in Active Pharmaceutical Ingredient Plants, APIC, December 2000.

720002171, June 2007

맨 위로 돌아가기 맨 위로 돌아가기