For research use only. Not for use in diagnostic procedures.
For research use only. Not for use in diagnostic procedures.
TG Rosano, JP Danaceau, M Wood, RM Konetchy Jr, SMT Islam, J M Rumberger
aNational Toxicology Center at Life Sciences Innovation Building, Albany, NY
bDepartment of Pathology and Laboratory Medicine at Albany Medical Center, Albany, NY
cWaters Corporation, Milford, United States
Published on April 27, 2026
For research use only. Not for use in diagnostic procedures.
Phase 2 drug metabolism, catalyzed by UDP-glucuronosyltransferase (UGT) isoforms, may contribute significantly to urinary elimination of many drugs and their Phase 1 metabolites. While direct testing for the glucuronidated metabolites is not routinely performed in definitive testing for large panels of drugs and metabolites (analytes), glucuronidase hydrolysis is widely used to test for combined free and glucuronidated forms. Drug-prevalence findings from definitive urine drug testing in 400 emergency department patients suspected of drug misuse was recently reported. A large panel of drugs and Phase 1 metabolites (analytes) were tested with use of a rapid glucuronidase hydrolysis and with identification of over 1500 drugs and metabolites. This current work, featuring the Xevo™ TQD Mass Spectrometer and UPLC I-Class Plus, expands upon those data and determines the contribution of hydrolysis to positive drug findings.
Drug testing by liquid chromatography–tandem mass spectrometry (LC–MS/MS) is widely used in clinical and forensic toxicology because of the technique’s analytical specificity, broad analyte coverage, and ability to detect both parent drugs and metabolites.1 Interpretation of urine drug results is complicated by extensive Phase II metabolism, particularly glucuronidation, which can account for the majority of urinary drug-related material for opioids, benzodiazepines, cannabinoids, antidepressants, and several other therapeutic or psychoactive drug classes.2-4 Analytical approaches that measure only the unconjugated (“free”) analyte may therefore underestimate total drug burden and risk clinically significant false-negative results.5,6
To mitigate this issue, laboratories often incorporate β-glucuronidase hydrolysis prior to LC–MS/MS analysis to cleave glucuronide conjugates and release the aglycone.7 However, hydrolysis efficiency varies greatly depending on the enzyme preparation, reaction conditions, and the structural characteristics of the glucuronide being analyzed. Traditional β-glucuronidase enzymes derived from Helix pomatia, Patella vulgata, or bacterial sources show substantial variability in substrate specificity and reaction kinetics.8,9 These limitations are especially pronounced for N-glucuronides, which are more resistant to enzymatic cleavage and may remain partially conjugated even under prolonged incubation.10 Inadequate hydrolysis of benzodiazepines, opioids, and psychoactive compounds has been shown to reduce detection sensitivity and contribute to false-negative results in clinical and forensic settings.11–13
The development of recombinant β-glucuronidase enzymes has addressed several limitations of traditional preparations. Glucuronidase variants produced by site-directed mutagenesis show increased hydrolytic activity, and formulations that incorporates multiple recombinant β-glucuronidase isoenzymes improve substrate coverage and hydrolysis efficiency across structurally diverse conjugates.14,15 Comparative studies show that recombinant enzyme blends provide more complete and consistent hydrolysis of both O- and N-glucuronides than many traditional enzyme sources.11 Despite these advances, relatively few investigations have assessed the clinical impact of hydrolysis on large, unselected patient populations. Most studies have evaluated hydrolysis performance using spiked matrices and analyte-focused method development. Consequently, the extent to which omission of hydrolysis affects detection rates, measured concentrations, and clinical interpretation in real-world patient care settings—such as emergency medicine—remains insufficiently characterized.
Findings from a definitive LC–MS/MS urine drug testing study involving 400 emergency department patients, illustrating the complexity of drug exposure patterns in acute care settings has been recently reported.16 The definitive drug testing method, as well as an isomer specific cannabinoid method were developed and validated using a Waters Xevo TQD Mass Spectrometer coupled to a Waters ACQUITY™ I-Class PLUS UHPLC System. In the present study, all specimens with and without recombinant enzymatic hydrolysis, were reanalyzed allowing direct comparison of total (post-hydrolysis).
The objective of this study was to determine the extent to which recombinant glucuronidase enzyme hydrolysis improves detection of drugs and metabolites in an emergency department patient setting, along with a characterization of analyte-specific and drug-class-specific patterns in glucuronide-dependent detection.
Definitive drug testing with and without β-glucuronidase hydrolysis was performed on urine samples obtained from 400 patients presenting to the Albany Medical Center Emergency Department. A study of drug prevalence, using only hydrolyzed urine samples from the patient cohort, has been previously reported.16 The study was reviewed and authorized by the Human Study Committee of the Albany Medical College.
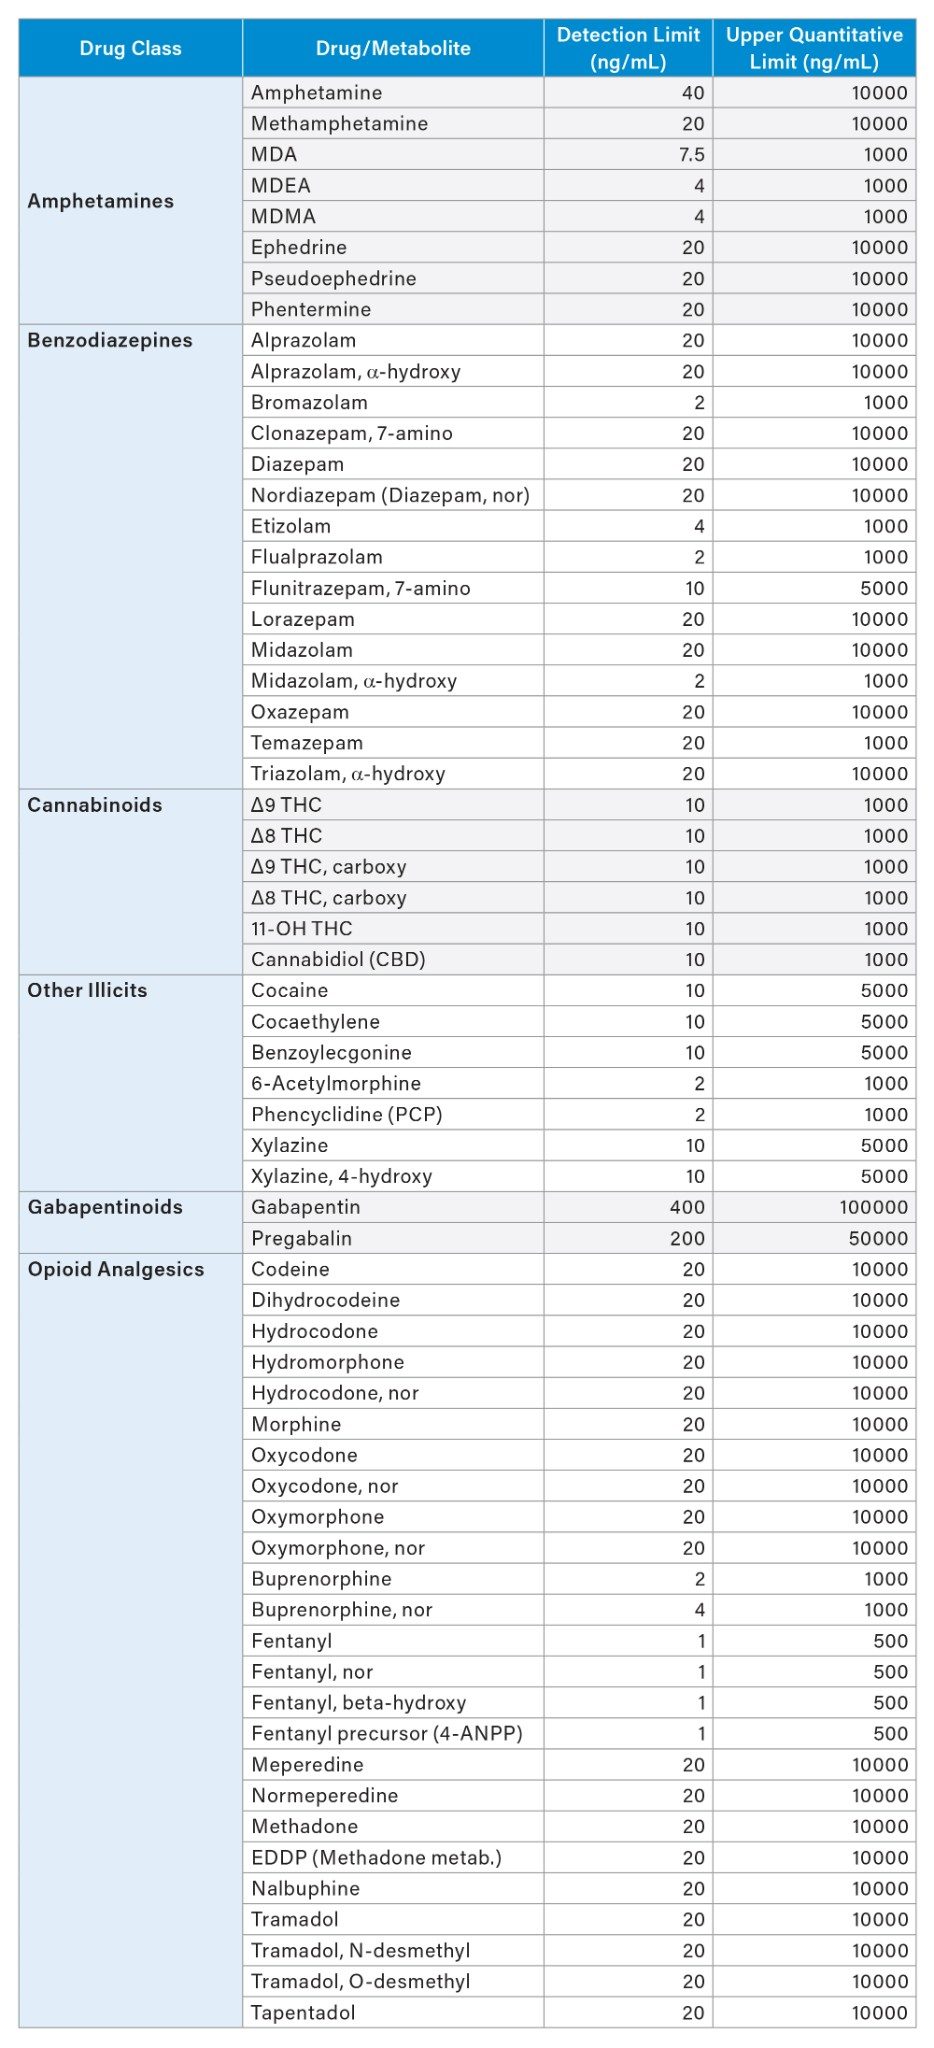
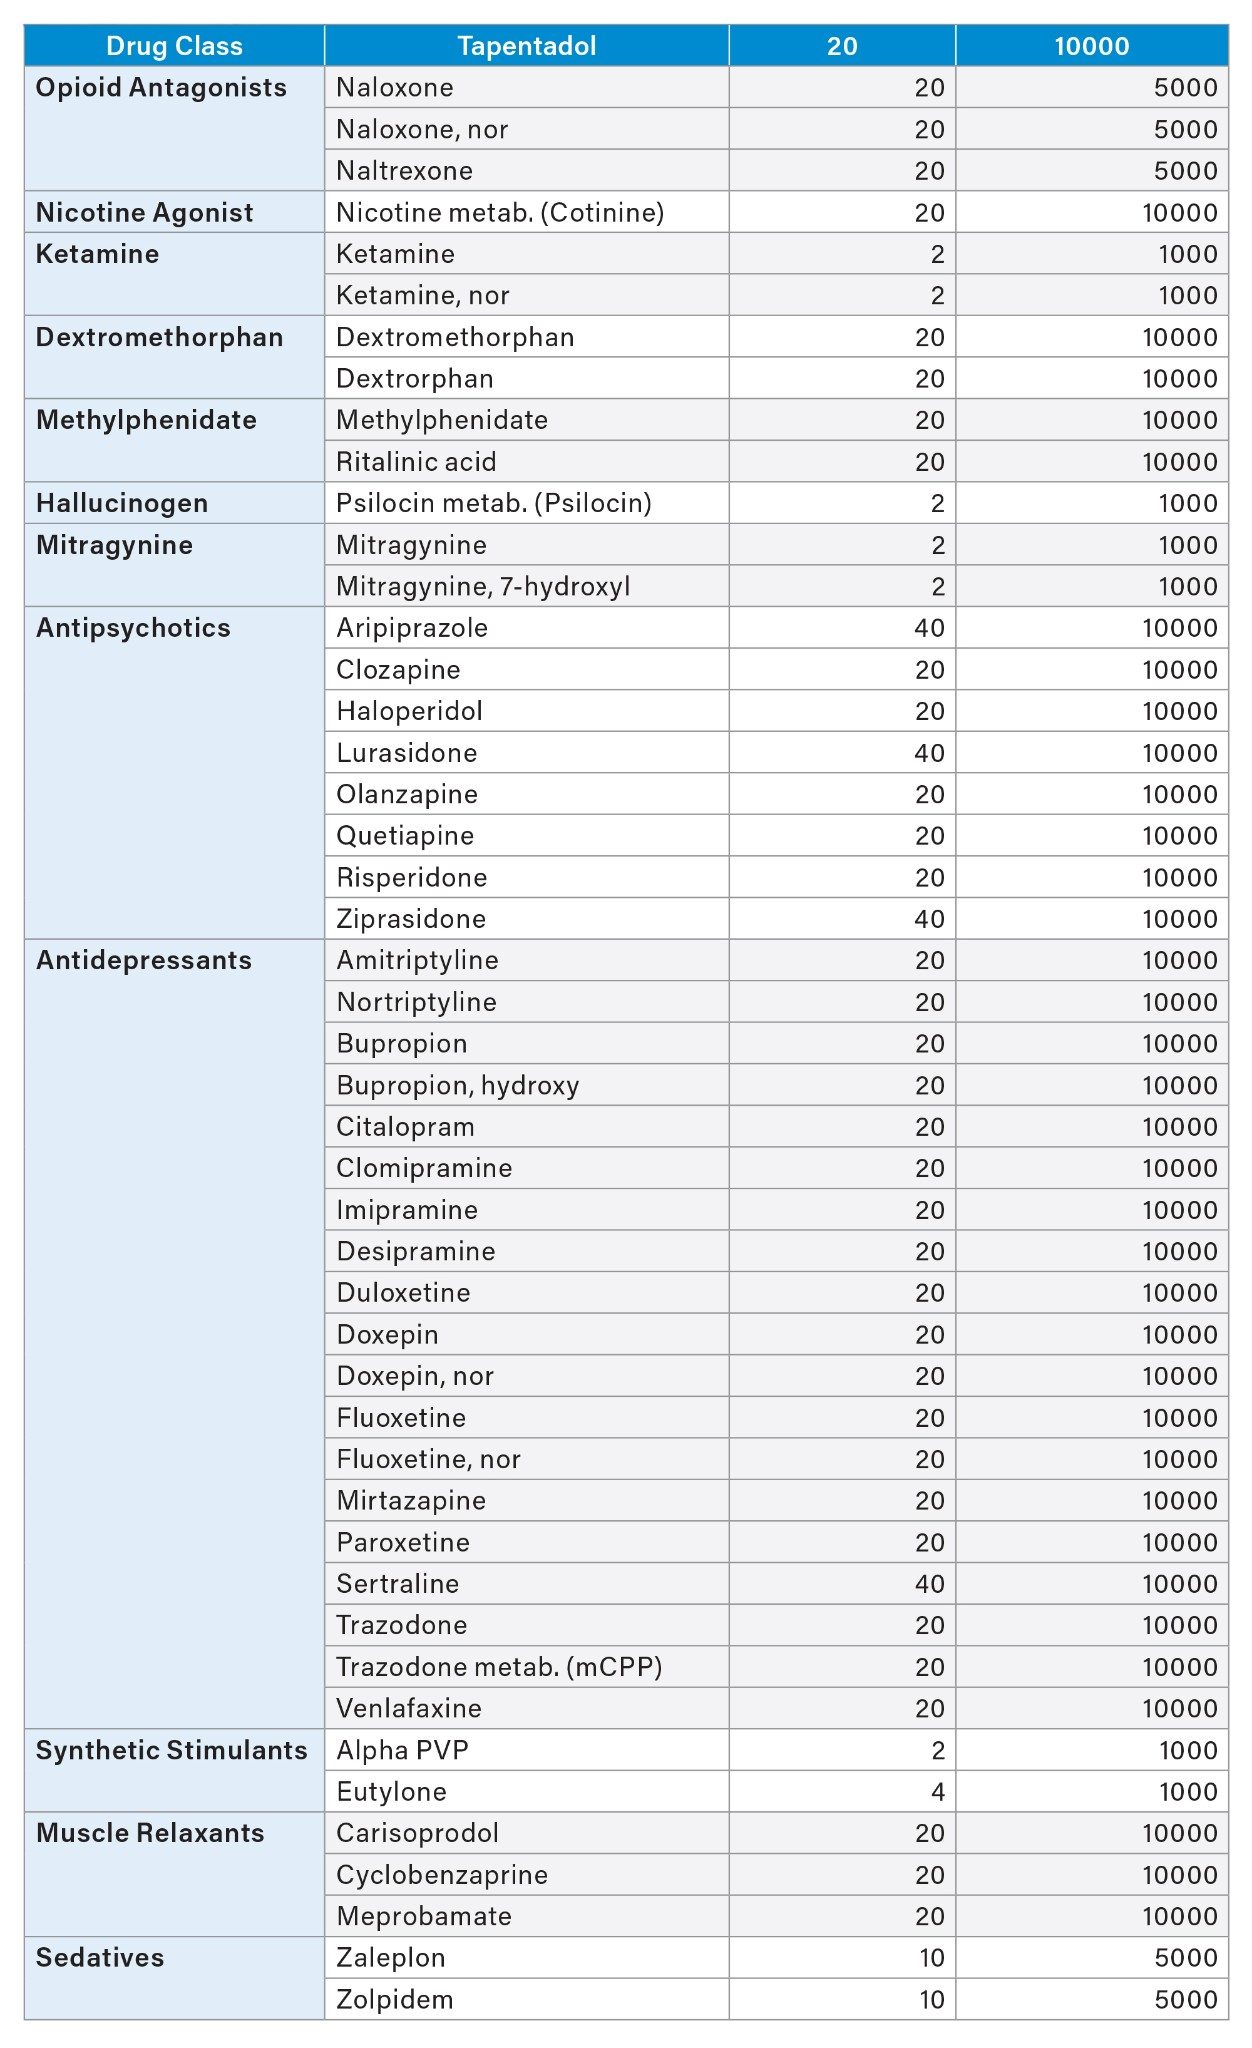
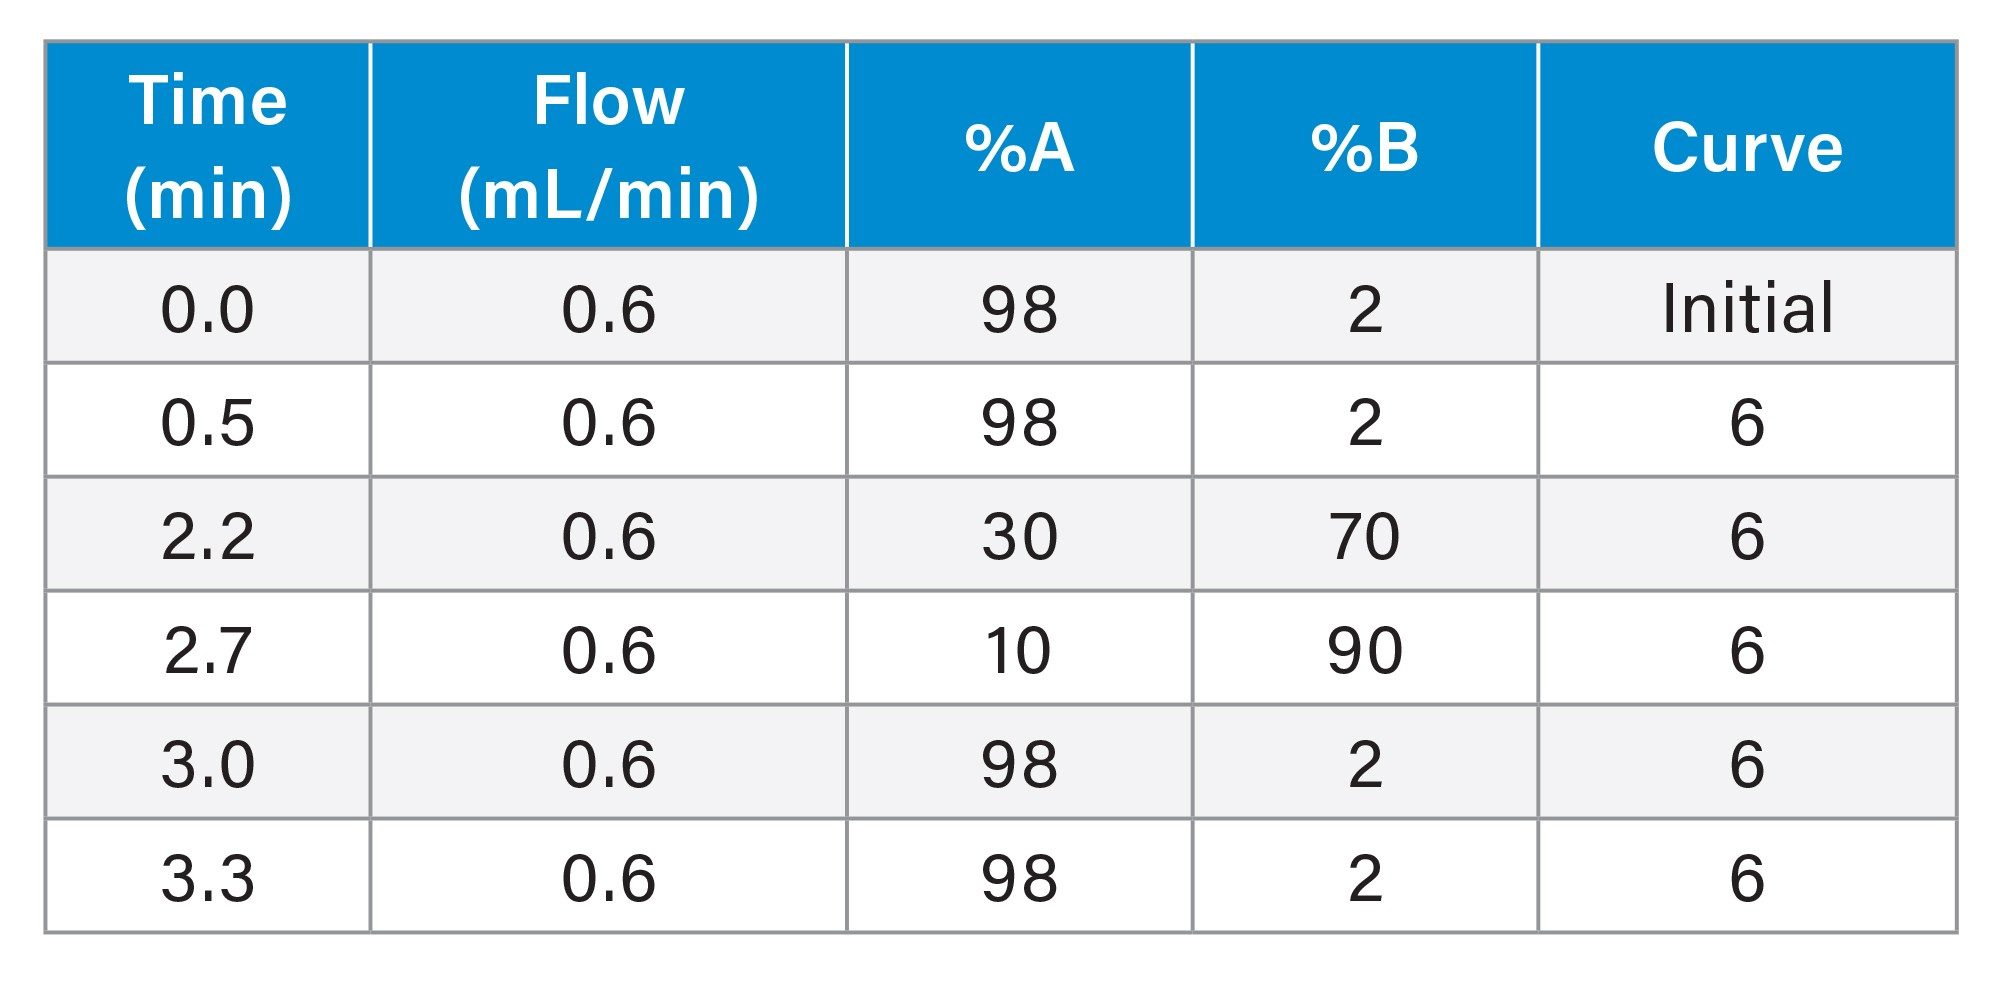
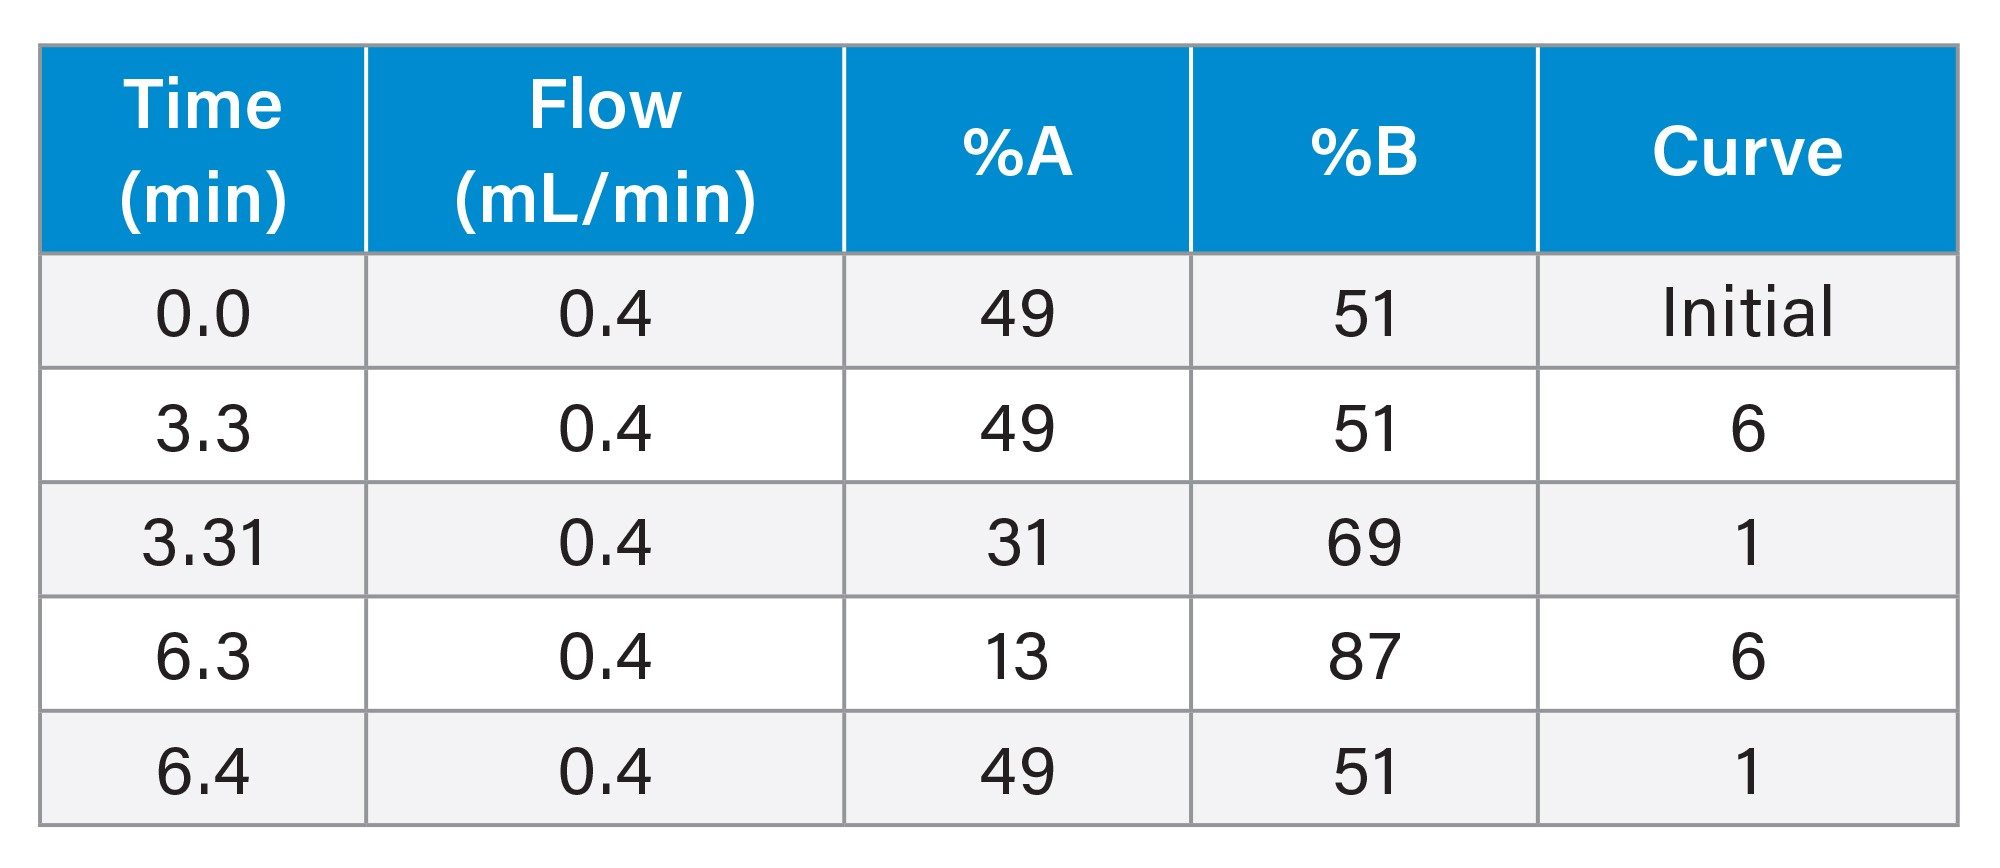
The additional testing with and without hydrolysis was performed for a panel of 110 drugs and Phase 1 metabolites (analytes) use two quantitative UPLC-MS/MS methods. A Threshold Accurate Calibration (TAC) method tested for 104 of the panel analytes and used a novel matrix normalization technique. A complete description of the concept and validation of TAC, along with a step-by-step protocol for the analysis, has been previously published.17–19 All urine samples were tested by the TAC method with and without a 10-fold dilution with analyte-negative urine to achieve the analytical ranges as shown in Table 1. A cannabinoid isomer-specific method was used for detection and quantitation of the additional analytes in the panel including Δ9 THC, Δ8 THC, Δ9 cTHC, Δ8 cTHC, 11-hydroxy THC and CBD (20). UHPLC conditions for both methods are shown in Tables 2-5. Both TAC and cannabinoid testing was performed with and without the glucuronidase hydrolysis using a recombinant-sourced reagent (IMCSzyme RT, Irmo SC) employing two β-glucuronidase variants selected for optimized hydrolysis.16 Waters Application Notes for both analytical methods, including examples of validation workflow for addition of new panel analytes, are also available.21,22 A list of all panel analytes along with their detection and quantitation limits is shown in Table 1.
|
LC system: |
ACQUITY UPLC I-Class PLUS Flow-Through Needle (FTN) |
|
Column: |
ACQUITY UPLC BEH™ Phenyl Column 1.7 µm, 2.1 x 50 mm; p/n: 186002884 |
|
Column temperature: |
45 °C |
|
Sample temperature: |
10 °C |
|
Injection volume: |
5 µL |
|
Flow rate: |
0.6 mL/min |
|
Mobile phase A: |
2 mM ammonium formate + 0.1% formic acid in MilliQ® (MilliporeSigma) water |
|
Mobile phase B: |
2 mM ammonium formate + 0.1% formic acid in methanol |
|
Wash solvent: |
25:25:25:25 methanol:isopropanol:acetonitrile:water |
|
MS system: |
Xevo TQD Mass Spectrometer |
|
Ionization mode: |
ESI+ |
|
Capillary voltage: |
0.55 kV |
|
Desolvation temperature: |
550 °C |
|
Source temperature: |
150 °C |
|
Desolvation gas: |
800 L/Hr |
|
Cone gas: |
100 L/Hr |
|
MS1 resolution: |
Unit |
|
MS2 resolution: |
Unit |
Table 3. Mass spectrometry parameters used for the TAC method.
|
LC system: |
ACQUITY UPLC I-Class PLUS (FTN) |
|
Column: |
Cortecs UPLC C18+ Column 1.6 µm, 2.1 x 50 mm; p/n: 186007114 |
|
Column temperature: |
30 °C |
|
Sample temperature: |
10 °C |
|
Injection volume: |
10 µL |
|
Flow rate: |
0.6 mL/min |
|
Mobile phase A: |
0.1% formic acid in MilliQ water |
|
Mobile phase B: |
LC/MS grade Acetonitrile |
|
Wash solvent: |
95:5 Acetonitrile:water |
|
MS system: |
Xevo TQD Mass Spectrometer |
|
Ionization mode: |
ESI+/ESI- |
|
Capillary voltage: |
2.5kV |
|
Desolvation temperature: |
500 °C |
|
Source temperature: |
150 °C |
|
Desolvation gas: |
800 L/Hr |
|
Cone gas: |
100 L/Hr |
|
MS1 resolution: |
Unit |
|
MS2 resolution: |
Unit |
Table 5. Mass spectrometry parameters used for the cannabinoid isomer method.
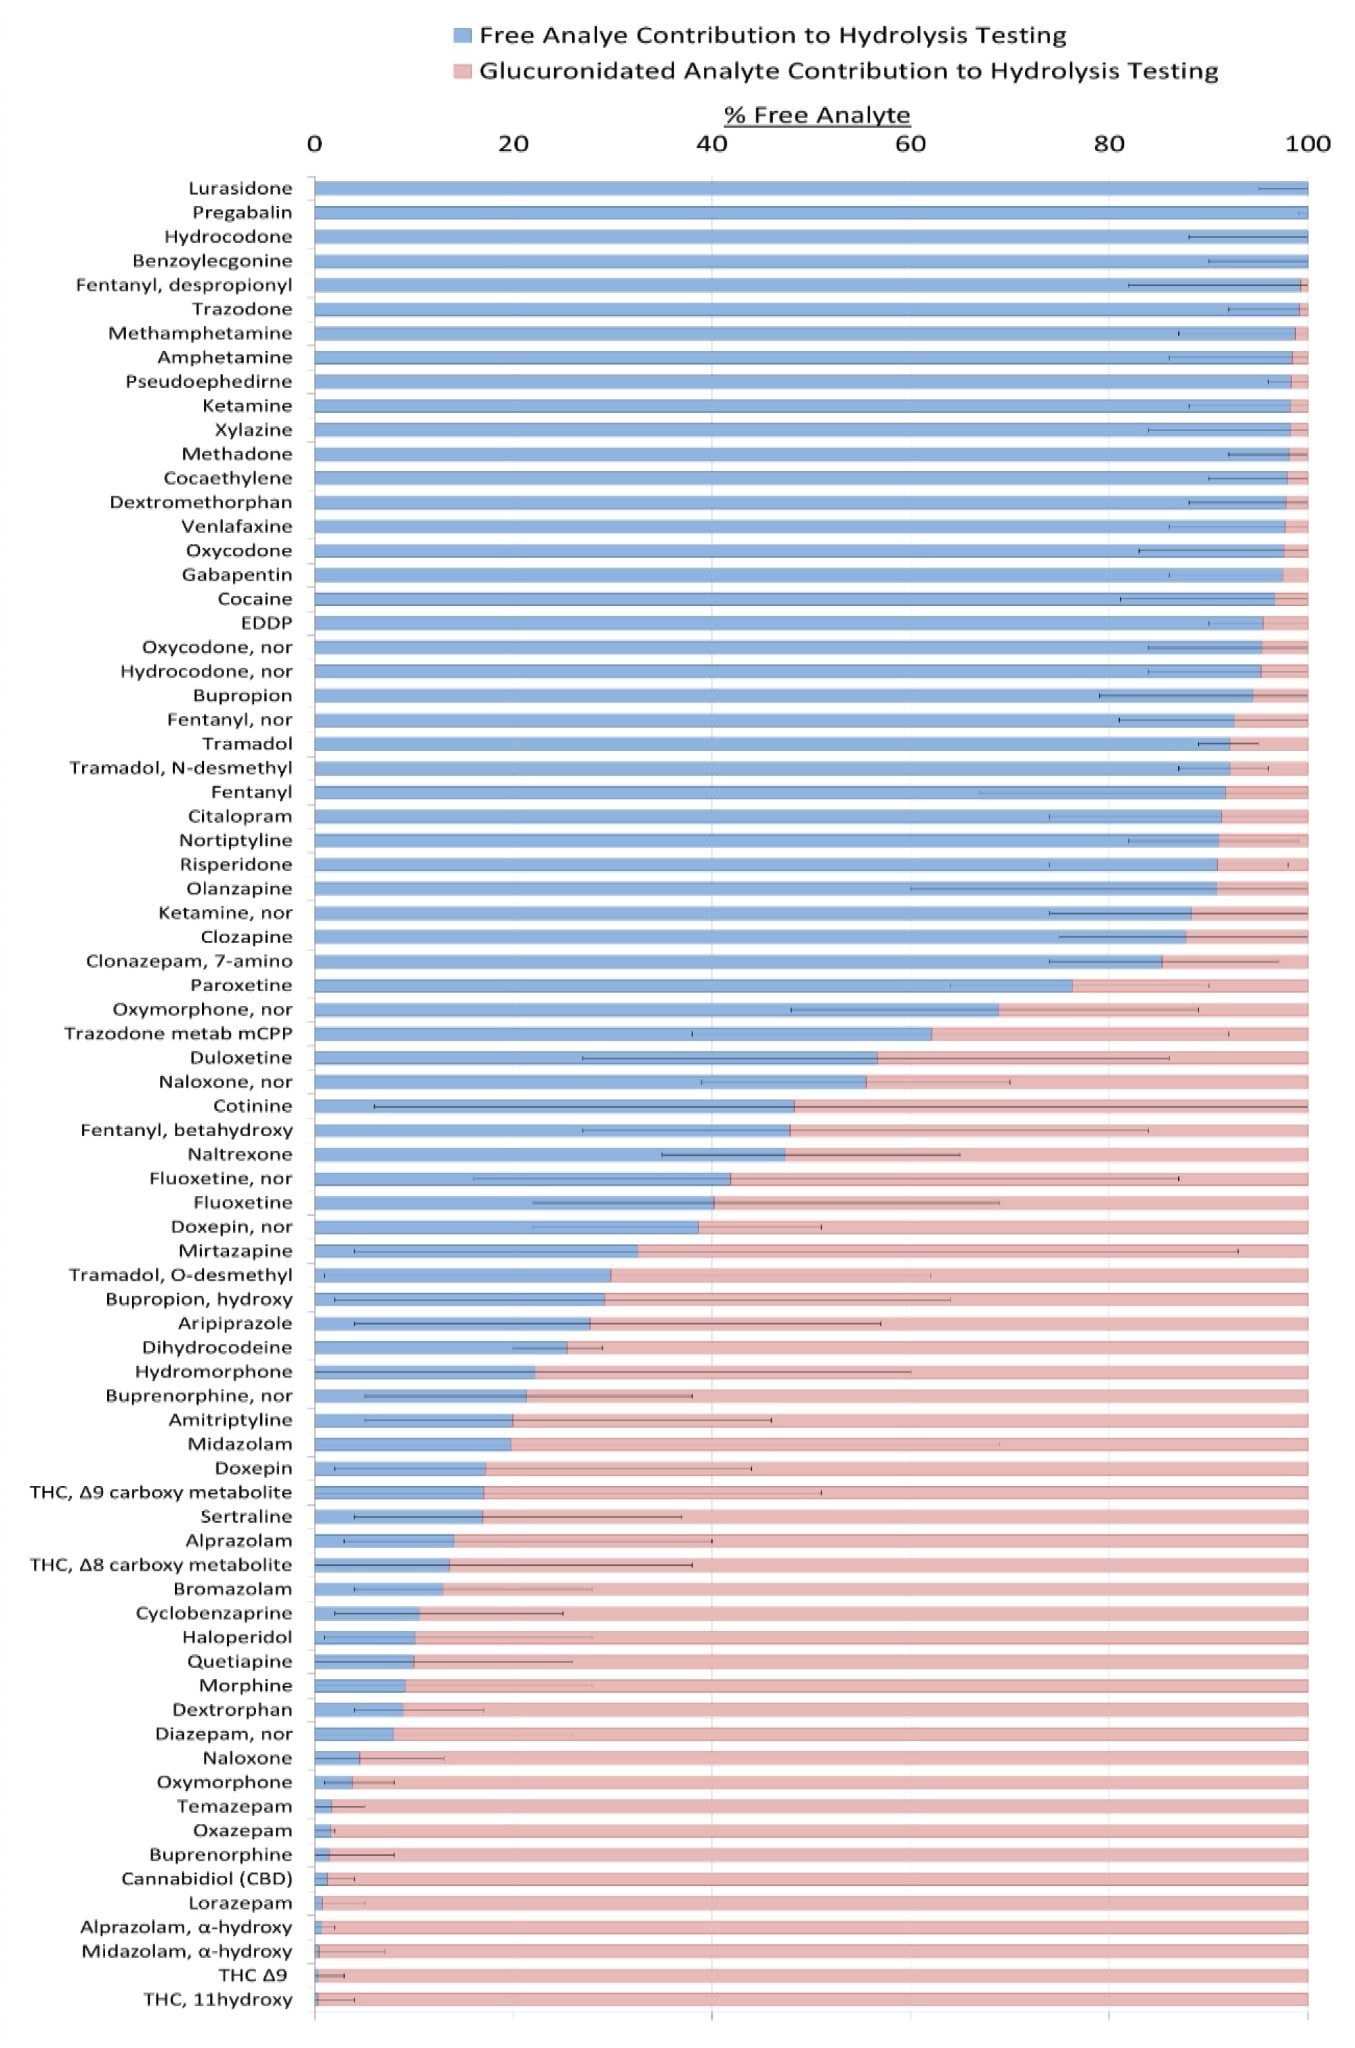
In the 360 patient samples with positive test results, a total of 1,866 specific drug and metabolite were positive with glucuronidase hydrolysis, representing positive findings involving 76 of the 110 analytes in the panel. Analyses were performed on each sample with and without hydrolysis to assess the relative free and conjugated analyte contribution to the routine practice of testing with hydrolysis. Data from an average of 25 matched test results (range 3-249) per analyte were employed in the study. Figure 1 displays the average percent contribution to hydrolysis testing for free versus glucuronidated analyte. The range of free and glucuronidated forms is represented by the minimum and maximum bars for each analyte. The co-analysis showed that hydrolysis contributed to greater than 50% of the test response for 39 out of the 76 analytes tested in the panel. Furthermore, the glucuronide metabolite form was the predominate (>80%) contributor to test response in 24 of the 76 analytes, including analytes in the cannabinoid, benzodiazepine, opioid and psychiatric drug classes.
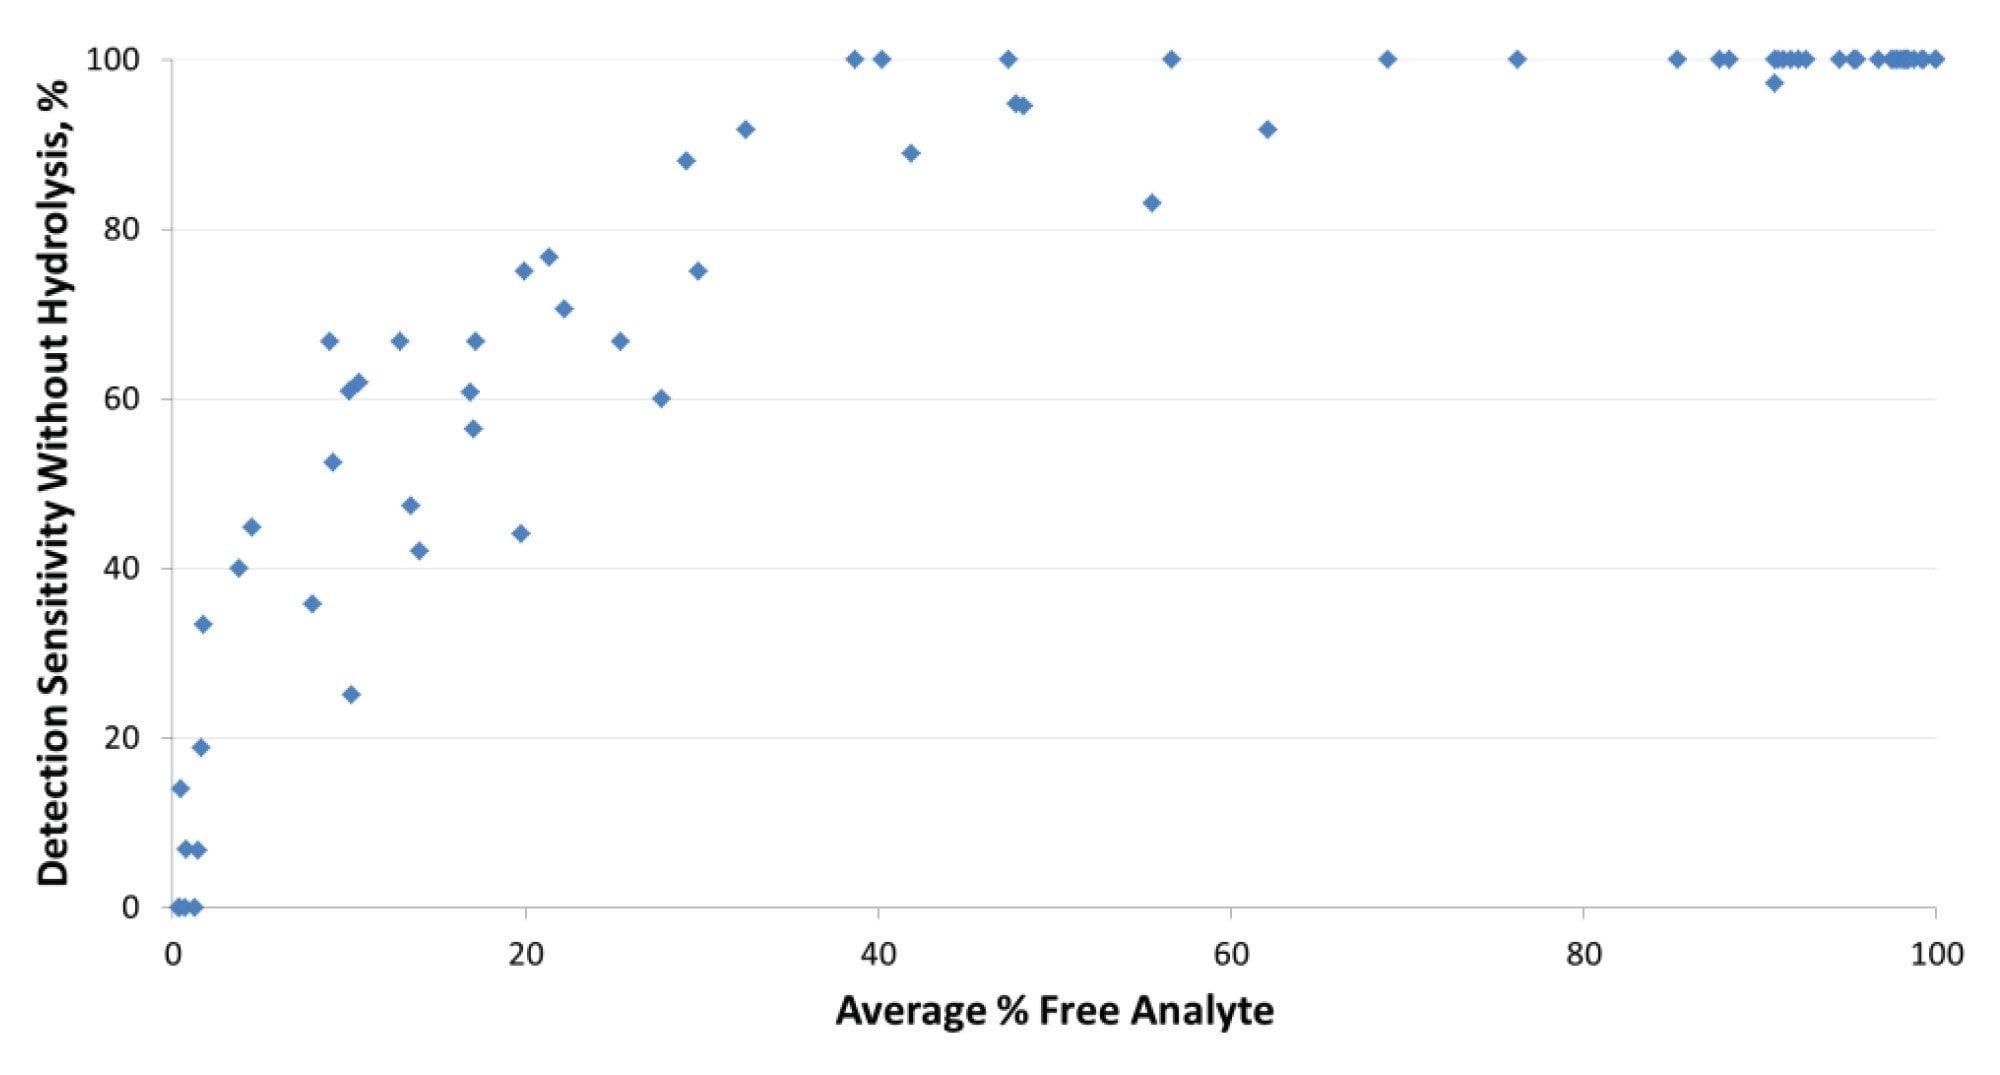
Test performance without hydrolysis was initially evaluated qualitatively for detection limit sensitivity. The rate of detection without hydrolysis, which includes testing only for free analyte, was compared with hydrolysis testing in which 100% of the tests exceeded the detection limit by study design. Figure 2 shows the relationship between the average percent free form of analyte versus the rate of analyte detection without hydrolysis. All analytes with an average free-analyte contribution of greater than 90% had detection rates of greater than 99%. Detection rates without hydrolysis decreased precipitately for 32 of the analytes in which the average free-analyte contribution was below 40%. Detection rates in the lowest range of 0-20% were determined in 10% of the analytes tested. Therefore, hydrolysis is critical for detection of drug use for many of the analytes, based on the limits of detection used in this study.
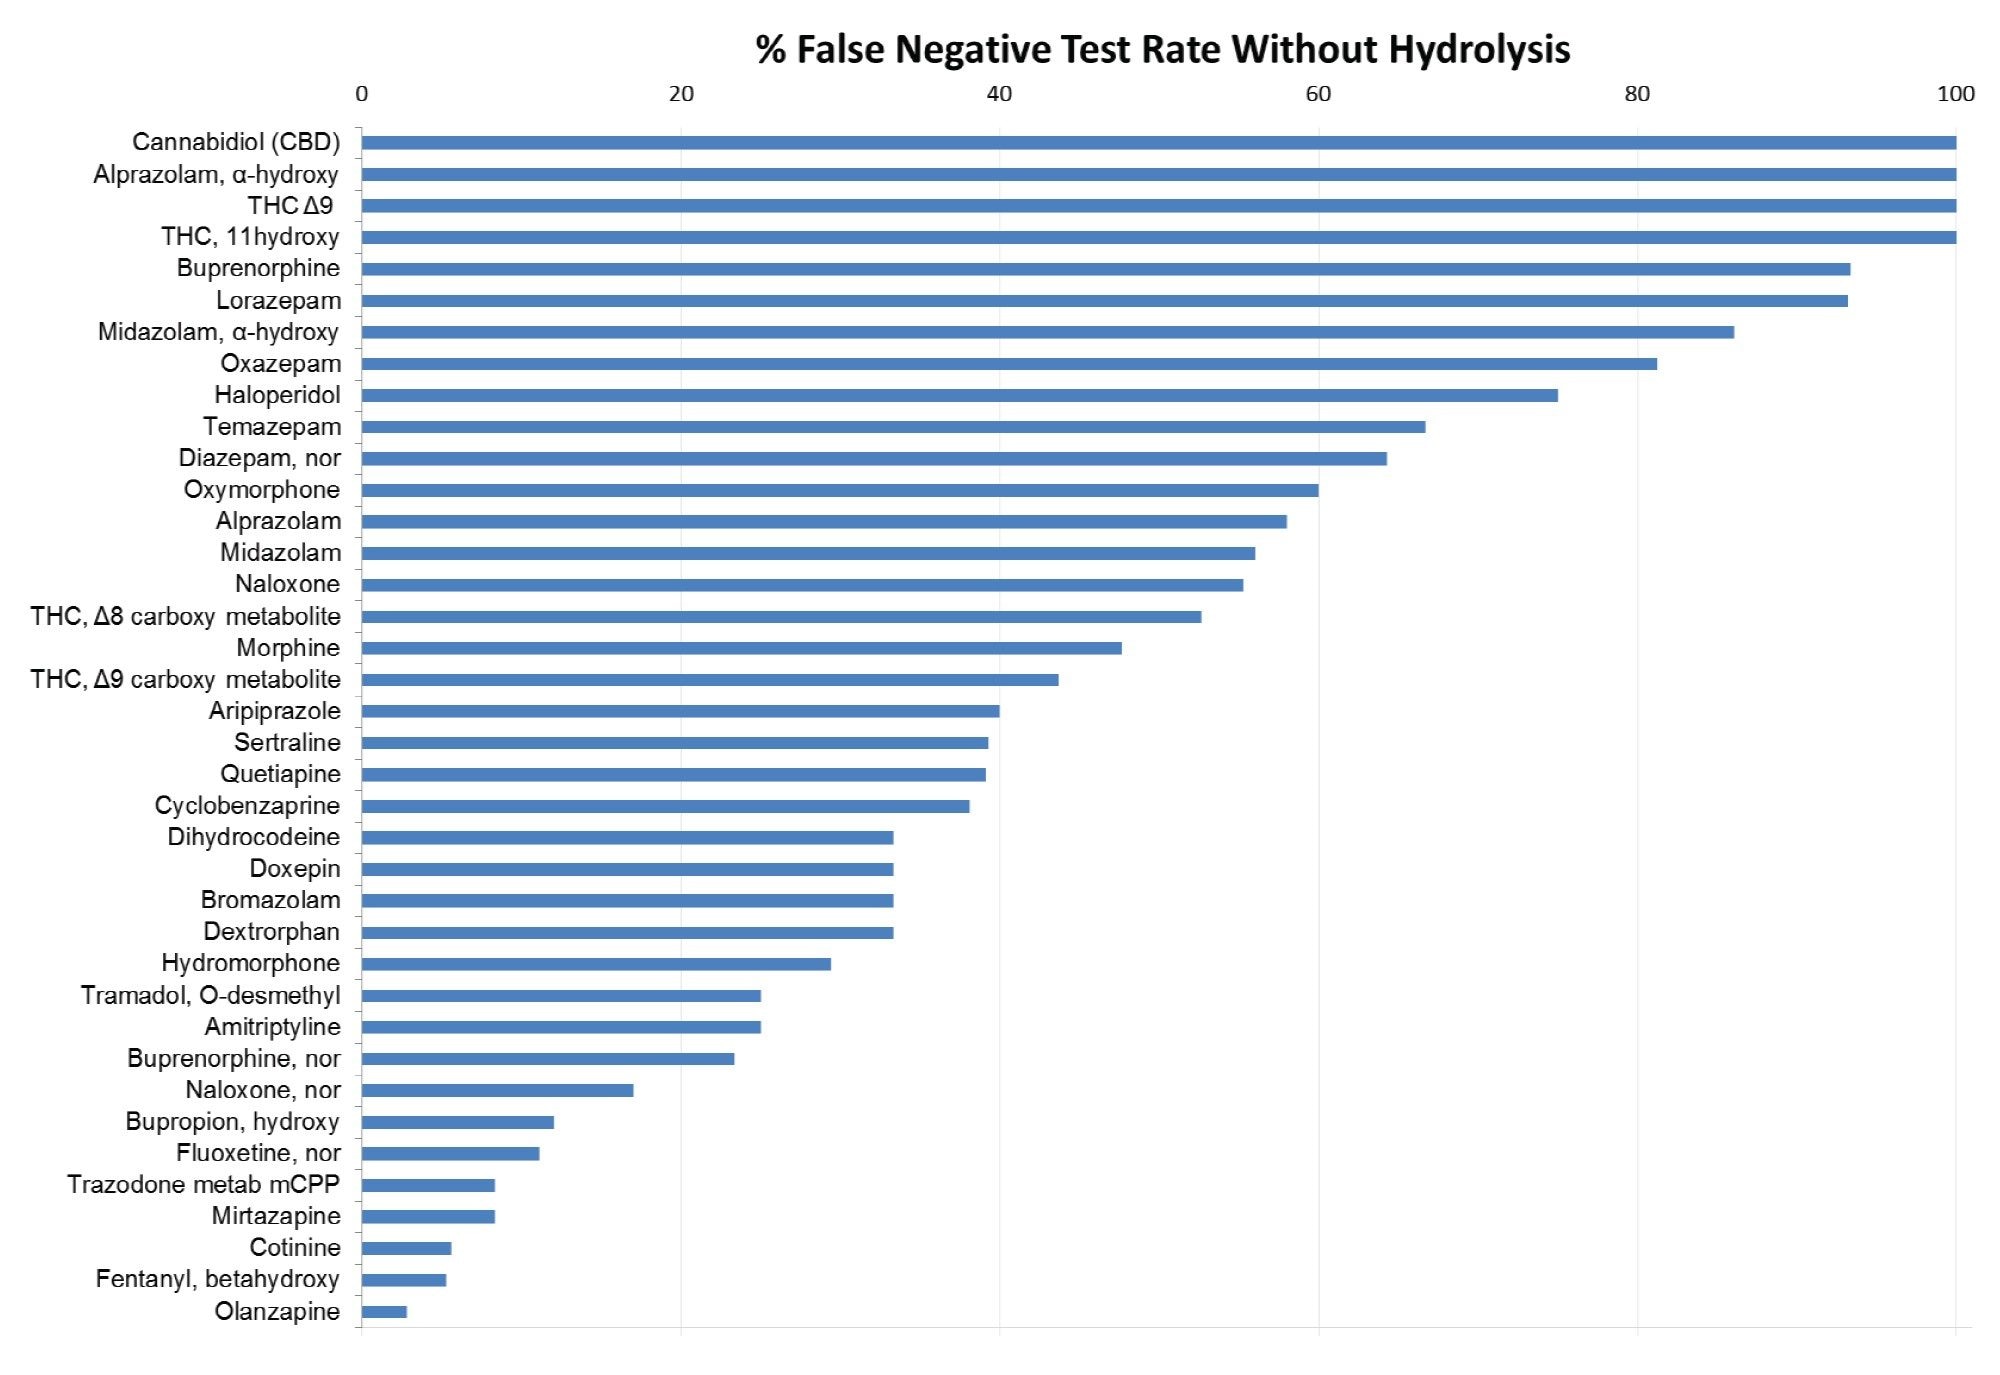
False negative results are another risk of incomplete glucuronide hydrolysis. False negative test results were observed without hydrolysis for 39 of the analytes in the study. Figure 3 shows the false negative rate in ranked order for these analytes. Over 40% (n=16) of the 39 analytes had false negative rates greater than 50% when hydrolysis was not performed, and four of these analytes (cannabidiol, α-hydroxy alprazolam, 11-hydroxy THC and buprenorphine) had false negative rates of 100%.
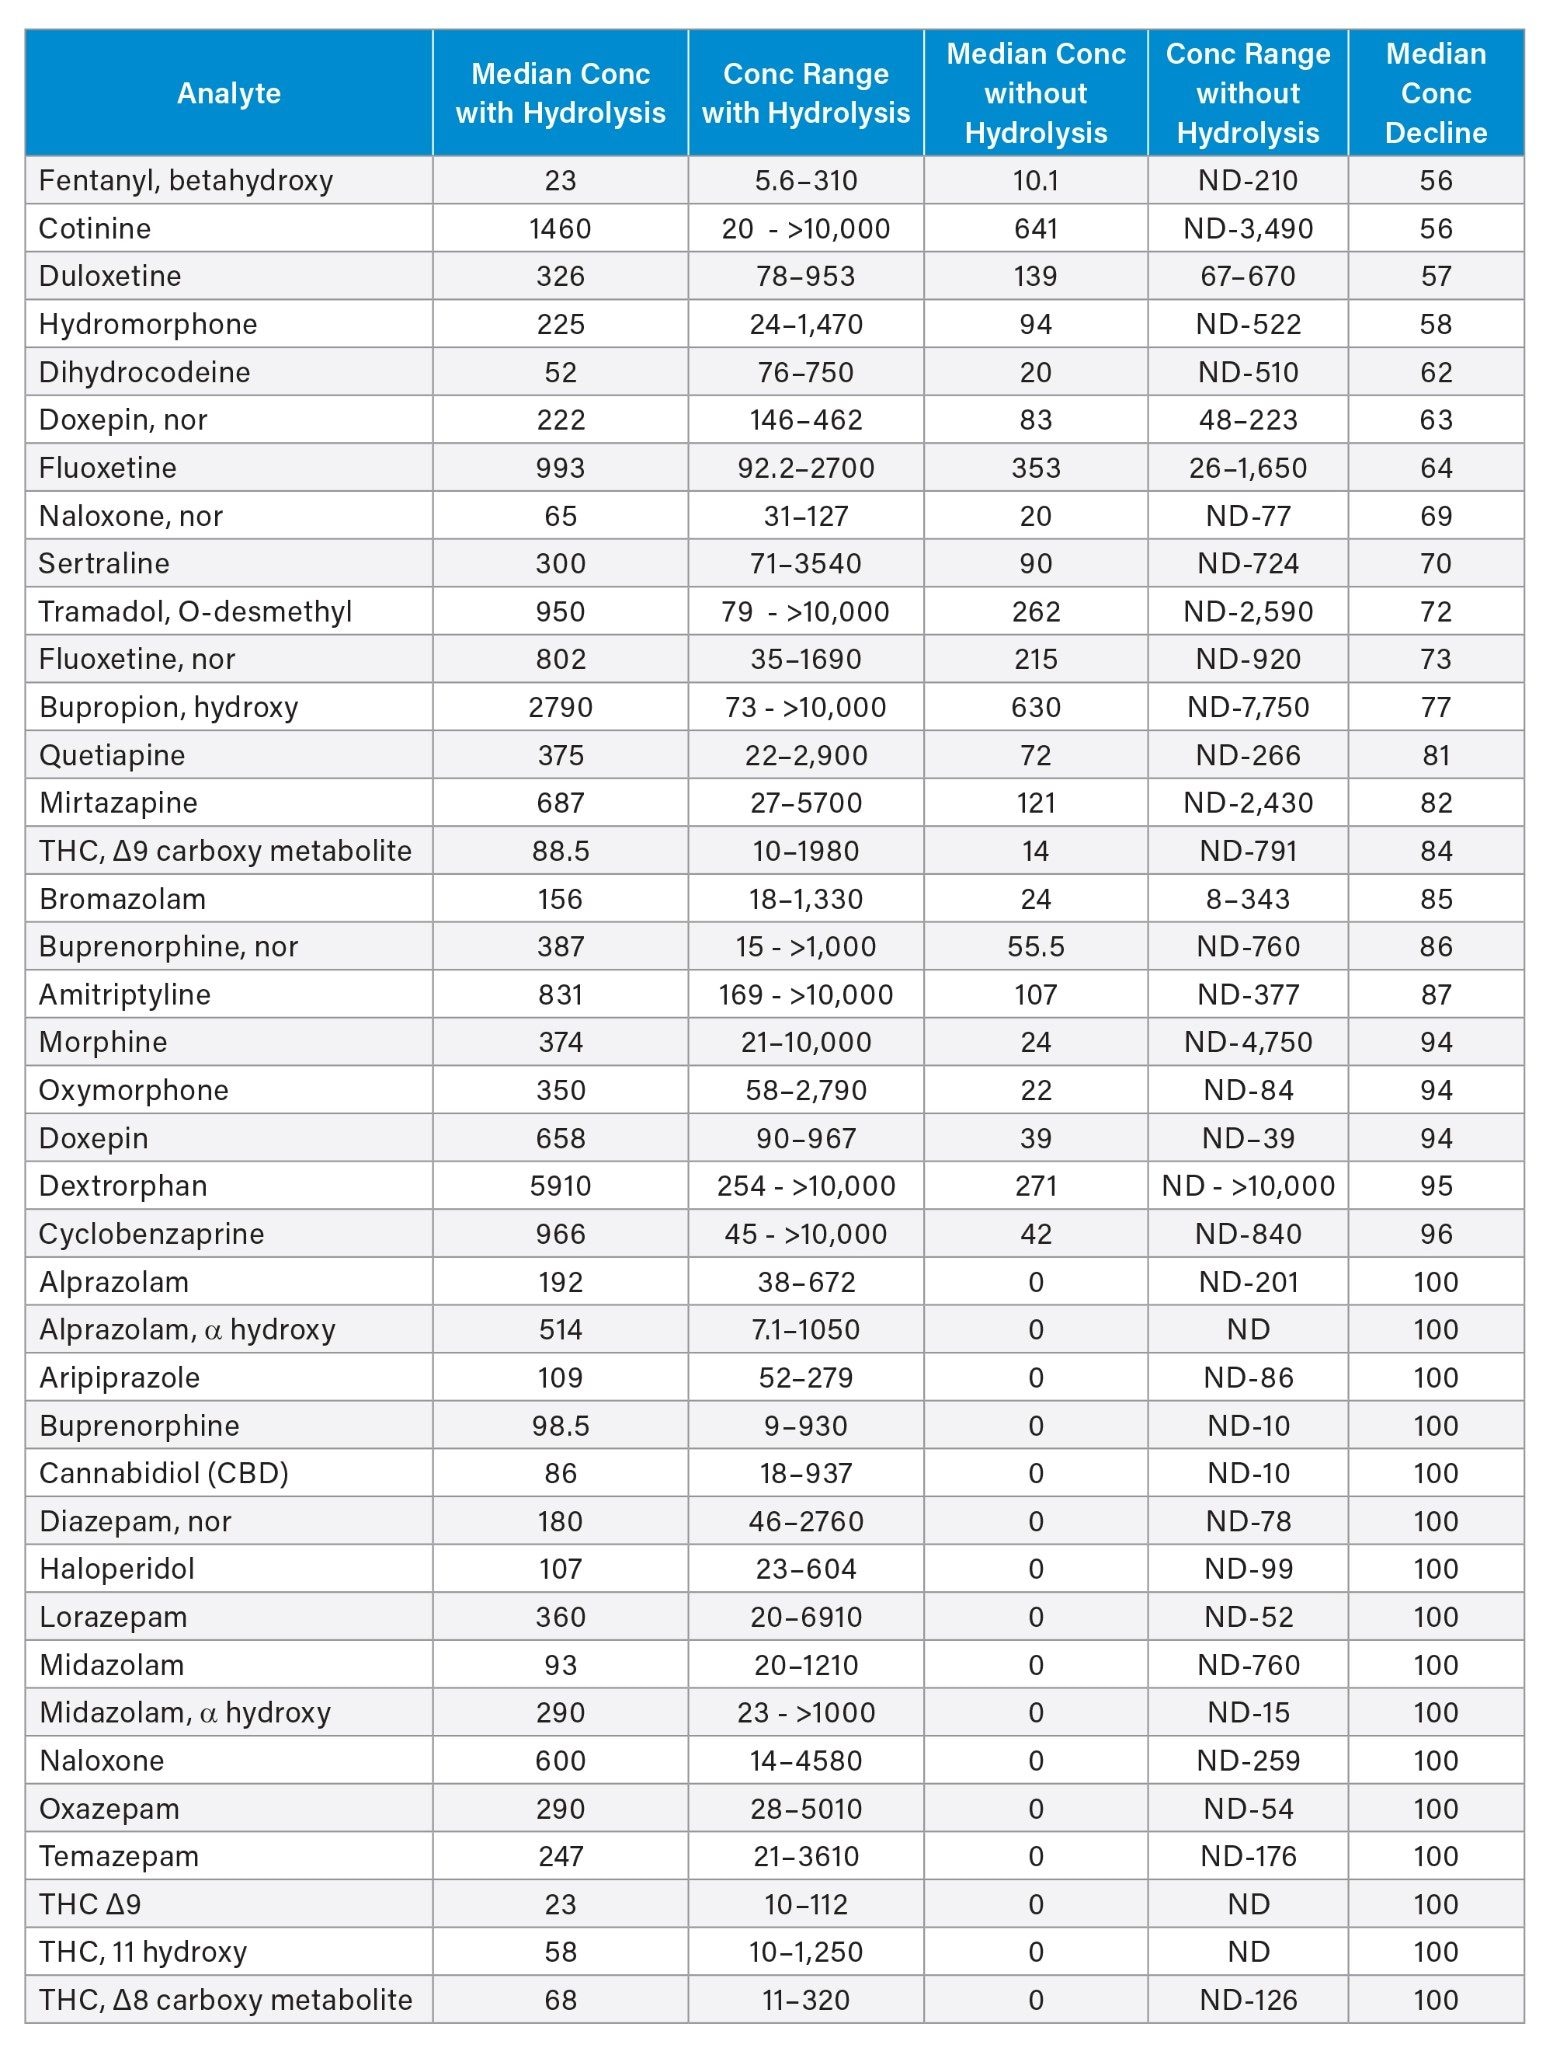
In addition to the false negative rates that were found in the identification of analytes, based on LOD, the quantitative performance of the testing was compromised for a majority of analytes when hydrolysis was not employed. Table 6 lists 39 analytes in the panel with a greater than >50% contribution of glucuronidated analytes to the total concentration as determined with hydrolysis. Both the median and range of analyte concentration for these analytes was significantly reduced without hydrolysis. A greater than 99% decrement in concentration was observed without hydrolysis for more than 20% (n=16) of the analytes in the panel, including testing across cannabinoid, benzodiazepine, opioid, muscle relaxant and psychiatric drug classes.
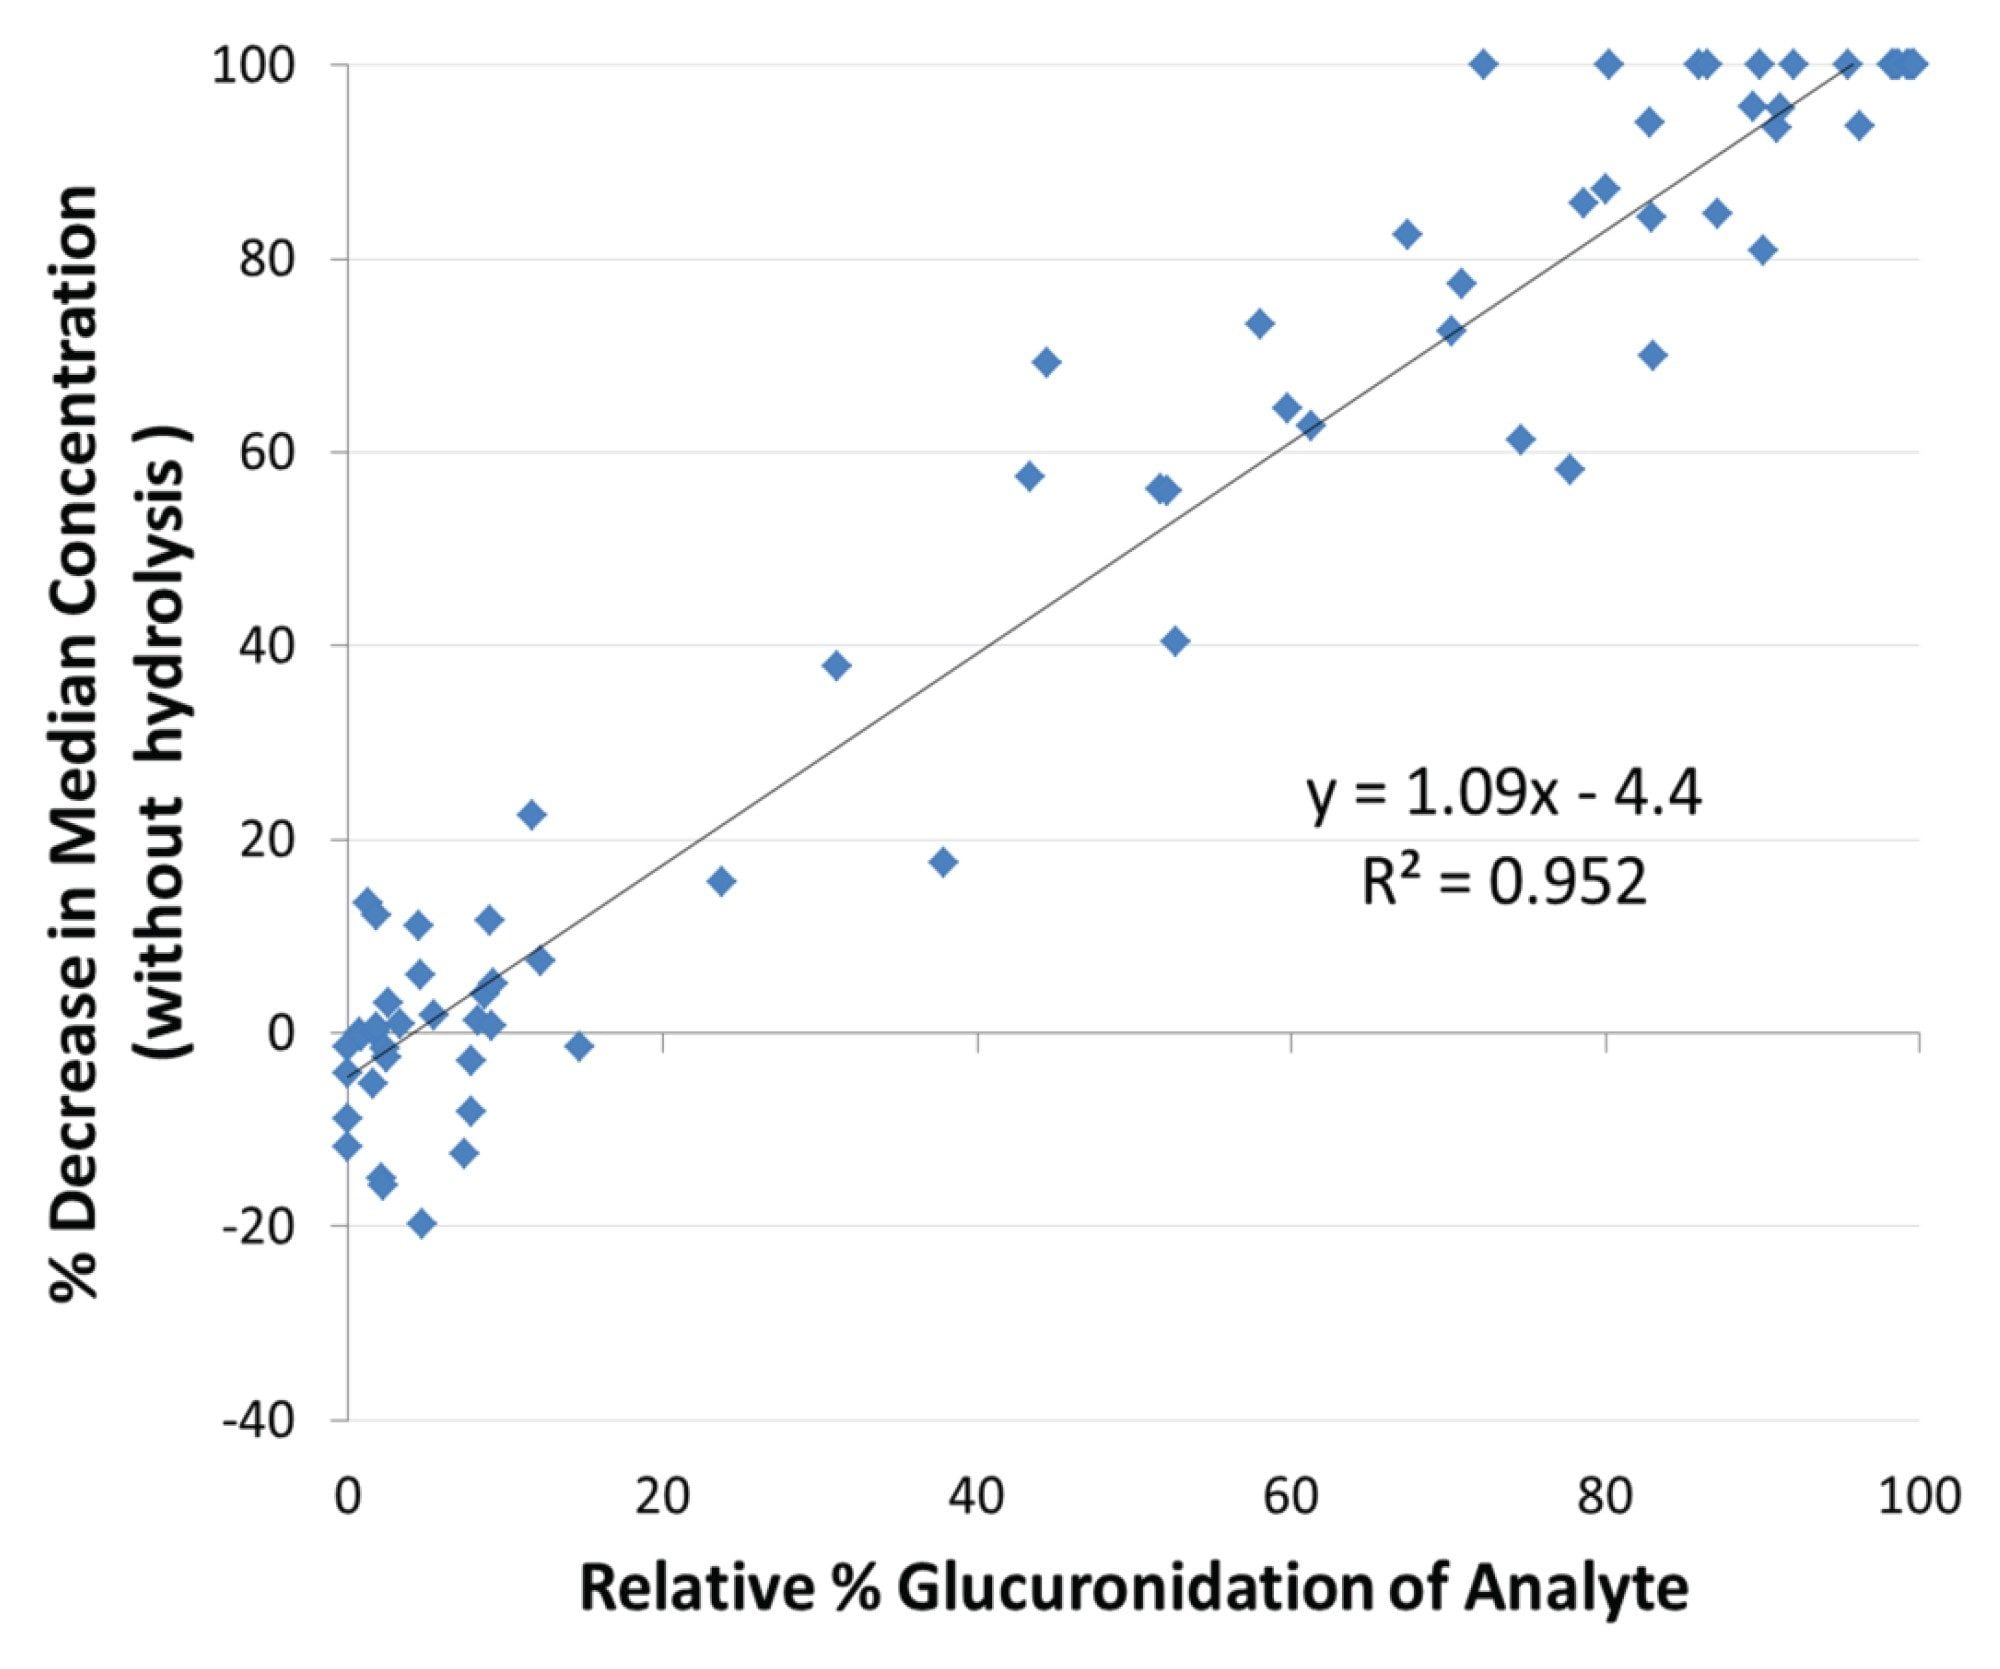
Glucuronidated analytes demonstrated a significant contribution to the quantitative performance of urine drug testing. As shown in Figure 4, the decrease in median analyte concentration without hydrolysis correlated directly, and linearly, with the percentage of glucuronidated analyte in the urine specimen. Regression analysis revealed a slope (1.09) and intercept (-4.4) that were statistically indistinguishable from 1 and 0, respectively. Excretion of an increasing proportion of the analyte in the glucuronidated form therefore decreases not only the detection sensitivity but also linearly decreases the quantitative performance of testing when hydrolysis is not employed.
While beta glucuronidase hydrolysis is used widely in urine drug testing for combined analysis of glucuronidated and free forms of most analytes, knowledge is limited regarding the contribution of glucuronide metabolites to detection sensitivity and quantitative performance for many drugs and Phase 1 metabolites tested in routine forensic and clinical practice. The current study of 76 drugs and metabolite tests in urine, obtained from a cohort of emergency department patients who were suspected of drug misuse, shows a significant and wide range of contribution of glucuronidated metabolites to urine drug testing performance. Glucuronidated metabolites are the major source (>50%) of analyte response for 39 of the 76 analytes and are a predominated source (>80%) of total analyte response in 32% of the analytes. The study shows that analyte detection often relies heavily on glucuronide metabolite hydrolysis, with analyte detection falling precipitately when the free-analyte component in the excreted urine falls below 40% and with detection rates of less than 20% for 10% of the analytes when tested without the hydrolysis step. False negative rates without hydrolysis show that over 40% of the analyte tests have false negative rates greater than 50% and that testing for cannabidiol, α-hydroxy alprazolam, 11-hydroxy THC and buprenorphine resulted in 100% false negative rates in the absence of a hydrolysis step. Quantitative performance of testing was also affected, with hydrolysis contributing to more than 50% of the concentration for 39 of the analytes and with the decrement in quantitative performance without hydrolysis correlating directly with the relative amount of glucuronidated analyte in urine. Effective glucuronide hydrolysis is a major contributor to the sensitivity and quantitative performance of urine drug testing for many of the drugs and Phase 1 metabolites tested in emergency medicine practice. These methods, developed and validated using Waters Xevo TQD Mass Spectrometer, ACQUITY I-Class PLUS and UPLC Columns, enabled a rapid, sensitive analysis with both methods used in this study.
720009272, April 2026