
Rapid LC-UV/MS Workflow for Routine Oligonucleotide Impurity Monitoring Using the SQ Detector 2 Mass Detector and Empower™ Chromatography Data System (CDS)
Henry Foddy, Victoria van Kuijk, Jo-Anne Riley, Cristian Cojocariu
Waters Corporation, Wilmslow, United Kingdom
Published on August 13, 2026

Abstract
Benefits
- A streamlined workflow for routine monitoring of a lipid conjugated antisense oligonucleotide (ASO) and related impurities, using a shortened 6.5 minutes ion-pair reversed-phase liquid chromatography coupled with ultra-violet and mass spectrometry detection (IP-RP-LC-UV-MS) method
- Combines robust UV quantitation with mass-based identity confirmation and selective assessment of co-eluting species using the Single Quadrupole (SQ) Detector 2
- MaxPeak™ Premier Technology used across the LC system, analytical column, and sample vials, reduces non-specific surface interactions and supports consistent oligonucleotide sample recovery
- Integration of acquisition, processing, review, and reporting within Empower CDS supports standardised and traceable operation in regulated QC environments
- The Empower CDS workflow streamlines data processing and greatly reduces sample-to-result time, shortening conventional QC timelines and enabling faster, more consistent batch-release decisions with fewer analyst-dependent errors
Introduction
ASOs are short, synthetic nucleic-acid sequences designed to modulate gene expression through sequence-specific binding to complementary RNA. Their ability to address targets that are difficult to modulate using conventional small molecules or therapeutic proteins has established ASOs as an important and expanding class of medicines, particularly for genetically defined and rare diseases. However, their structural complexity and the nature of their manufacture create analytical challenges that differ substantially from those encountered with conventional small-molecule pharmaceuticals.
Most therapeutic ASOs are manufactured by sequential solid-phase phosphoramidite synthesis, enabling precise stepwise assembly of an intended sequence. However, incomplete reactions can accumulate over successive synthesis cycles, producing a complex mixture containing the full-length product (FLP) alongside truncated and capped sequences, incompletely modified products, and other process-related impurities.1,2 Because many of these species differ from the FLP by only a single nucleotide or minor chemical modification, their separation and detection can be challenging. Effective purification and analytical monitoring are therefore essential, as uncontrolled impurities may alter biological activity, promote unintended interactions or immune responses, and contribute to off-target or other toxic effects, potentially compromising the efficacy of the final product and posing a risk to patient safety.
Effective ASO analysis typically follows a tiered progression from detailed characterisation to routine quality control (QC). During development, high-resolution mass spectrometry (HRMS) platforms such as the BioAccord™ LC-MS System provide accurate mass confirmation, investigate unknown components, and support detailed structural characterization, establishing the knowledge needed to define relevant impurities and quality attributes for a given oligonucleotide. Once these species have been characterised, expected masses, retention windows, and acceptance criteria can be transferred to a targeted single-quadrupole method for routine QC analysis across sample batches. These complementary workflows connect early characterisation with focused, reproducible monitoring of predefined quality attributes, supporting impurity control throughout the product lifecycle.
In routine QC workflows, ASO purity and impurity profiles are commonly monitored using ion-pair reversed-phase liquid chromatography (IP-RP-LC), as ion-pairing reagents associate with the highly anionic oligonucleotide backbone, enabling sufficient retention and selectivity to separate the FLP from closely related sequence variants, while remaining compatible with both UV and MS detection. An in-line Tunable Ultraviolet (TUV) Detector provides the primary quantitative response for an ASO assay, and for impurities chromatographically resolved from the main peak. A TUV Detector is preferred for this purpose as its response is less affected by Ionisation enhancement/suppression or adduct formation, making it a more robust and reproducible option as compared to mass spectrometry (MS).
However, while UV detection provides robust quantification of oligonucleotide content and chromatographic purity, it cannot confirm peak identity or distinguish structurally related species that co-elute. Complementary mass detection therefore confirms the FLP based on its expected mass and differentiates mass-resolved impurities within the principal UV peak. The relative MS responses of these species are then used to apportion the UV response and correct the reported FLP purity. Mass detection quantifies the relative contributions of the FLP and mass-resolved impurities co-eluting within the main UV peak using extracted-ion chromatograms (XICs).
While HRMS remains invaluable for detailed characterisation and investigation of unknown species, single-quadrupole mass detection using the SQ Detector 2 (Figure 1) provides the sensitivity, linear dynamic range, and operational simplicity required for routine QC workflows once expected product and impurity masses have been established.3
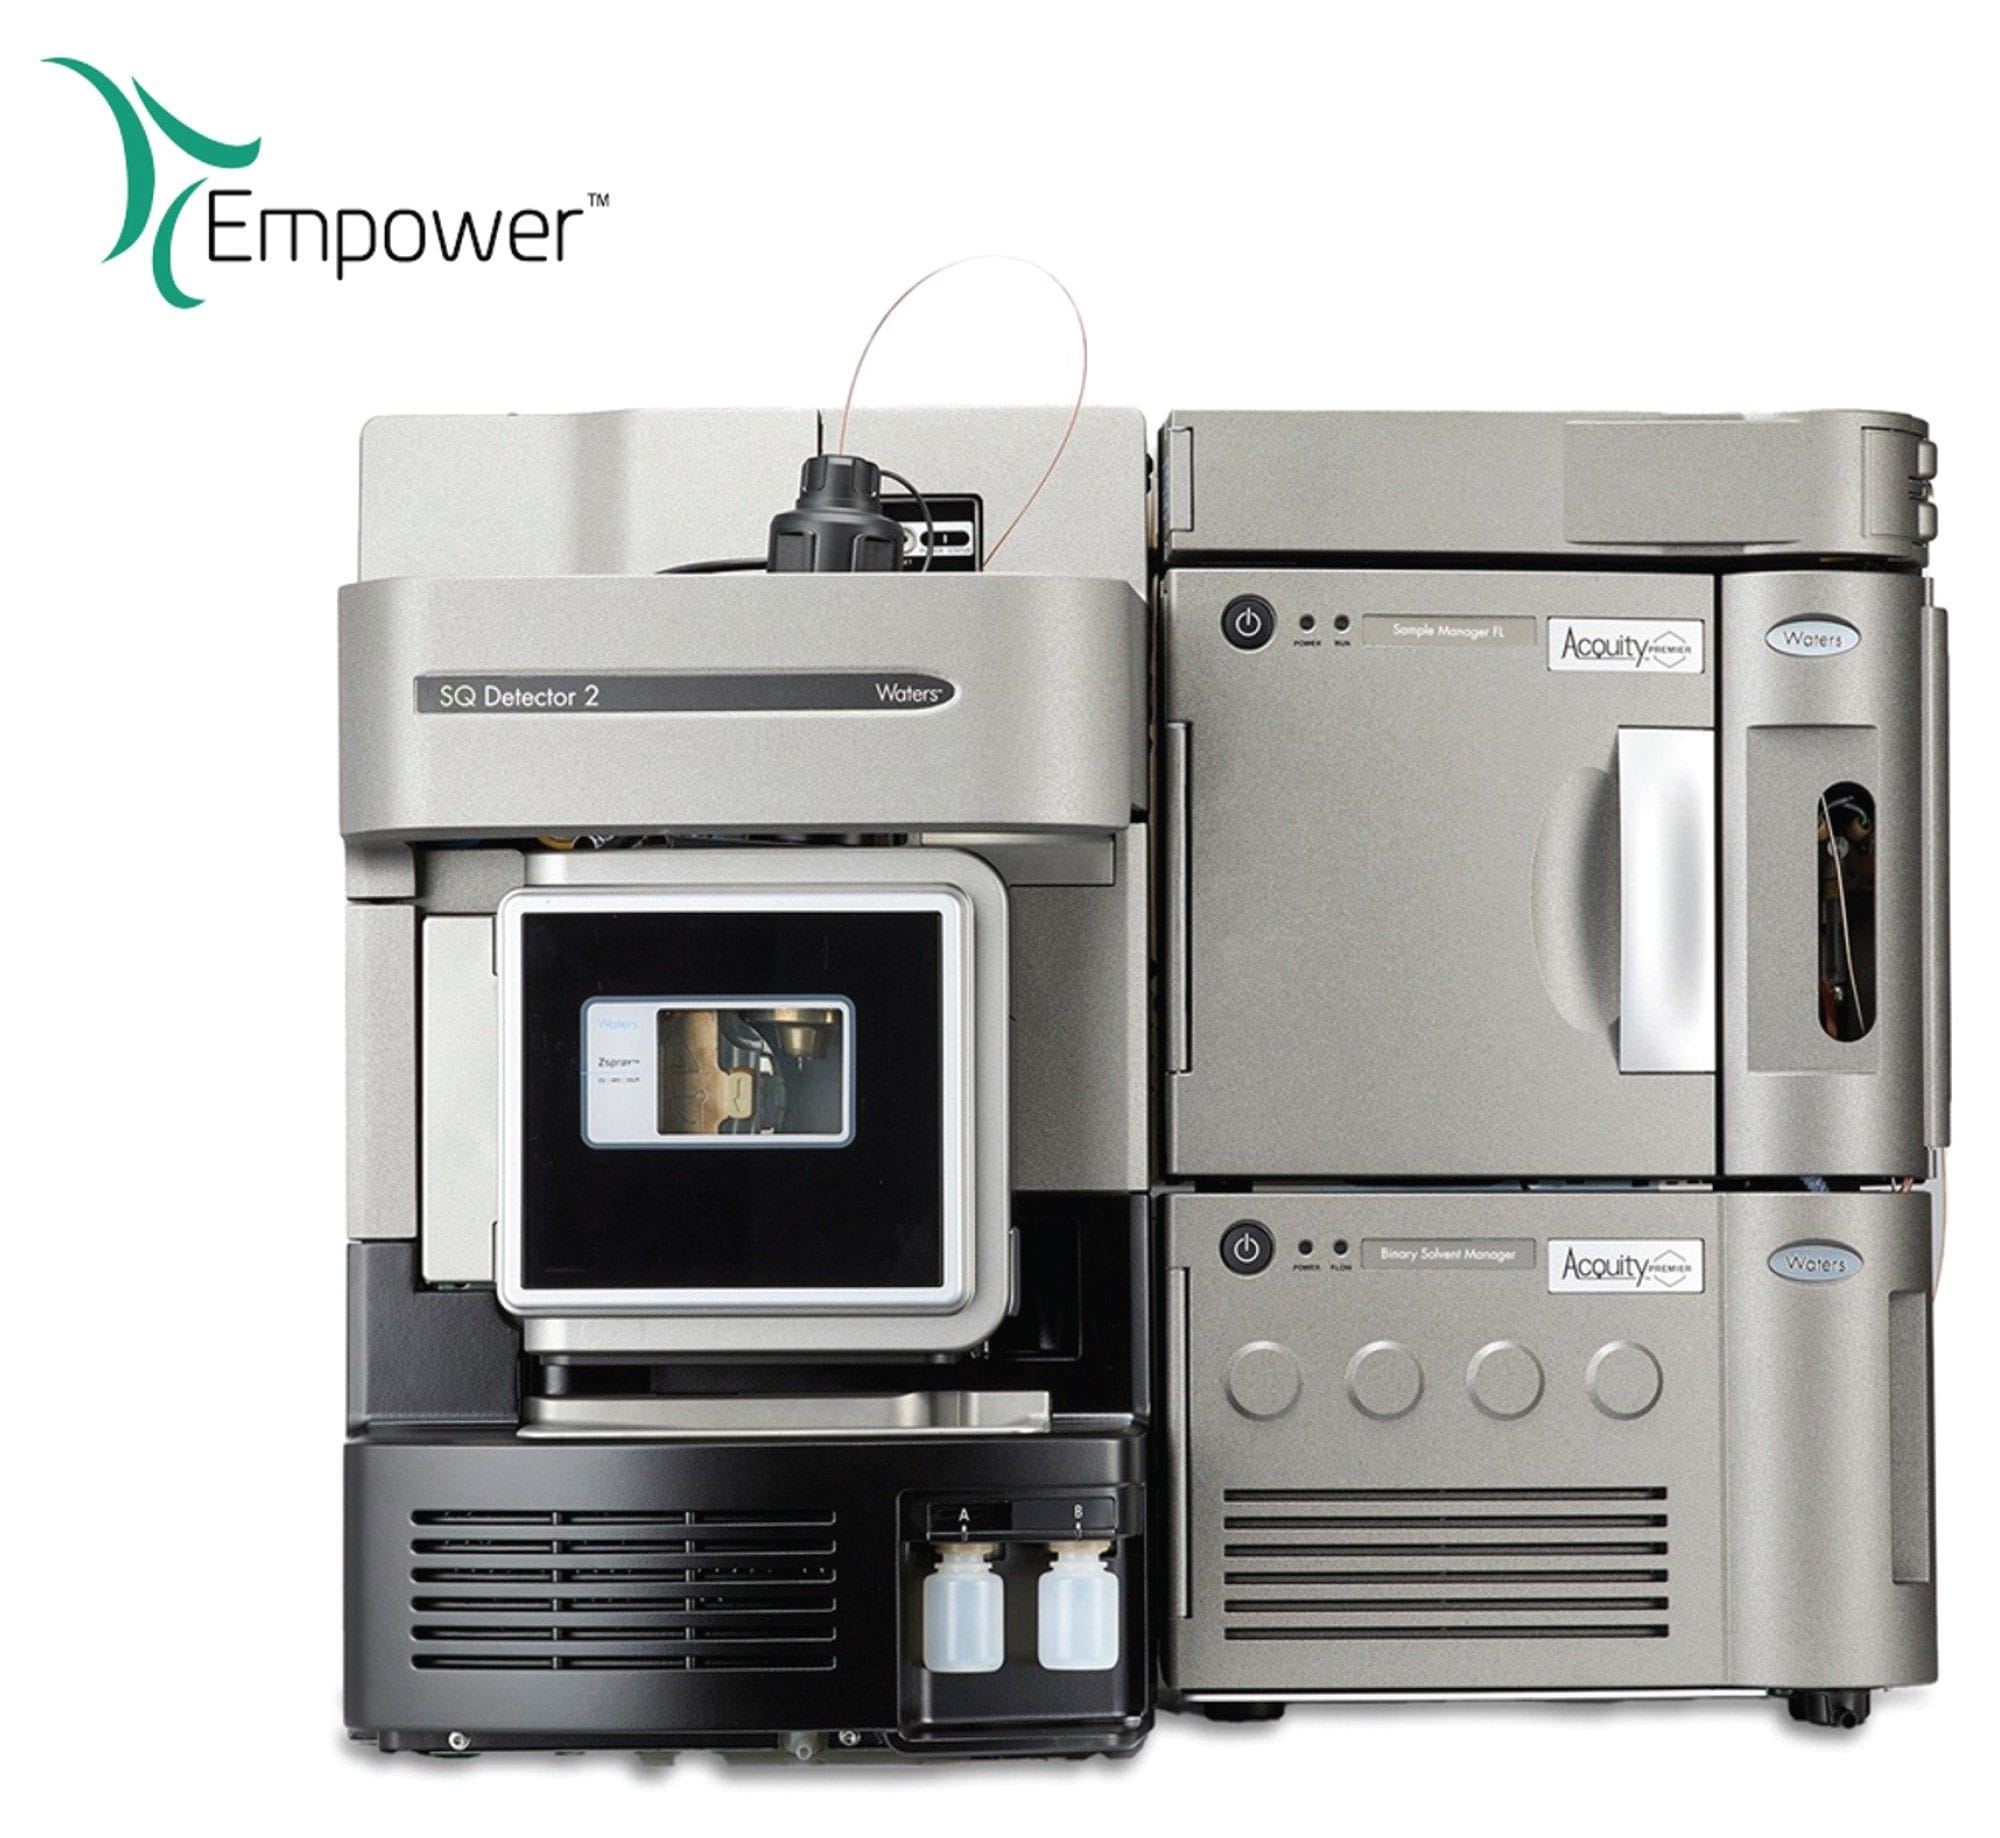
Traditional UHPLC ASO impurity methods generally require long method run times, often up to 40 minutes per injection, which can limit sample throughput and therefore lab productivity. A recent study demonstrated that such methods can be scaled to a shorter ACQUITY Premier Oligonucleotide C18 UPLC column (130Å, 1.7 µm, 2.1 x 50 mm), which can reduce the injection run time to 6.5 minutes, while providing results comparable to established methods and without compromising chromatographic resolution or data quality for the ASOs investigated.4 MaxPeak High-Performance Surfaces (HPS) Technology in both the column and LC hardware reduce interactions between oligonucleotides and metal surfaces, which can otherwise contribute to adsorption, peak tailing, and low recovery - resulting in lower detection limits for trace-level impurities.
The shorter ultra-performance liquid chromatography (UPLC) method uses over 5x less sample per injection than established methods, while maintaining the required sensitivity and chromatographic performance. This reduction limits the consumption of valuable ASO standards and offers the potential of greater throughput and flexibility in sample analysis. Furthermore, shorter chromatographic methods reduce the consumption of mobile phase and environmentally harmful ion-pairing reagents, thereby limiting the environmental impact associated with the method.
For regulated QC testing, analytical performance must be supported by compliant and traceable data management. Empower CDS facilitates compliance with requirements such as 21 CFR Part 11 through controlled user access, audit trails, electronic signatures and secure retention of original data. Predefined acquisition, processing, and reporting methods standardise how UV and MS data are collected, calculated, reviewed, and reported, reducing analyst-dependent decisions and supporting consistent audit-ready and compliant data analysis.
Accordingly, this study evaluates a rapid IP-UPLC-UV-MS method using an ACQUITY Premier LC System and analytical column, in-line TUV detection, and SQ Detector 2 under Empower CDS control. It demonstrates a streamlined, compliance-ready solution for routine ASO QC batch testing that reduces solvent consumption and data file size, increases sample throughput, shortens analyst training time, and limits analyst-dependent errors.
Experimental
Sample Preparation
LC-MS grade acetonitrile (ACN) used in this analysis was purchased from Greyhound Chromatography (Birkenhead, UK). Cell culture grade water was purchased from Corning (Leiden, Netherlands). Acetic acid, tributylamine (TBuA), and ethylenediaminetetraacetic acid (EDTA) were purchased from Sigma-Aldrich (Gillingham, UK).
A lipid conjugated ASO LC-MS Standard (p/n: 186010747) was supplied by Waters Corporation (Wilmslow, UK).
The lipid conjugated ASO LC-MS Standard was stored at -20 °C. When prepared for analysis, the sample was allowed to thaw for 2 hours at room temperature and subsequently diluted to 0.1 mg/mL using cell culture grade water.
For this study, two forced-degradation samples were prepared to generate impurity profiles representative of stressed ASO material. Oxidative and thermal stress were selected to produce different degradation patterns, allowing the workflow to assess both chromatographically resolved impurities and species co-eluting within the principal UV peak.
For preparation of Sample 1, oxidative degradation was induced by treating the sample with 0.03% (v/v) hydrogen peroxide for 2 hours, after which the sample was diluted to a final concentration of 0.1 mg/mL using cell culture grade water. The dilution was sufficient to slow down the degradation for analysis.
For preparation of Sample 2, thermal degradation was induced by incubating a separate sample at 60 °C for 2 hours using a heat block. Following the thermal degradation step, the sample was stored at -20 °C for one hour, and similarly diluted to a final concentration of 0.1 mg/mL with cell culture grade water prior to analysis.
Dedicated glassware - such as measuring cylinders, volumetric flasks, and durans - were used for this analysis. Prior to preparation of the mobile phase, glassware was left to soak overnight in 10% acetic acid in H2O (v/v) and then rinsed well with cell culture grade water.
QuanRecovery™ Vials incorporating MaxPeak HPS were used to minimise adsorption to the vial surface. This complemented the low-adsorption characteristics of the ACQUITY Premier LC System and analytical column, reducing the potential for sample loss throughout the analytical flow path.
LC-MS Experimental Conditions
|
LC system: |
ACQUITY Premier UPLC System |
|
Detection: |
SQ Detector 2 |
|
UV system: |
Tuneable Ultraviolet (TUV) Detector |
|
Column: |
ACQUITY Premier Oligonucleotide C18 Column, 130 Å, 1.7 µm, 2.1 x 50 mm (p/n: 186009484) |
|
Column temperature: |
50 °C |
|
Sample temperature: |
5 °C |
|
Injection volume: |
1.6 – 4.8 µL |
|
Flow rate: |
0.52 mL/min |
|
Run time: |
6.5 minutes |
|
Mobile phase A: |
10% ACN, 5 mM TBuAA, 1 µM EDTA |
|
Mobile phase B: |
80% ACN, 5 mM TBuAA, 1 µM EDTA |
|
Vials: |
QuanRecovery Vials with MaxPeak HPS (p/n: 186009186) |
|
Ionisation: |
Negative Electrospray (ESI-) |
|
Capillary voltage: |
2.2 kV |
|
Desolvation temperature: |
450 °C / 600 °C |
|
Source temperature: |
120 °C / 150 °C |
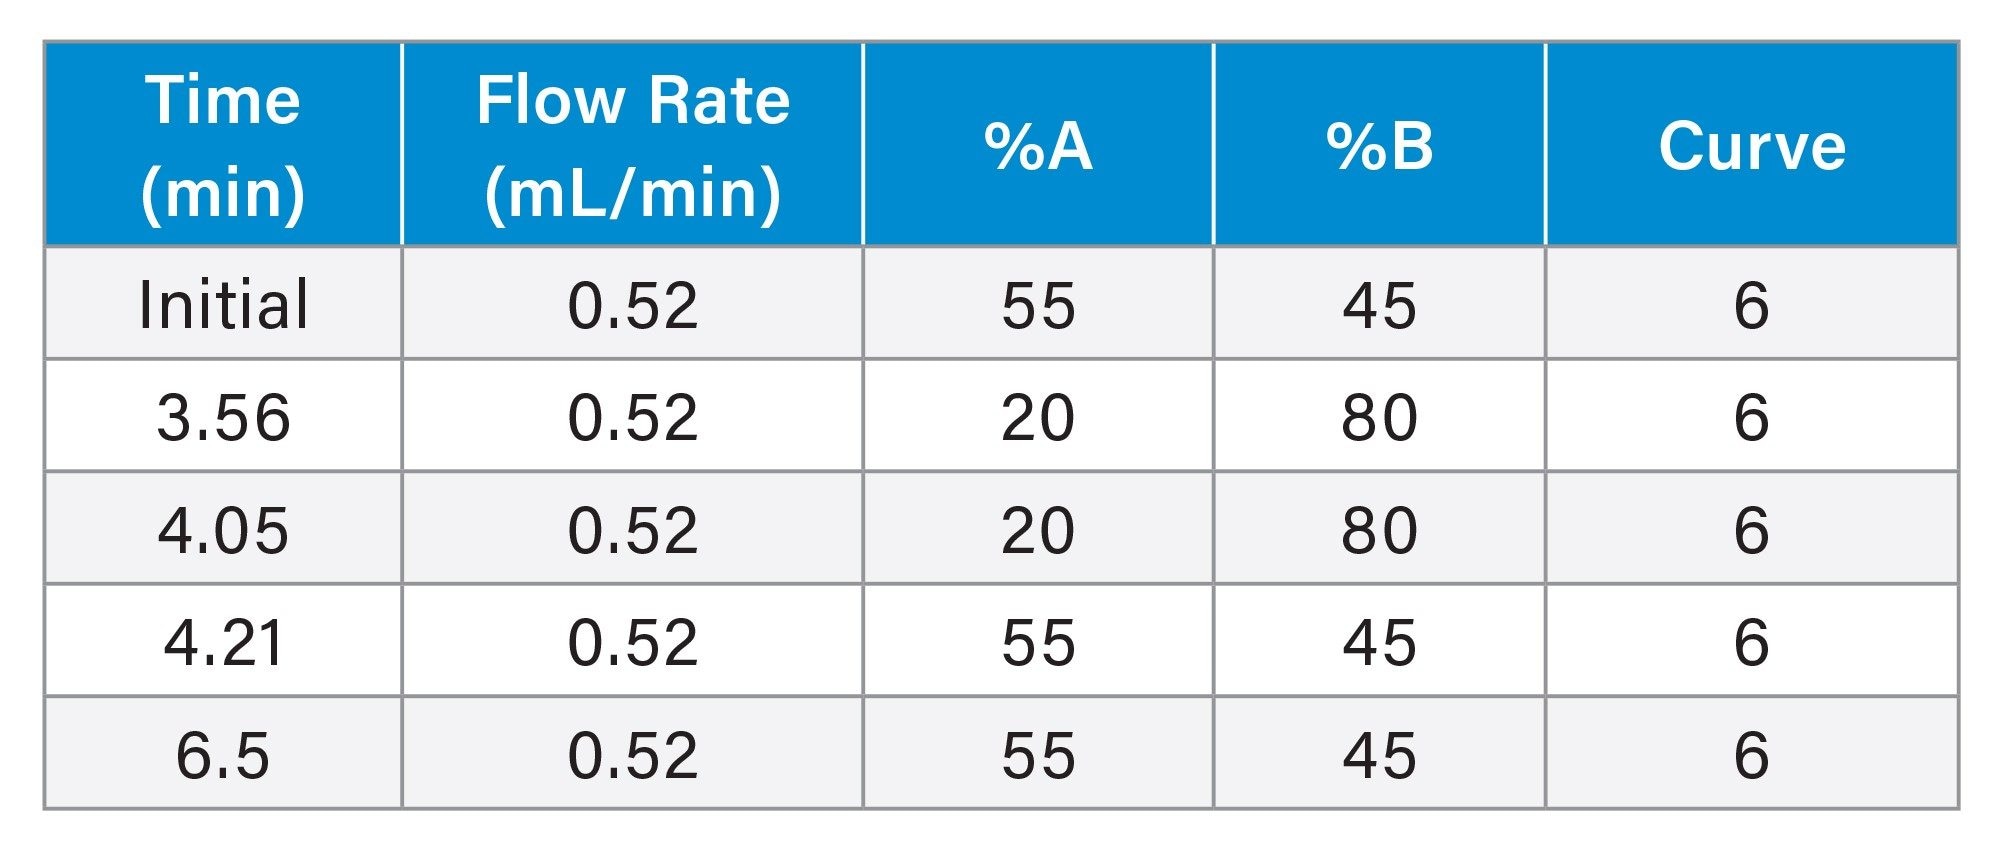
LC Gradient Table
Data Management
|
Data acquisition, processing and reporting: |
Empower 3.8.1 Chromatography Data System |
Results and Discussion
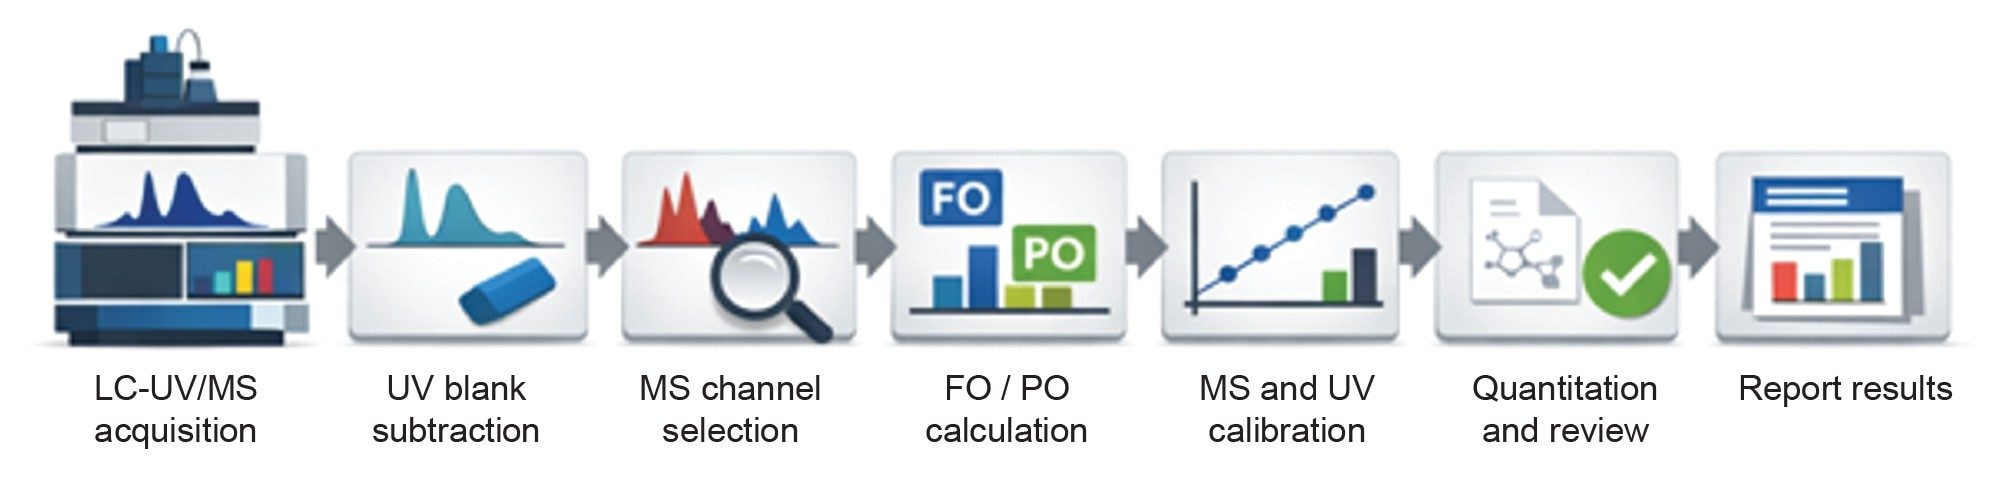
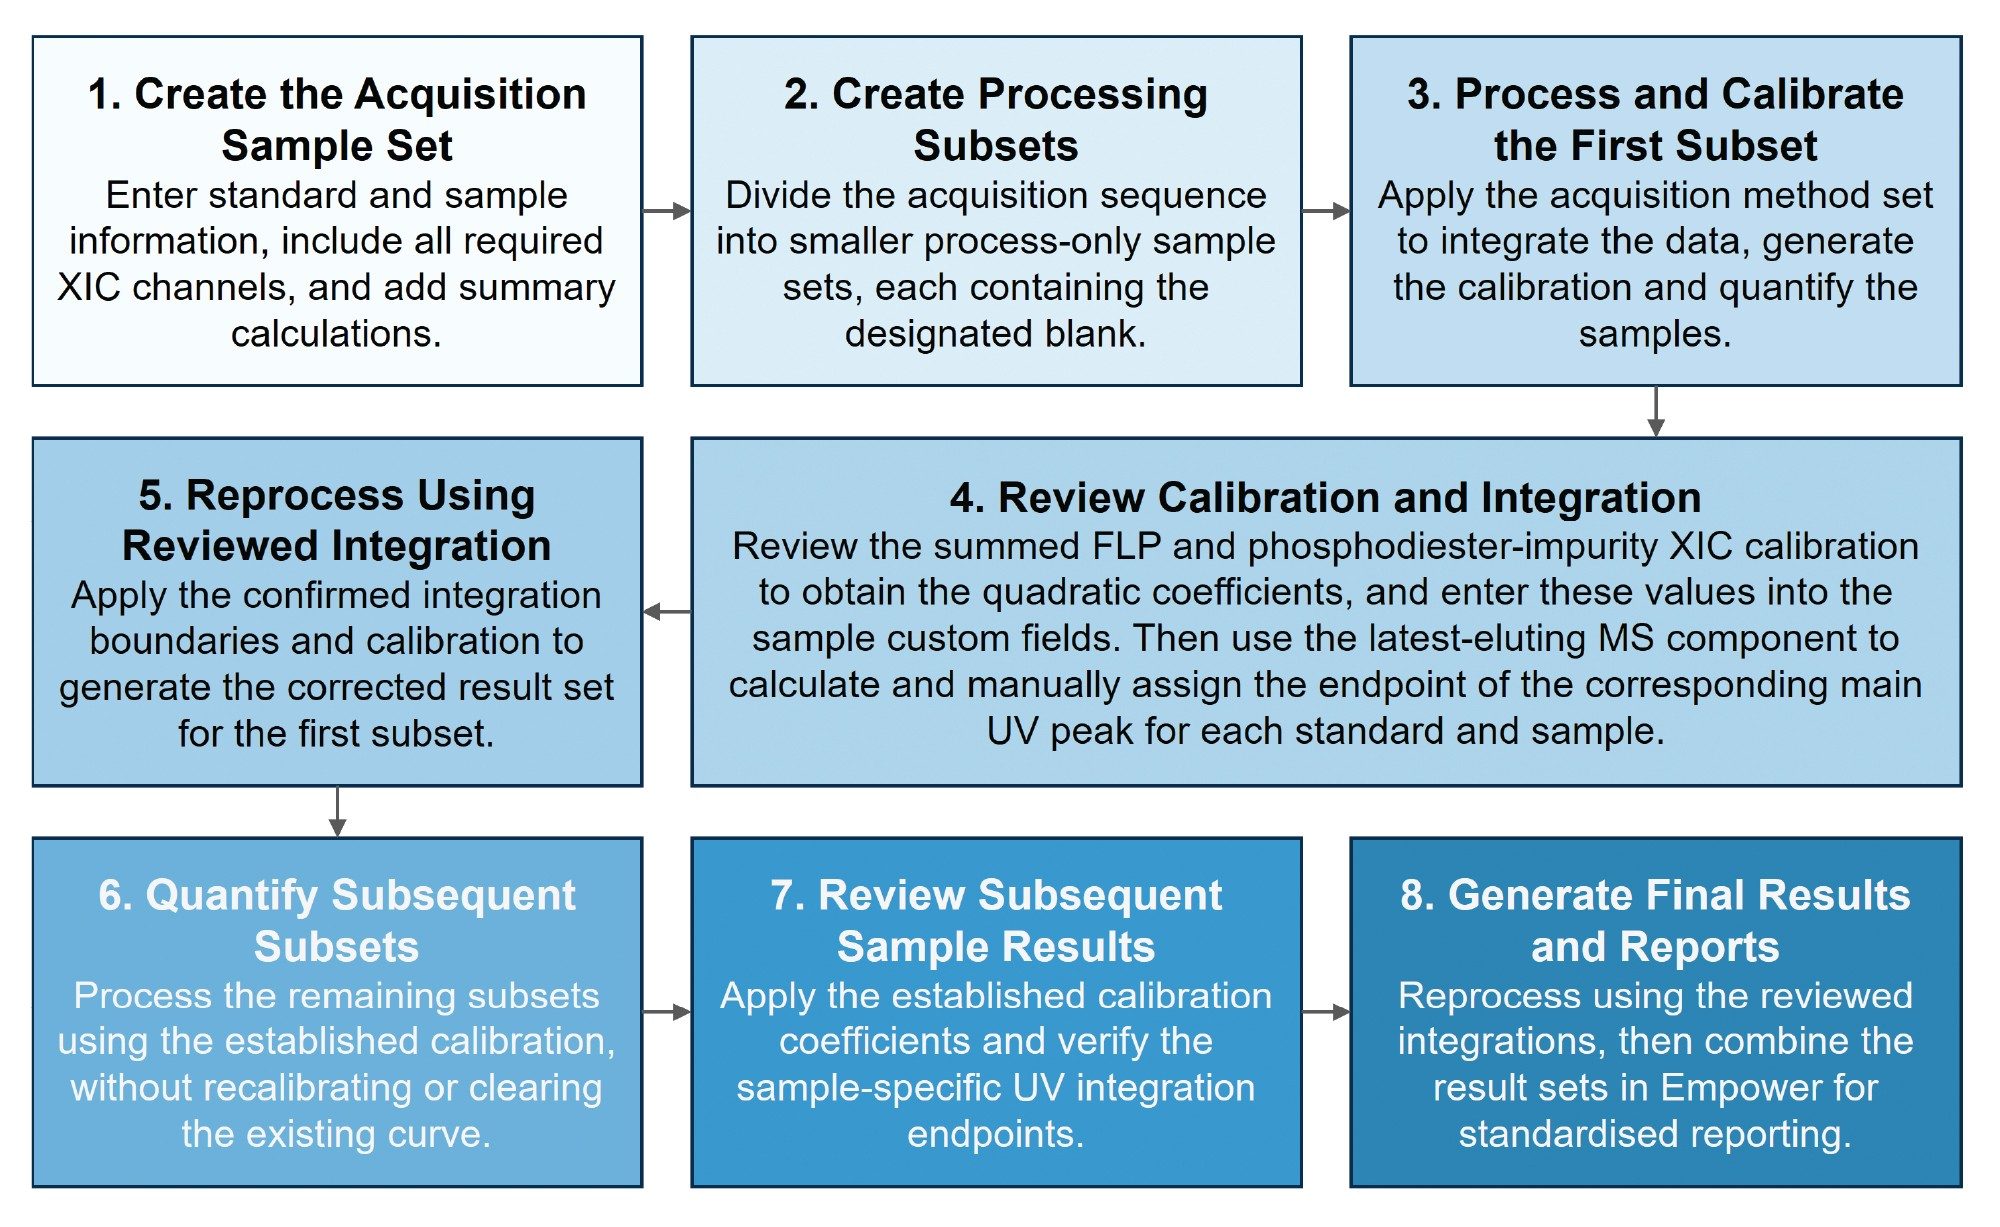
This workflow combined chromatographic separation with simultaneous UV and MS detection of the FLP and related impurities, a simplified overview of which can be seen in Figure 2. Following acquisition, UV blank subtraction removes background contributions from the mobile phase, while XICs isolate the relevant oligonucleotide ions for identification and impurity assessment. Alignment of the UV and MS signals enables the principal UV peak to be corrected for co-eluting species. The resulting identity, assay, purity and impurity data are subsequently consolidated within Empower CDS for review and reporting.
LC-UV-MS Acquisition
Evaluation was performed using the Waters lipid conjugated ASO LC-MS standard, a 16-residue gapmer containing a fully phosphorothioated backbone, methoxyethyl-modified termini and a 5′-palmitate conjugate. The standard was supplied at 5 nmol and had a monoisotopic mass of 6046.08484 Da.
Under negative electrospray Ionisation, the ASO produced a multiply charged ion distribution. The most abundant -4 charge-state signal at 1511.52 m/z was selected for extracted-ion measurement, with the acquisition range set from 350 m/z below to 150 m/z above this value. Selection of this predominant charge state provided the sensitivity and reproducibility required to monitor the intact oligonucleotide and related impurities, while operating within the mass range of the SQ Detector 2.
UV Blank Subtraction
The analytical sequence incorporated blank injections to account for background absorbance from the mobile phase and ion-pairing reagents. Within Empower CDS, the designated blank was subtracted from each TUV Detector chromatogram before integration. The blank-subtracted UV channel was then processed using predefined integration parameters, with the FLP identified as the principal component. This was necessary to obtain consistent peak areas and minimise background contributions to subsequent assay and purity calculations. In-line TUV detection (260 nm) provided the primary measurement of total oligonucleotide content and chromatographic purity. The area of the principal UV peak represented the FLP together with any unresolved co-eluting species, whereas peaks outside this region represented chromatographically resolved impurities.
MS Channel Selection
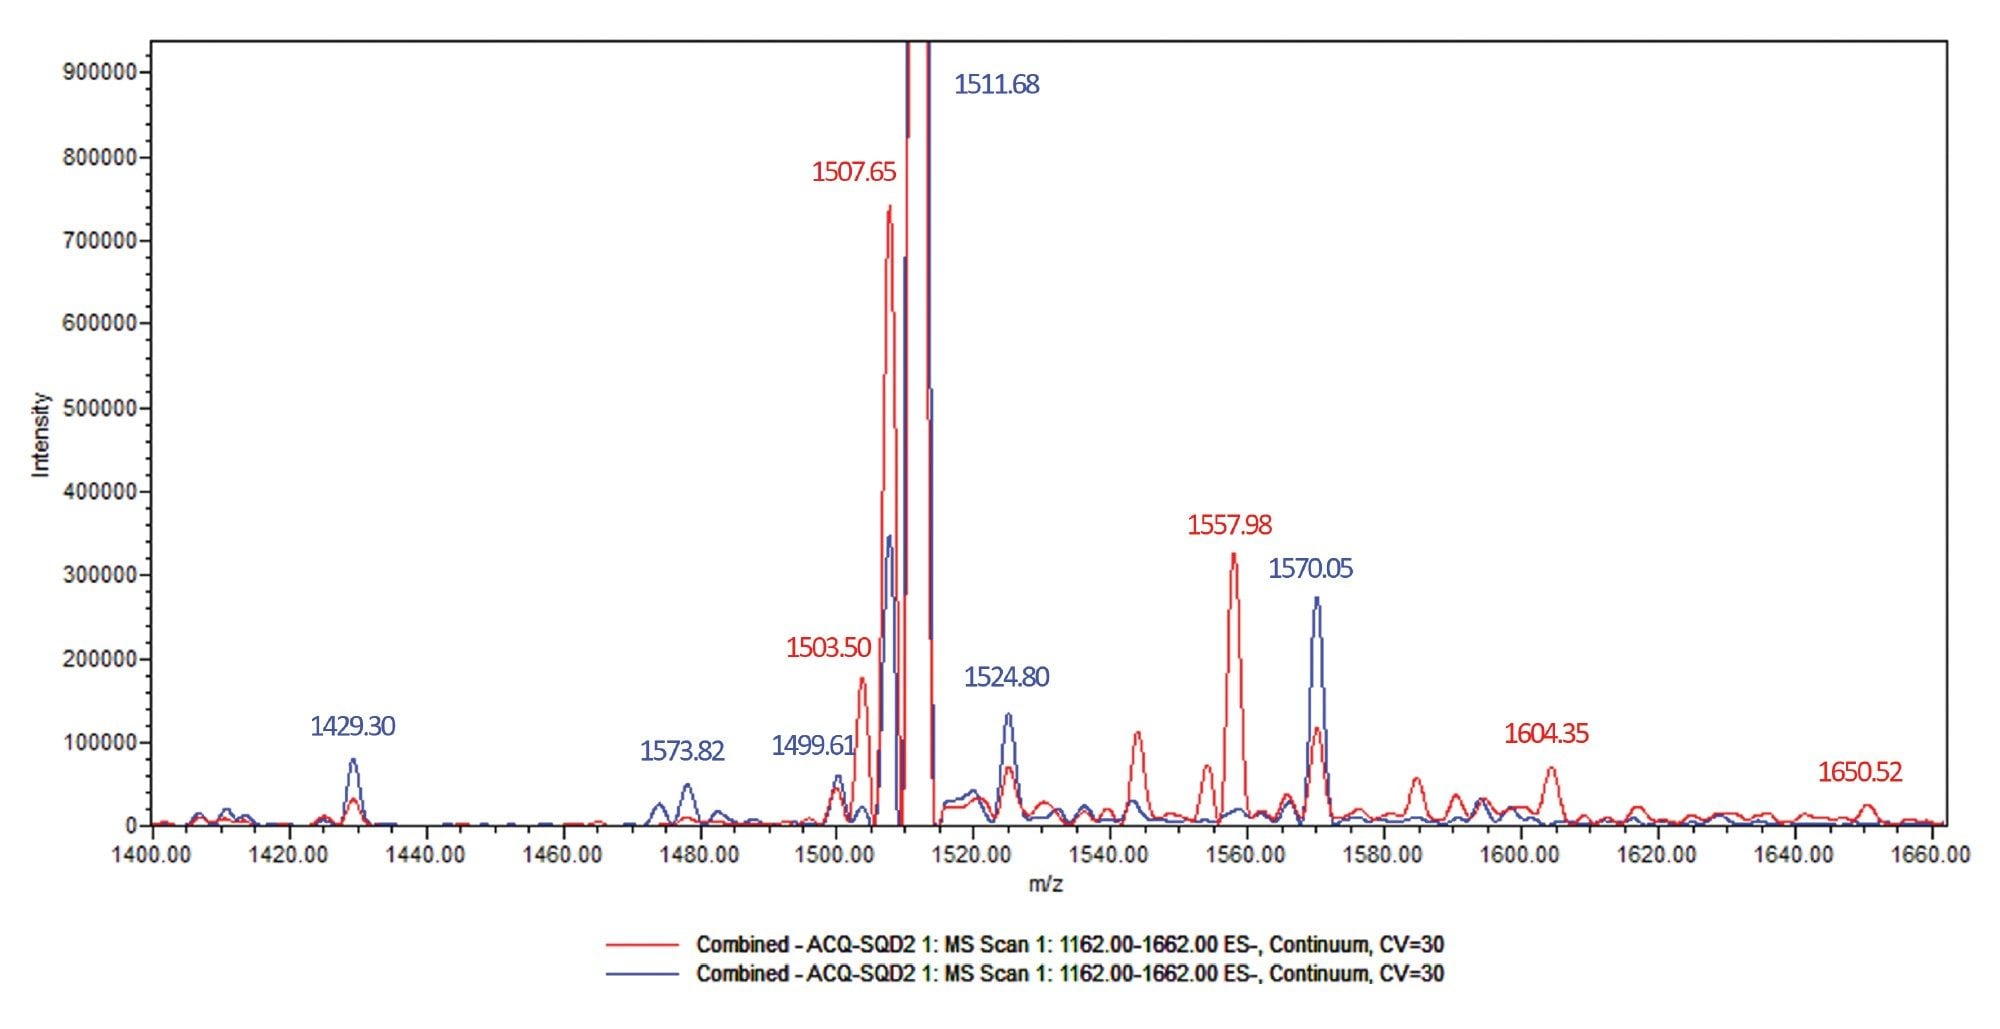
Full-scan spectra acquired under standard and harsh Ionisation conditions were compared to distinguish labile adducts from product-related impurities. Such a comparison is shown in Figure 3. The standard condition preserved intact ions for identity and impurity assessment, whereas the harsh condition promoted dissociation of weakly bound adducts. Signals that decreased markedly under harsh conditions were classified as potential adducts, while persistent signals were considered more consistent with covalent product-related species. This assessment guided the selection and interpretation of XICs, which were generated for the FLP, the FLP (P = O) impurity, and other specified product-related species.
The selected MS channels were processed using custom field functionalities within Empower Software, allowing the software to include peak areas and retention times in subsequent custom calculations. Selection of compound-specific XICs provides compound selectivity which complements the UV chromatographic data, enabling species co-eluting within the principal UV peak to be assessed individually.
FLP/FLP (P = O) Calculation
The FLP and FLP (P = O) have the same oligonucleotide length but differ in backbone composition. The FLP (P = O) species contains one phosphodiester linkage in place of an intended phosphorothioate linkage and is therefore approximately 16 Da lower in mass than the FLP. At a charge state of -4, this corresponds to a difference of around 4 m/z, allowing the two components to be distinguished by MS even when they co-elute within the same UV peak.
The XIC areas of the FLP and FLP (P = O) were integrated separately and combined within a summed MS channel. Individual areas establish the relative contribution of each species to the summed response. This allows the corrected total response to be apportioned between the FLP and FLP (P = O) component despite their incomplete chromatographic separation.
Additionally, MS information was used to define the trailing integration boundary of the principal UV peak. The endpoint of the latest-eluting relevant MS component was determined, and its time difference from the FLP retention time was calculated. This offset was applied to the principal UV peak, providing a sample-specific integration endpoint based on the selectivity of the MS data. This processing step is partly explained in Figure 4.
MS and UV Calibration
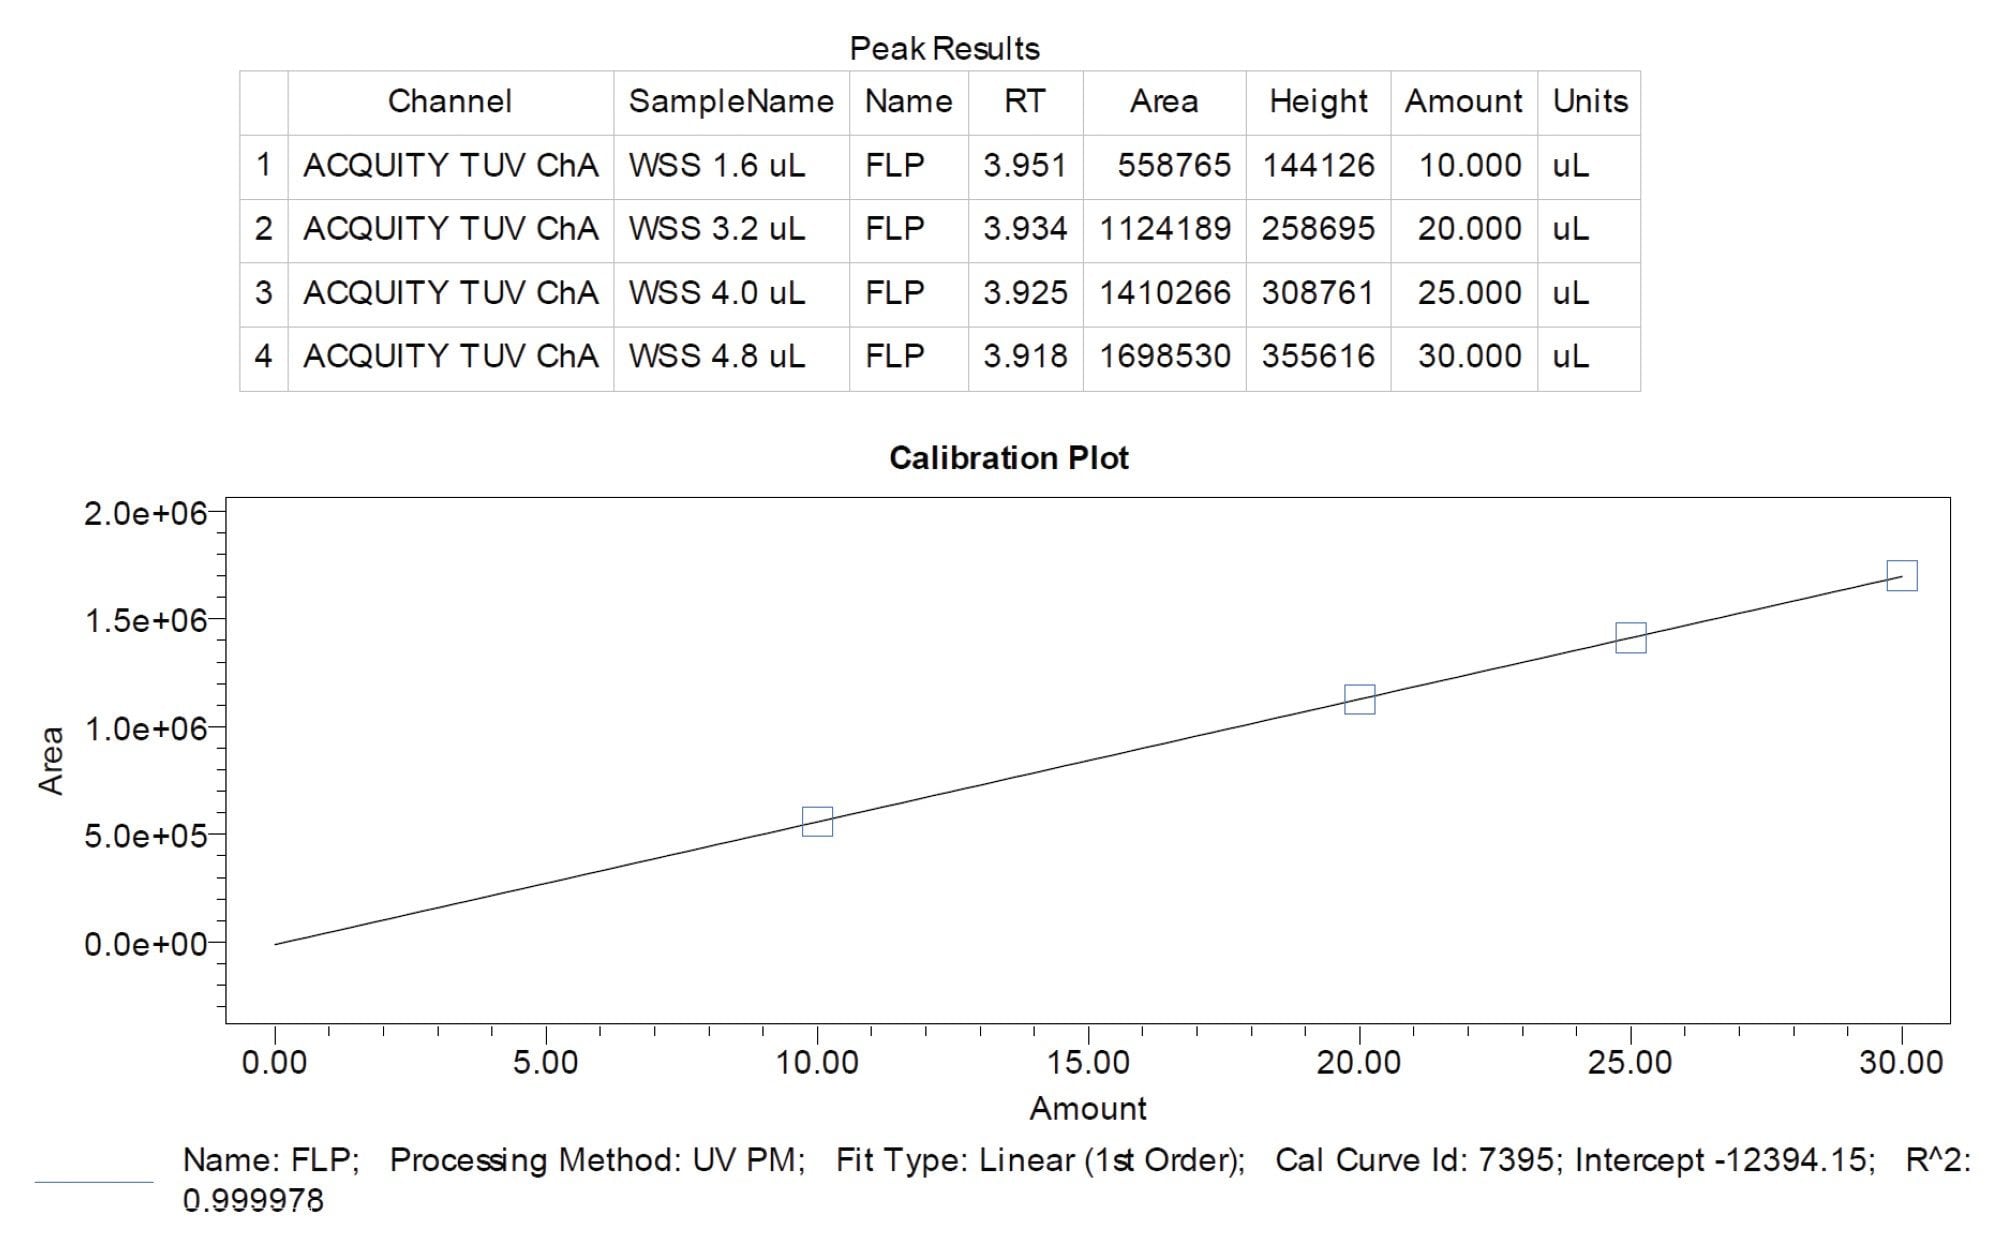
Two separate external calibration relationships were established because UV and MS served different analytical purposes. The calibration sequence, comprised of the 0.1 mg/mL ASO reference standard, was injected at four sequential volumes (1.6-4.8 µL) alongside reagent blank injections. No internal standard was used in this analysis. For UV calibration, the blank-subtracted area of the principal UV peak was plotted against the injected amount of reference standard, corrected for its assigned UV purity and calculated from its concentration and injection volume. The resulting linear calibration was used to determine the concentration of the principal oligonucleotide component in the study samples (Figure 5).
Varying the injection volume generated the required range of on-column amounts from a single reference-standard solution, while the corresponding summed FLP/FLP (P = O) MS responses were used to establish the quadratic MS calibration. This approach simplified standard preparation and limited consumption of valuable reference material.
A separate quadratic MS response curve was generated from the summed FLP and FLP (P = O) XIC areas obtained across the injection-volume series. This calibration accounts for non-linear MS response across the working range, potentially resulting from changes in Ionisation efficiency or partial signal suppression with greater on-column loading. The quadratic coefficients were entered into the appropriate Empower Software custom fields and applied to the samples during subsequent processing, as shown in Figure 4.
Quantitation and Review
Initial processing applies UV and MS processing methods, generates calibration curves and integrates the relevant chromatographic channels. The result set is then reviewed to confirm quadratic MS coefficients and evaluate blank-subtracted UV integration boundaries. The calculated endpoint derived from the latest-eluting MS component is manually applied to the principal UV peak for each standard and sample.
Following review, data are reprocessed using the confirmed integration boundaries. The linear UV calibration determines concentration and purity, while the quadratic MS relationship corrects the summed response of the FLP and FLP (P = O). The corrected response is then assigned between the two species according to each relative XIC area.
Impurities resolved outside the principal UV peak, such as the one seen in Figure 6, were calculated directly from their relative UV areas.
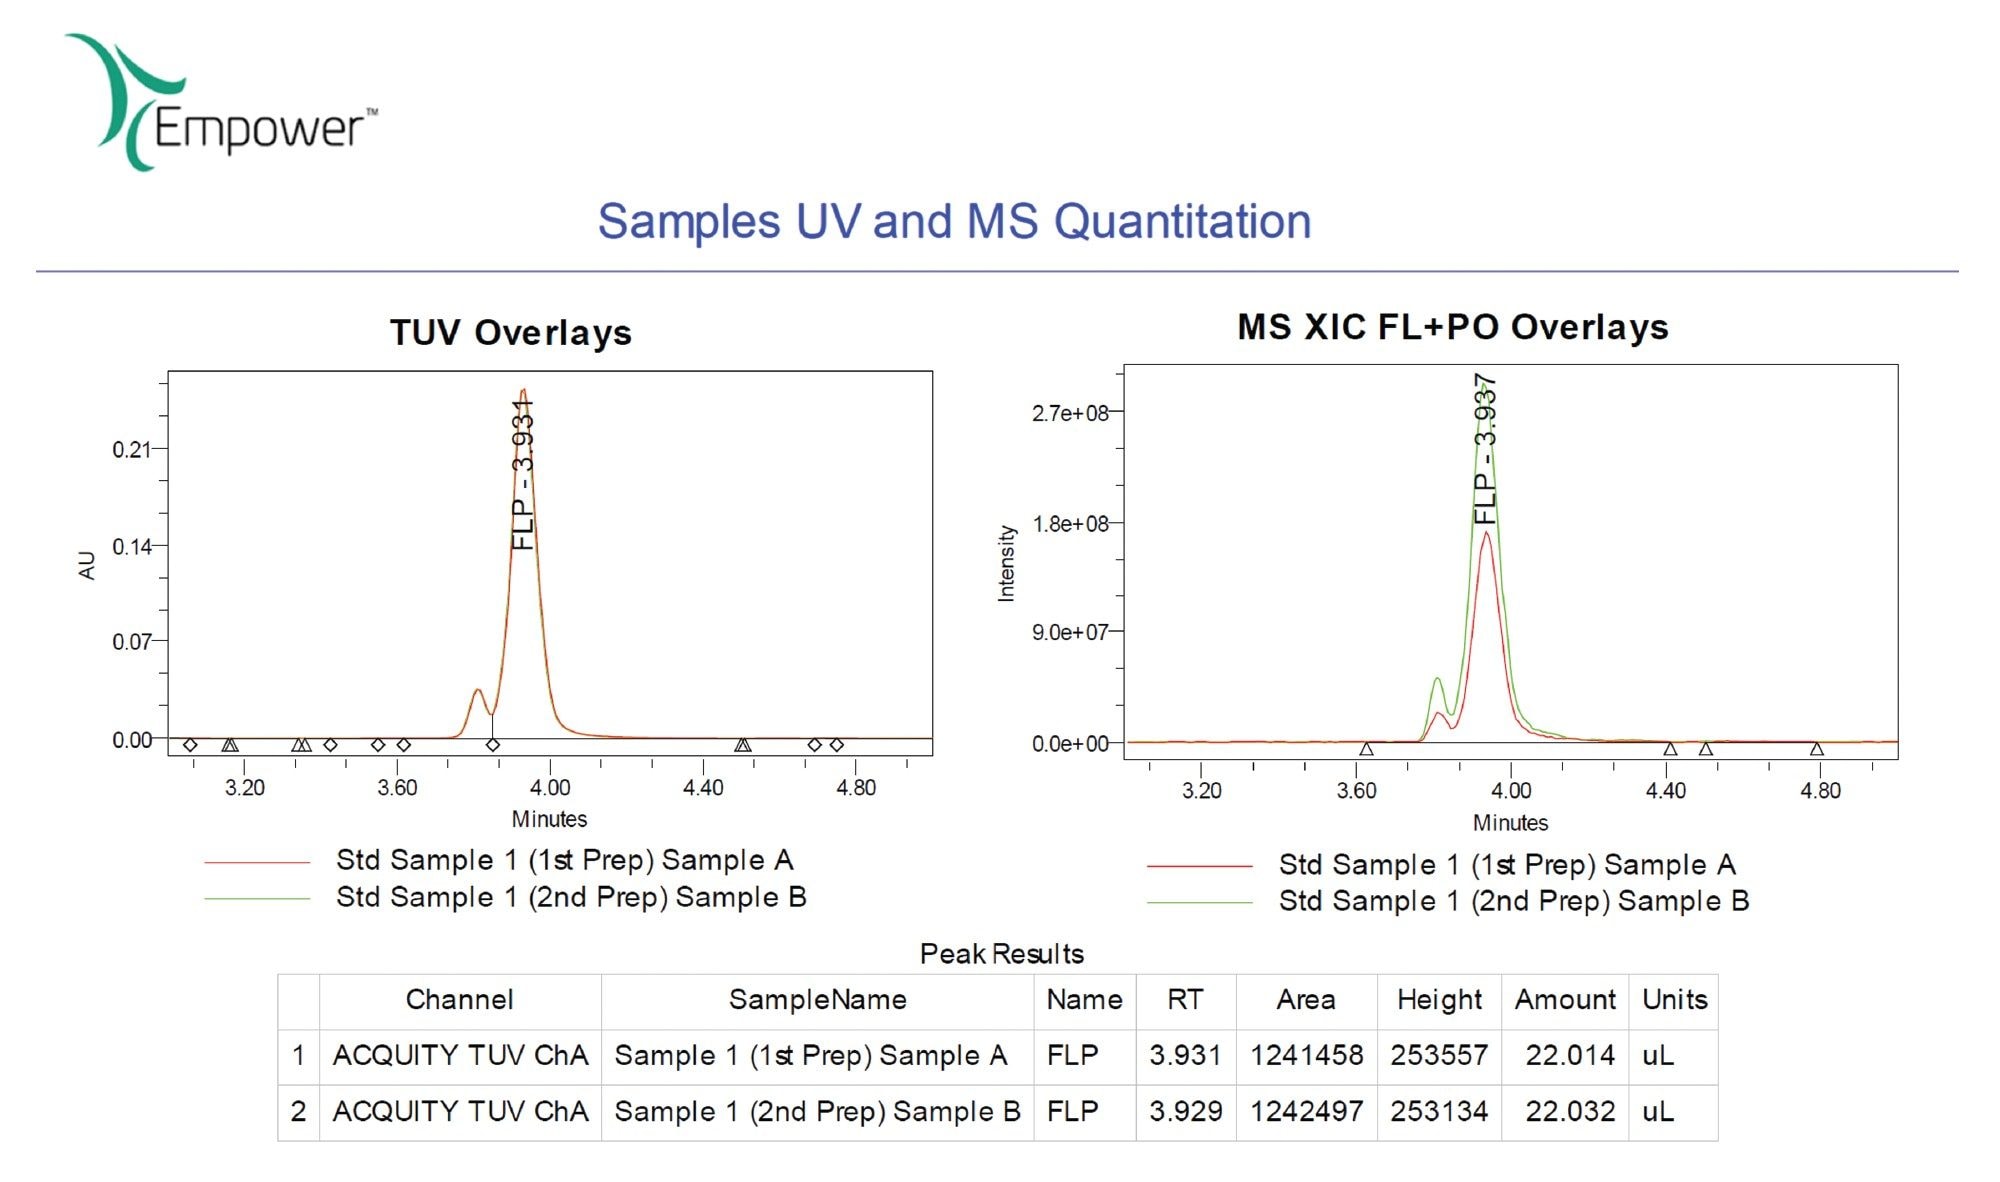
Components within the principal peak are assessed using their corrected MS responses, which are related back to the UV purity of the main peak. This combined approach retains the quantitative robustness of UV detection while using MS to confirm identity and distinguish co-eluting species.
Due to the large number of extracted channels, the acquisition sequence was divided into smaller process-only sample sets for more efficient processing. The first subset contained the calibration standards and established the calibration relationships. Subsequent subsets were quantified using the existing calibration without clearing or reconstructing the curves. Each subset retained the designated blank required for UV background subtraction.
Reporting Results
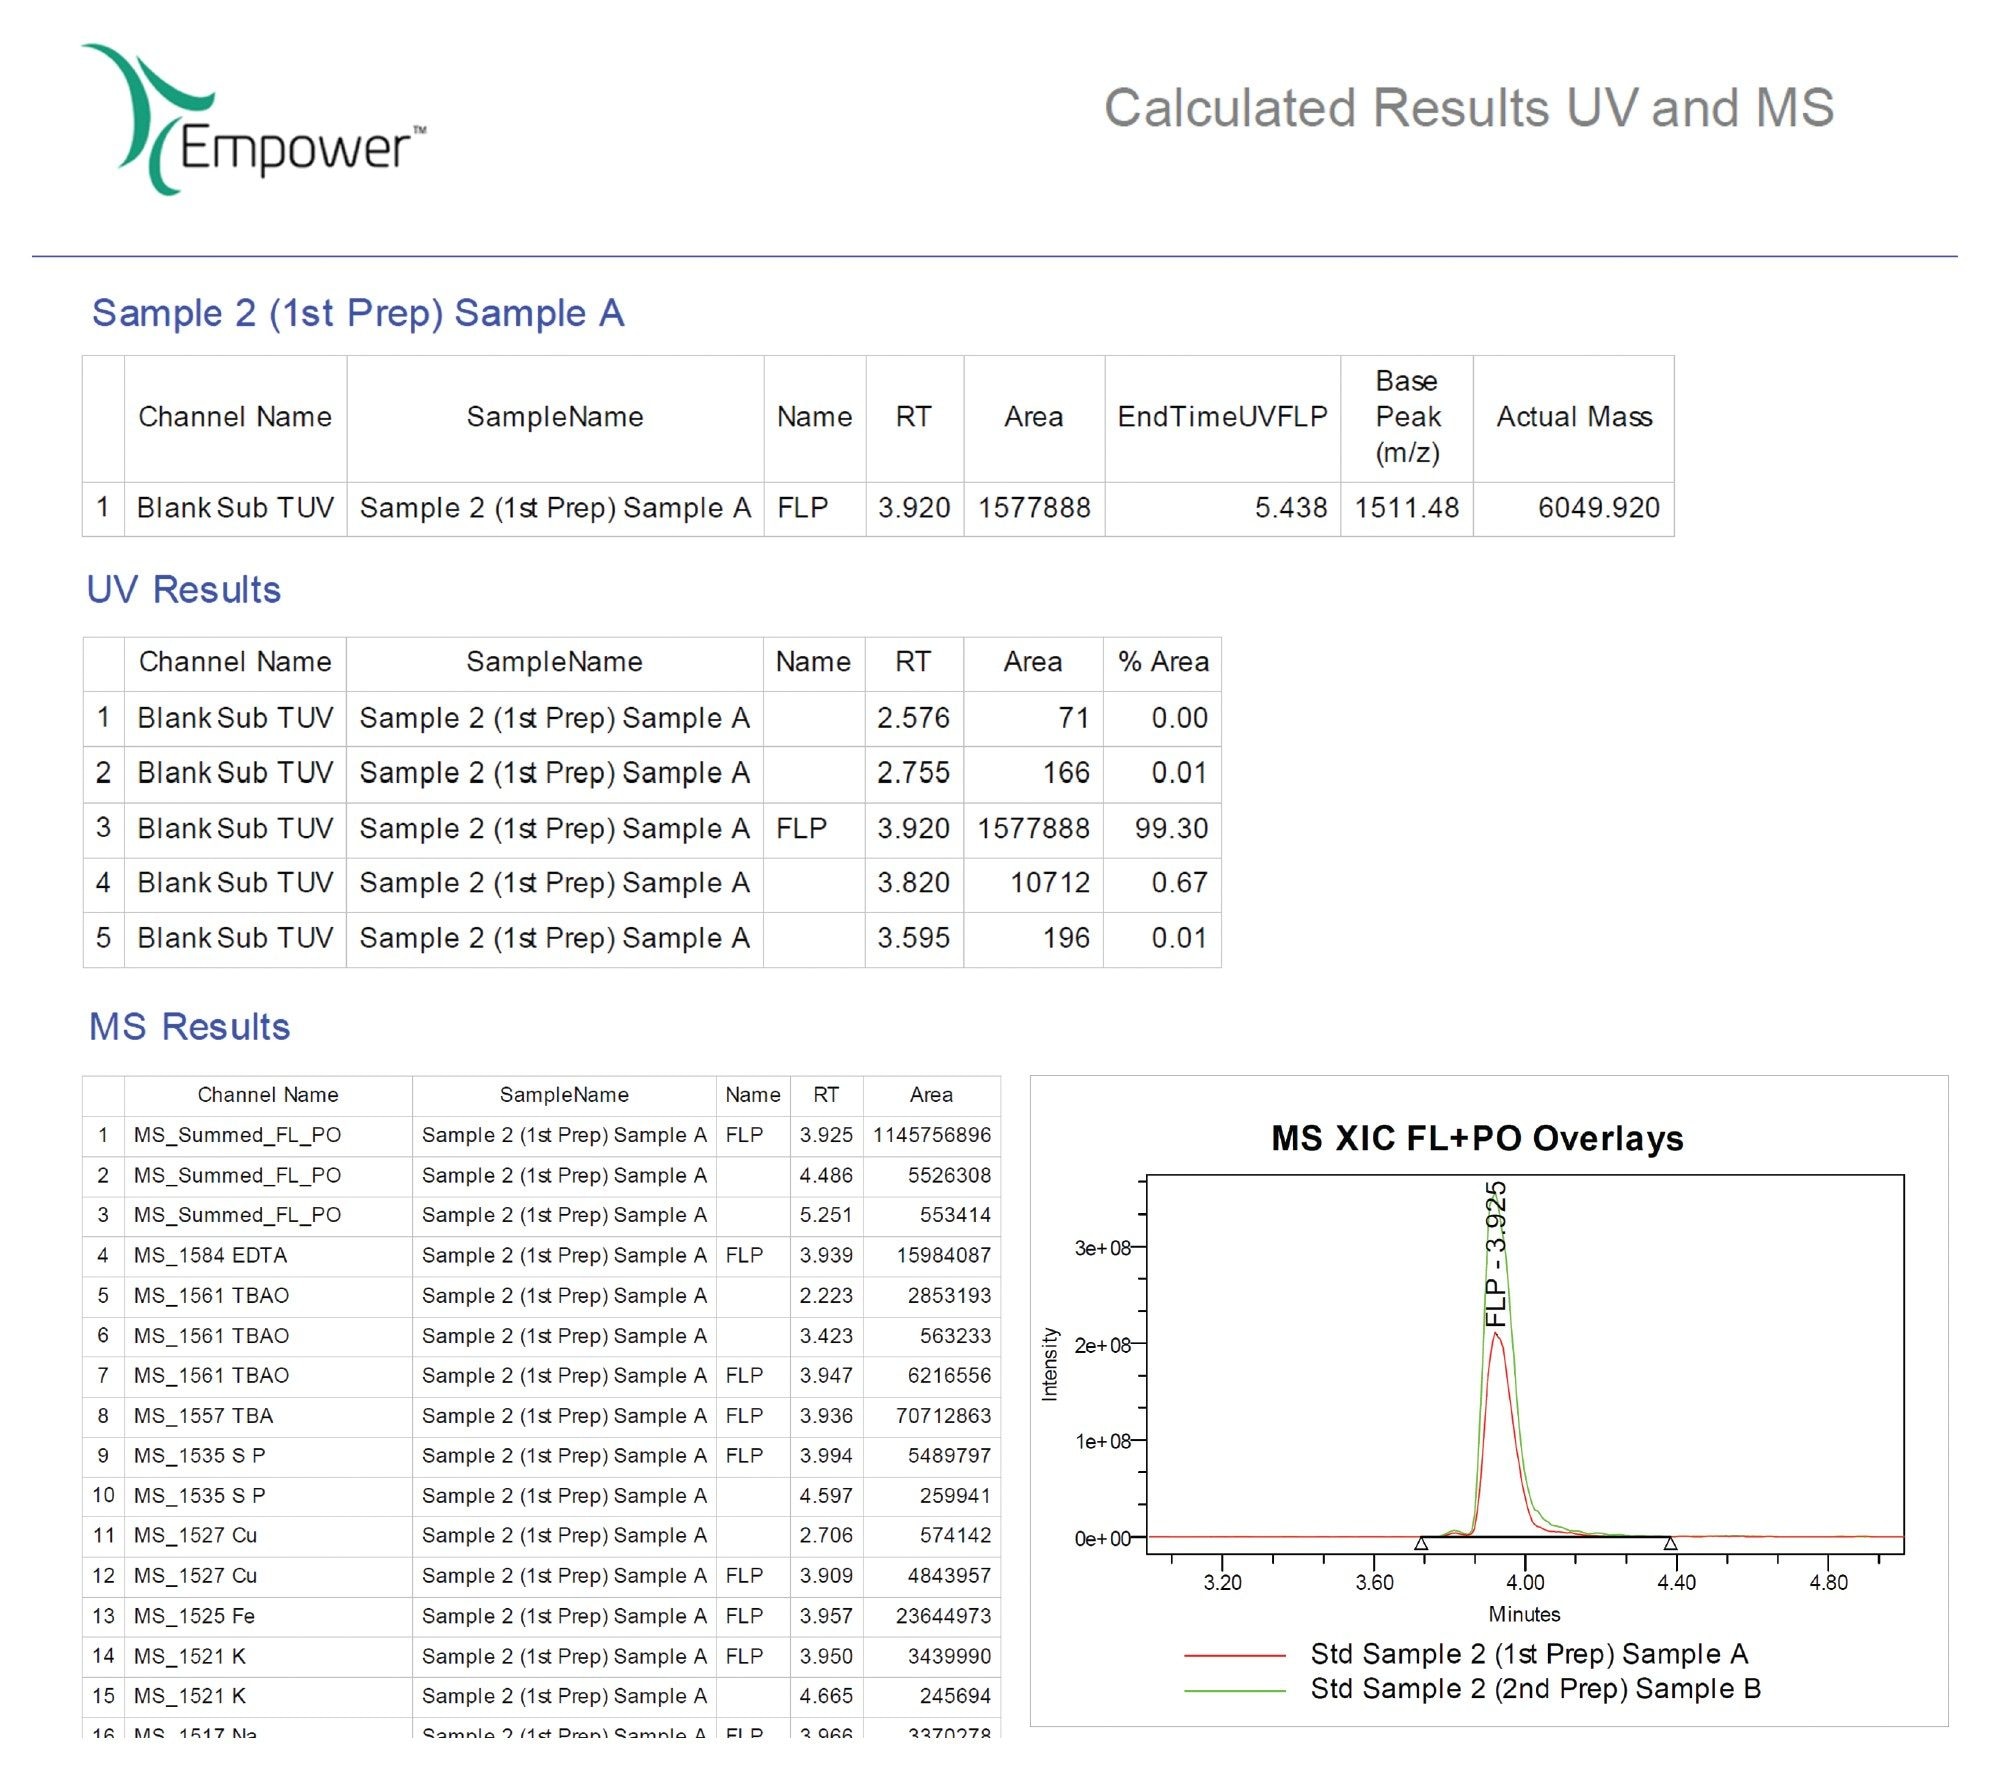
Following quantitation and review, the corrected result sets are combined within an Empower CDS report. The final report consolidates sample information, UV chromatograms, nominal mass information, calibration data as well as calculated assay purity and impurity values. An example report can be seen in Figure 7. Once established, a report template enables the same predefined results and visual comparisons to be consistently generated and reviewed for subsequent sample sets.
Predefined acquisition, processing and reporting methods standardise how UV and MS data are collected, calculated, reviewed, and presented. Additionally, Empower provides controlled user access, audit trails, electronic signatures, and traceable processing histories, supporting implementation within a regulated QC environment.
Conclusion
This application note demonstrates a LC-UV-MS workflow combining UPLC chromatography, TUV detection, an SQ Detector 2, and Empower CDS to provide a rapid, robust, and compliance-ready approach for routine ASO impurity monitoring.
The workflow supports the structured progression from early characterisation to routine QC monitoring. Accurate-mass analysis using platforms such as BioAccord LC-MS System can first establish the FLP and impurity profile, after which defined mass targets and acceptance criteria can be transferred to the SQ Detector 2 and Empower CDS, for rapid and reproducible monitoring across batches.
The 6.5 minutes IP-RP-UPLC method preserves UV as a primary quantitative measure while using nominal mass information from the SQ Detector 2 to confirm impurity identity, distinguish co-eluting species, and support corrected purity and impurity reporting within Empower CDS. The sensitivity of the SQ Detector 2 enables confident detection and quantitation of impurities-related species.
Although the underlying data treatment is complex, predefined Empower CDS methods, custom calculations, and report templates standardise blank subtraction, calibration, XIC processing, component apportionment, review and reporting - within a traceable, inspection-ready controlled chromatography data system. Once the Empower CDS method is established and optimised for a specific compound, the data processing timeframe is reduced to minutes through streamlined reporting functionality. In conjunction with faster method runtime, this greatly decreases the timeline from sample-to-result.
Ultimately, this workflow enables faster data processing and more consistent batch-release decisions, while reducing analyst-dependent variability and processing errors and strengthening control of ASO product quality across routine QC testing.
References
- Capaldi, D; et al. (2017) Impurities in oligonucleotide drug substances and drug products, Nucleic Acid Therapeutics, 27(6), pp. 309–322. doi:10.1089/nat.2017.0691.
- Obexer, R; et al. (2024) Modern approaches to therapeutic oligonucleotide manufacturing, Science, 385, eadl4015. doi:10.1126/science.adl4015.
- Rentel, C; et al. Method referenced in: Agilent Technologies (2026) Determination of Purity, Assay, and Impurity Profile for a Ligand-Conjugated Antisense Oligonucleotide Using Agilent Oligo Analysis Accelerator for OpenLab CDS, Agilent Application Note 5994-7993EN.
- Elmekawy, A; et al. (2025) At-line analysis of antisense oligonucleotide purified fractions using fast chromatographic methods, Journal of Chromatography A, 1764, 466516. doi:10.1016/j.chroma.2025.466516.
720009528, August 2026


